Trinitys
- Göstergeler
- Yvan Musatov
- Sürüm: 1.0
- Etkinleştirmeler: 5
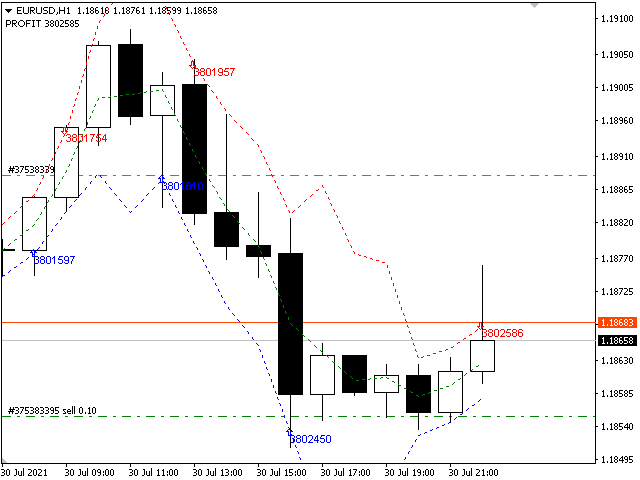
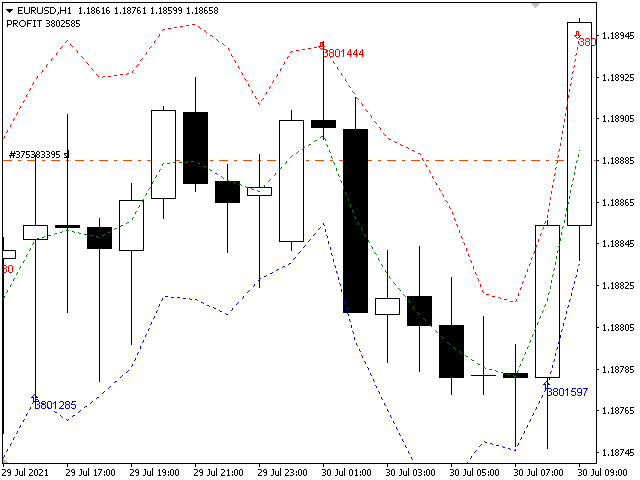
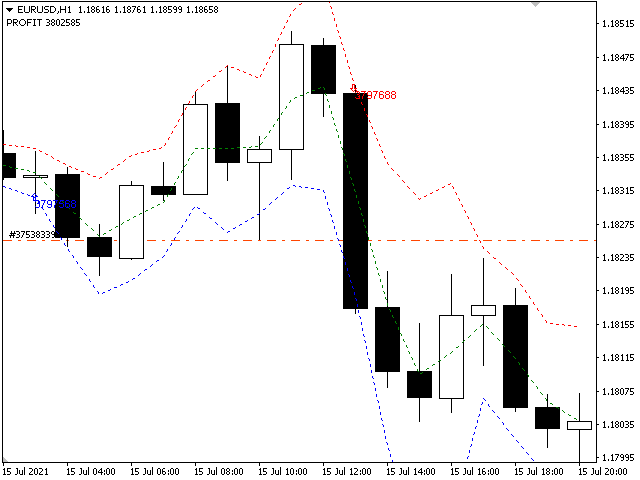
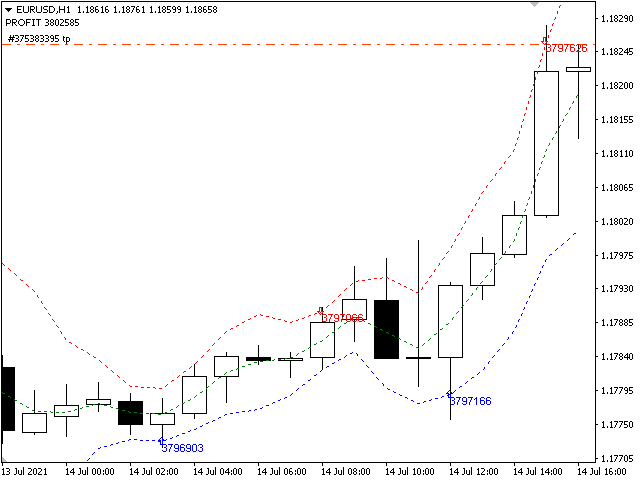
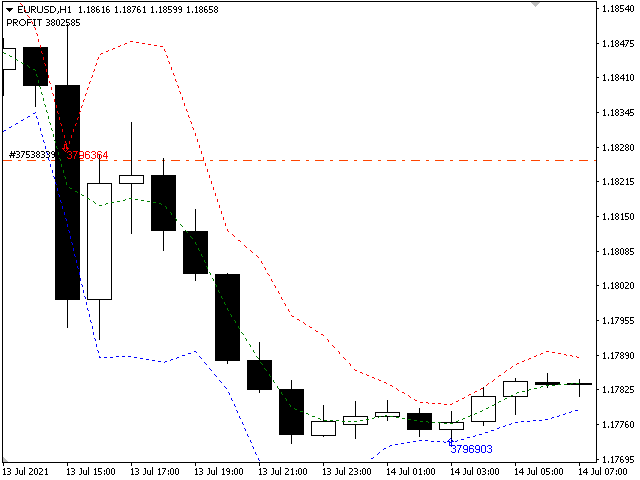
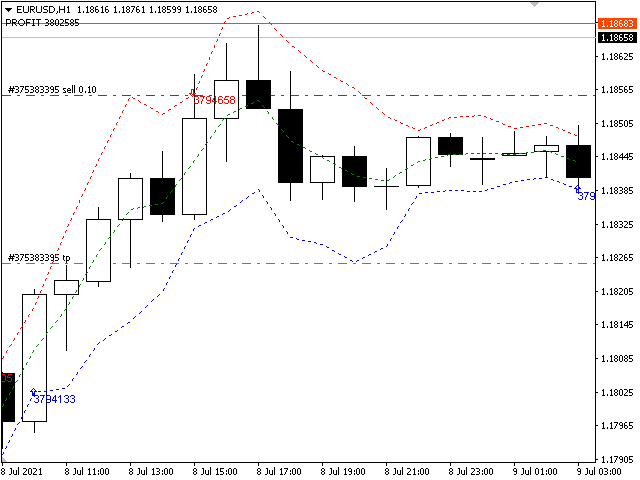
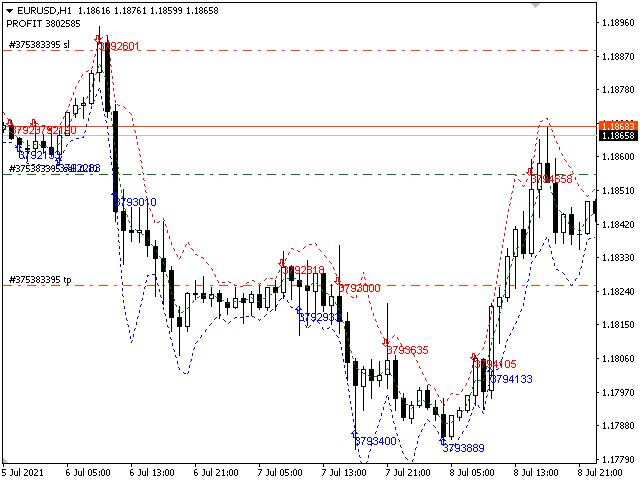
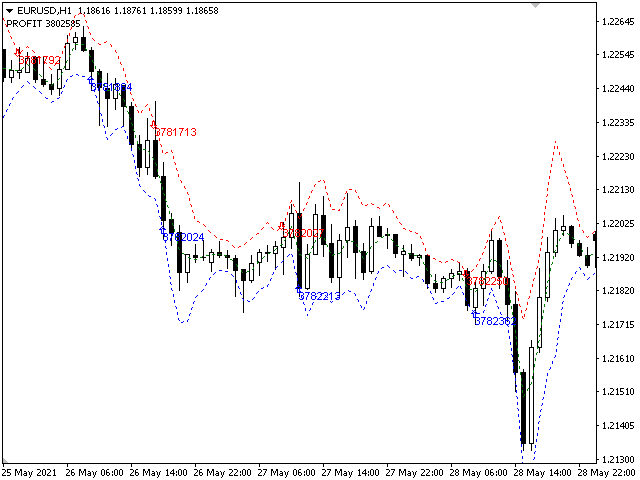
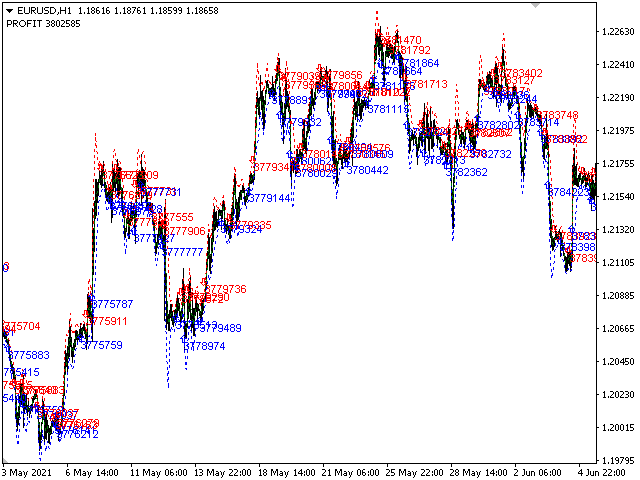
The Trinity indicator will tell you whether you have configured the indicator correctly, while you can specify the history interval in the bars that interests you. Look at the numbers on the chart near the arrows! These are pips of profit from a series of entries on the indicator. Profit pips are calculated at the specified interval. The signal can be read without any problems by any bot. Trading within the volatility range has always attracted traders, because most often it is simple instruments that turn out to be the most profitable. The Trinity indicator is a variant of building a price channel that gives signals of sufficiently high accuracy on any instruments and time periods. Bias or other additional parameters are not applied, that is, the indicator evaluates only the real dynamics.
The Trinity indicator is easy to use, it plots a real channel of two lines on the chart (red is the upper border, blue is the lower one), inside which, in fact, the price moves. The trading method is to pull back from the channel boundaries (when there is an arrow). Recommended entry points for long and short positions that appear in dynamics are indicated by arrows of the corresponding color and direction. Convenient, visual and accurate. Works on any time frame and on any instrument, including futures and stocks. The optimal timeframe, as for all trend indicators, is from H1 and above. By default the indicator is EURUSD and H1, the indicator needs to be configured for each period and symbol. The indicator near the arrows for entry displays profit pips from entries by the indicator. Spread losses can be set in the settings.

