Winshots Massive FX Profits
- Göstergeler
- Pawel Michalowski
- Sürüm: 1.6
- Güncellendi: 18 Mart 2024
- Etkinleştirmeler: 5
Stop searching for and trying new indicators! Get Winshots Massive FX Profits indicator and set yourself apart from the crowd.
Years of trading experience led us to the building of this all in one indicator!
Trade like the pro with Winshots Massive FX Profits!
This indicator uses the following methodologies to help you become a more consistent profitable trader:
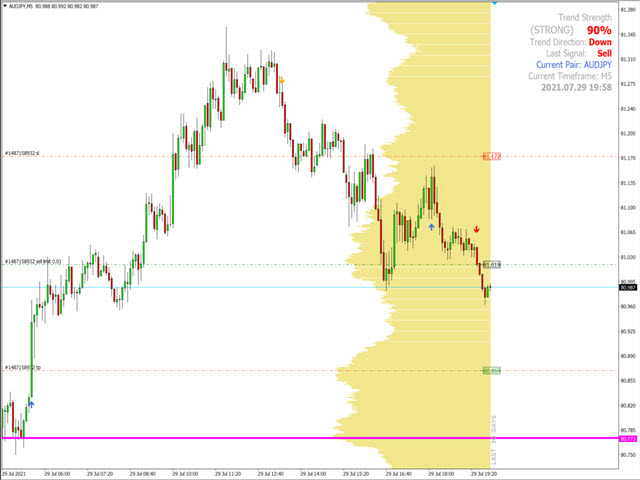
- MARKET VOLUME PROFILE
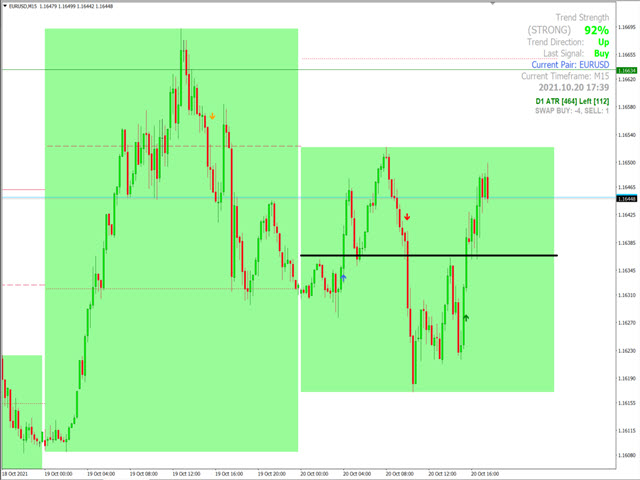
- DAILY CANDLE OUTLINE
- ATR LEVELS
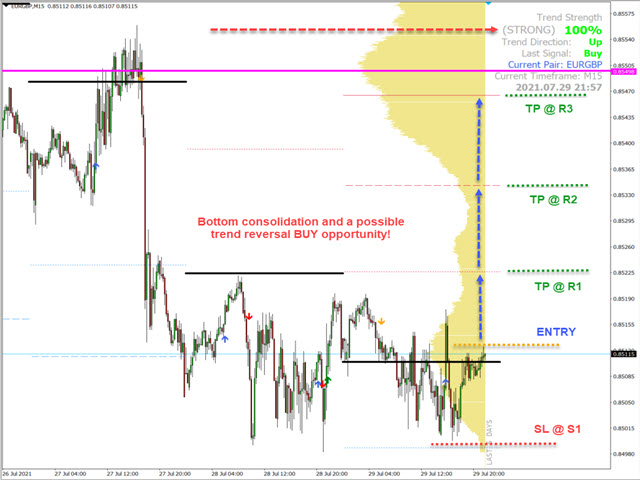
- DAILY PIVOTS LEVELS
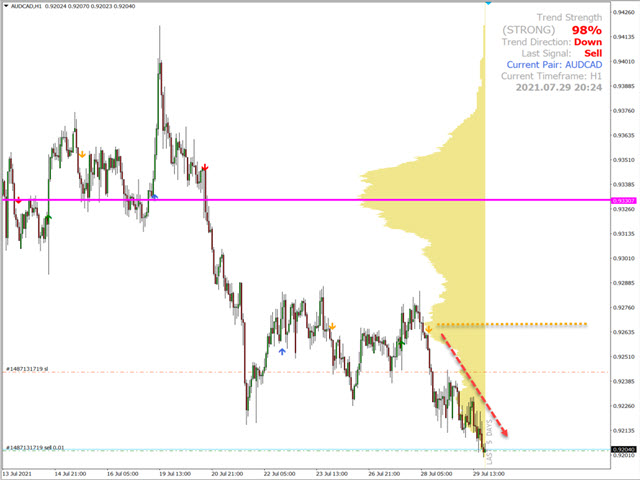
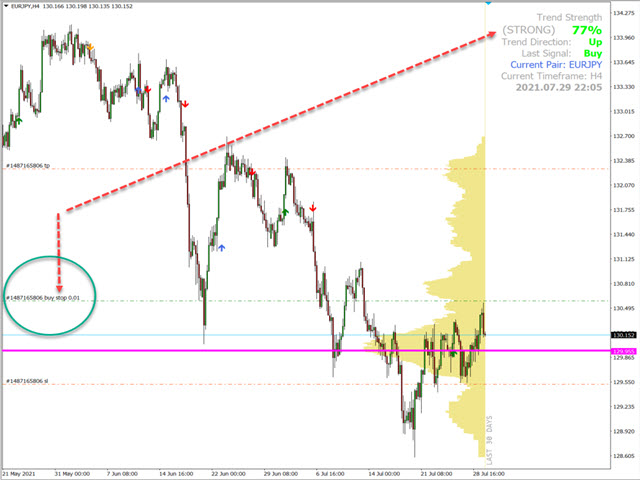
- PRICE CYCLES ANALYSIS
What is VOLUME PROFILE?
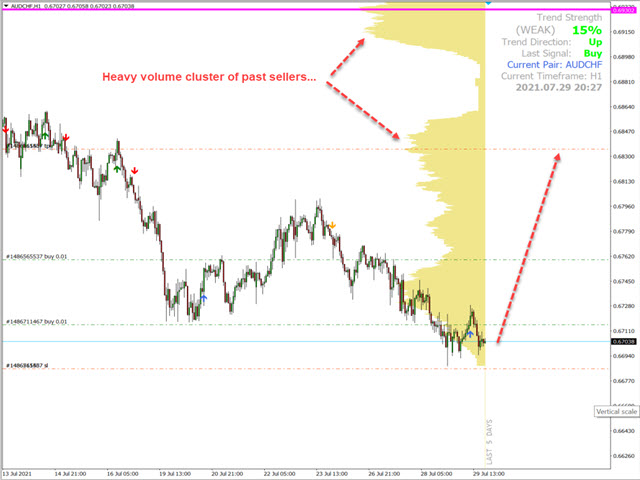
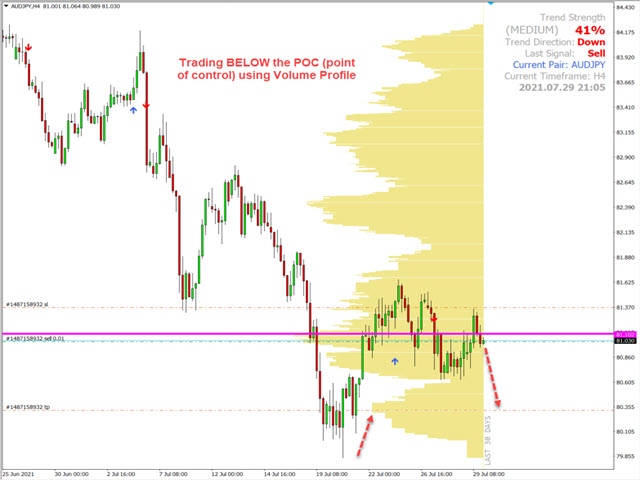
Volume Profile is a very useful trading tool many traders overlook - it allows you to spot the real price levels where important price action took place. It is similar to support and resistance levels but with a different logic. Volume profiling outlines the real levels of support and resistance where the institutional trading took place. No more guess work! You will know exactly when all the heavy trading took place with a lot of LOTS and volume. Volume profile’s POC (point of control) will show you exactly where that happened by drawing a line across your chart. POC is the highest volume node on the volume profile. The point of control is the longest volume bar on the volume profile and there are lots of volumes transacted there. Professional traders use POC as a strong support and resistance or an important retest point.
Volume Profile (also called Market Profile in some cases) is a handy tool for checking price action on a chart. One of the first thing that traders mark up when analyzing a chart is support and resistance. Volume Profile can be used for doing that too. Not only Volume Profile allows you to spot meaningful support and resistance levels, but it also highlights prices where there was heavy price action in the past (mostly by the institutional traders).
Knowing that some prices had important activity in the past can significantly help setting up trades, stop-losses, and take-profits for your future trades. The indicator scans the defined number of previous bars and calculates the volume of activity at each price level.
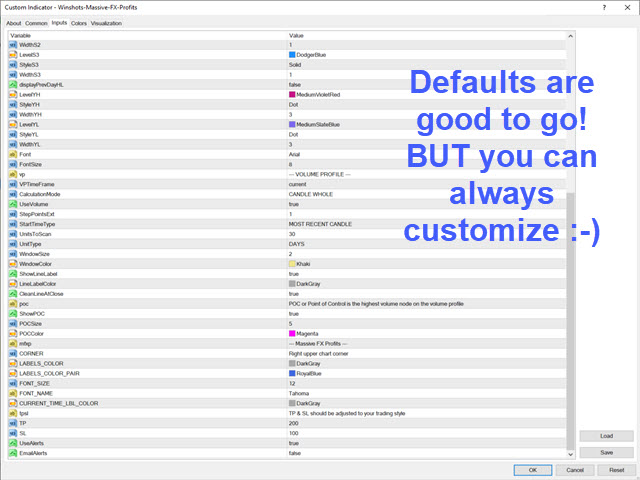
The result is presented through a vertical histogram chart — the longer the histogram is, the more activity at that price level was. You can set the indicator to display the volume profile up either to the current, most recent candle, or to some previous date.
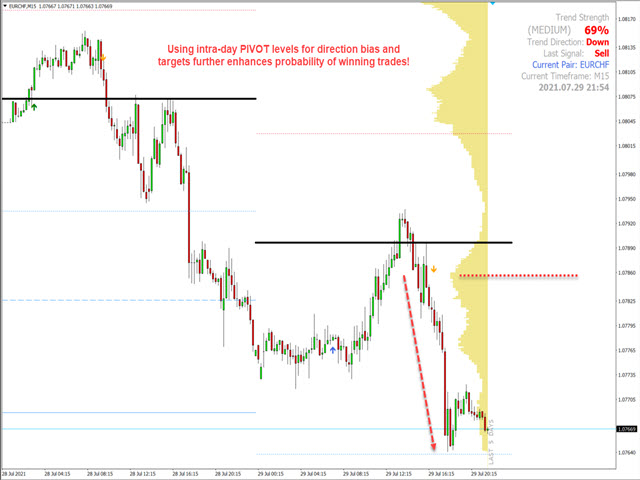
What are Daily Pivot Levels?
A pivot is a significant price level known in advance (based on a previous day’s trading activity) which traders view as important and may make trading decisions around that level. As a technical indicator, a pivot price is also similar to a resistance or support level. If the pivot level is exceeded, the price is expected to continue in that direction, or the price could reverse at or near that level.
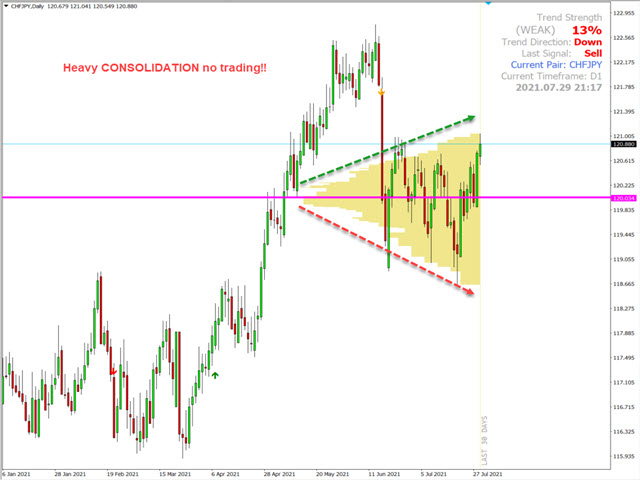
What are Price Cycles?
Most successful Forex traders believe that the markets have a cycle. This cycle is the result of human behavior in the markets. As a result of this innate human behavior, trends seem to repeat in the market. If a trader can chart these trends and predict future movements, a fortune can be made! The critical part here is recognizing the different stages in the market and which stage you currently lie in.
Winshots Massive FX Profits indicator utilizes multiple techniques to analyze the price movement and to determine its price cycles. This analysis is done separately on your chart whenever you switch to a new time frame. This makes Winshots Massive FX Profits ideal for intraday scalping as well as for swing trading.
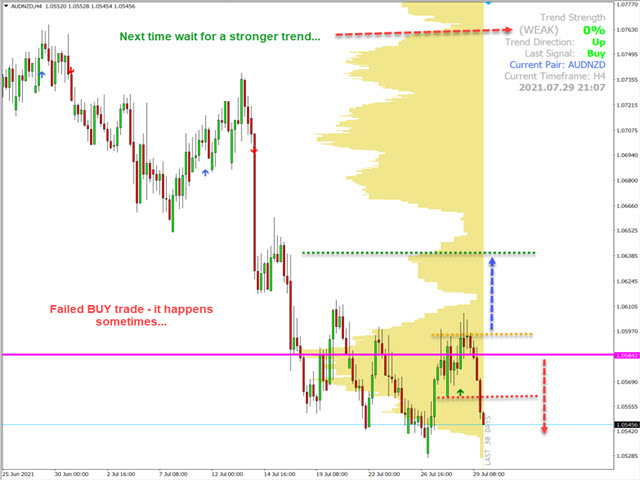
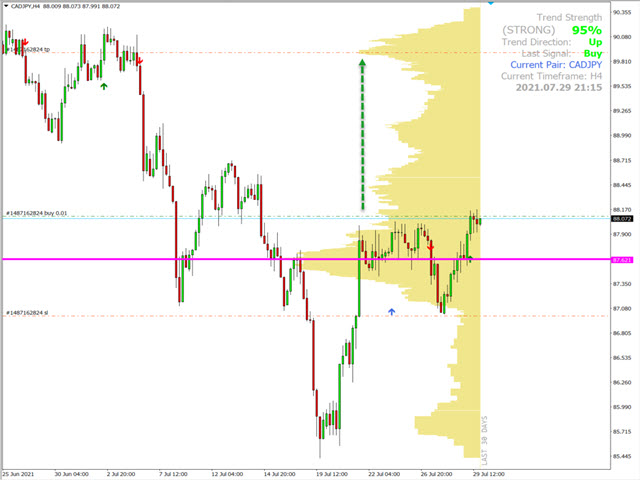
With the help of Winshots Massive FX Profits indicator you will be able to actually SEE with a high degree of probability what the next institutional move might be!