Symmetrical Triangle Patterns MT5
- Göstergeler
- LEE SAMSON
- Sürüm: 2.1
- Güncellendi: 6 Mayıs 2022
- Etkinleştirmeler: 10
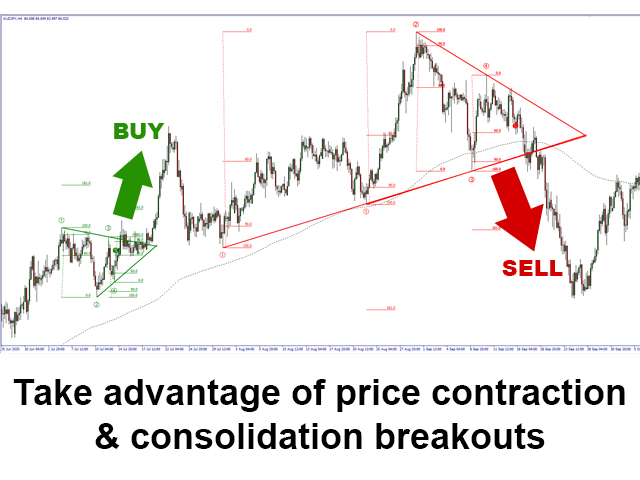
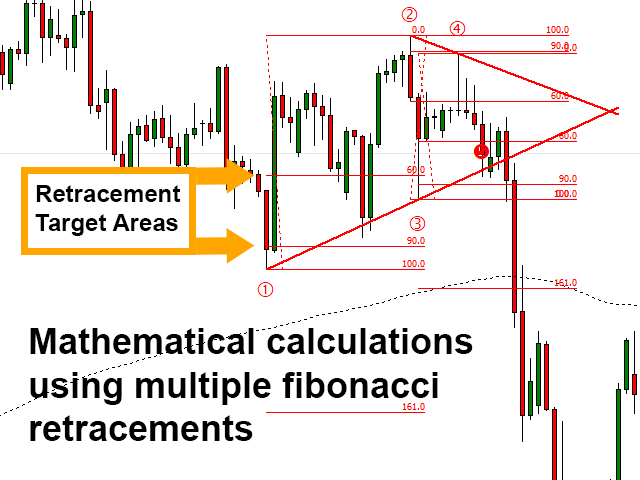
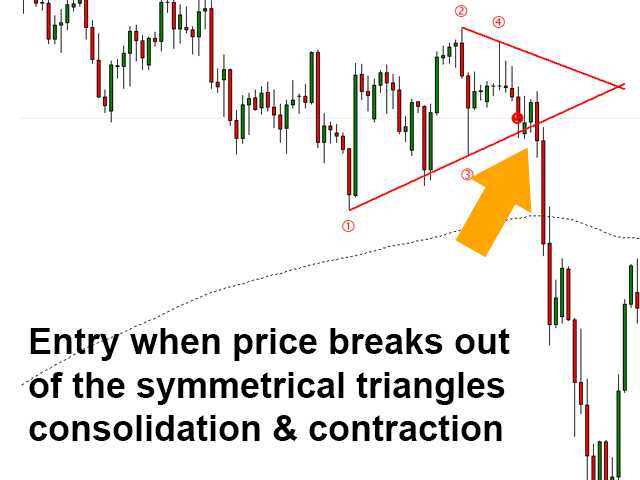
Simetrik bir üçgen grafik paterni, fiyat yükselmeye veya kırılmaya zorlanmadan önceki bir daralma ve konsolidasyon dönemini temsil eder. Alt trend çizgisinden bir kırılma, yeni bir düşüş eğiliminin başlangıcını işaret ederken, üst trend çizgisinden bir kırılma, yeni bir yükseliş trendinin başlangıcını gösterir.
MT4 Sürümü Burada Bulunmaktadır: https://www.mql5.com/en/market/product/68709/
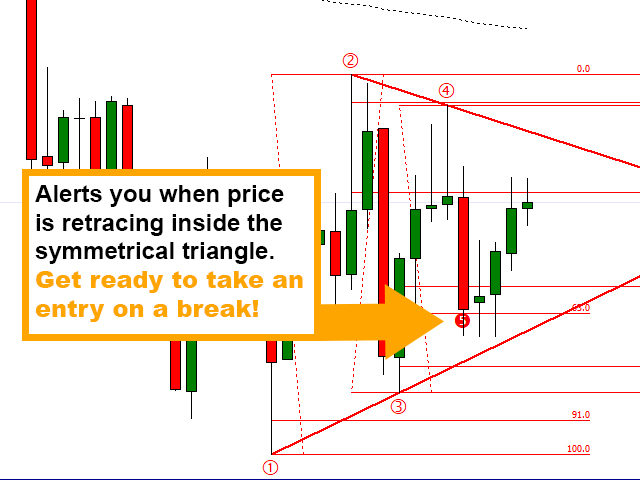
Bu gösterge, bu kalıpları tanımlar ve 4 kilit nokta oluştuğunda ve fiyat tekrar üçgene geri döndüğünde sizi uyarır, böylece olası bir kırılmaya hazır olabilirsiniz. Simetrik üçgenler her zaman mükemmel simetrik değildir ve fiyat kırılabilir veya düşebilir, ancak tipik olarak en başarılı kırılmalar üçgenin ilk noktasını oluşturan yüksek veya düşük yönündedir. Bu nedenle gösterge, bize kırılma için bir yükseliş veya düşüş eğilimi verir ve renk kodludur ve bu belirli yön için uyarı verir. Ticareti sadece bir yönde yapmak gerekli değildir, ancak her iki yönde de bir kırılma mümkündür, ancak kırılma ilk puan eğilimine uygun olarak gerçekleştiğinde, daha büyük ve daha hızlı bir fiyat hareketi ve daha iyi risk ödülü alma eğilimindesiniz.
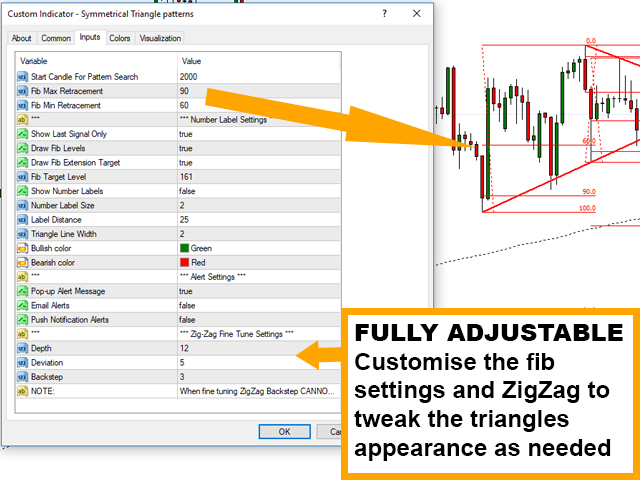
GİRİŞLER VE YAPILANDIRMA SEÇENEKLERİ:
Arama için Mum Başlat - Göstergenin kaç mum gerisinde tamamlanmış kalıpları aramaya başlayacağı
Fib Max Retracement - 3,4 ve 5 noktalarını oluşturmak için yapılabilecek maksimum geri çekilme fiyatı
Fib Min Retracement - 3,4 ve 5 noktalarını oluşturmak için yapılabilecek minimum düzeltme fiyatı
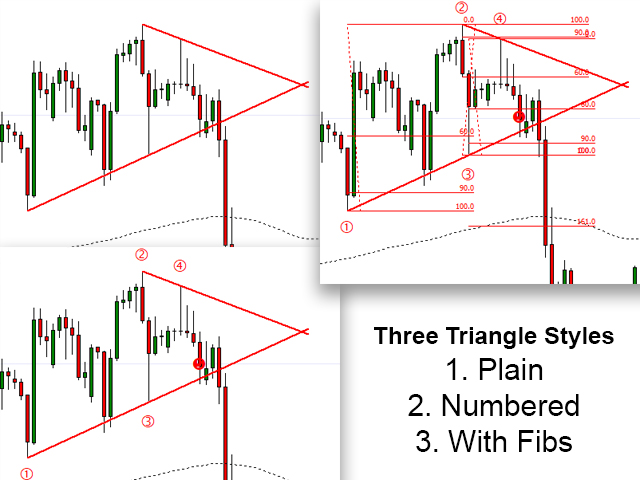
Yalnızca Son Sinyali Göster - Yalnızca son/geçerli modeli görüntüler
Draw Fib Levels - Üçgeni hesaplamak için kullanılan fib düzeltme düzeylerini çizer veya gizler
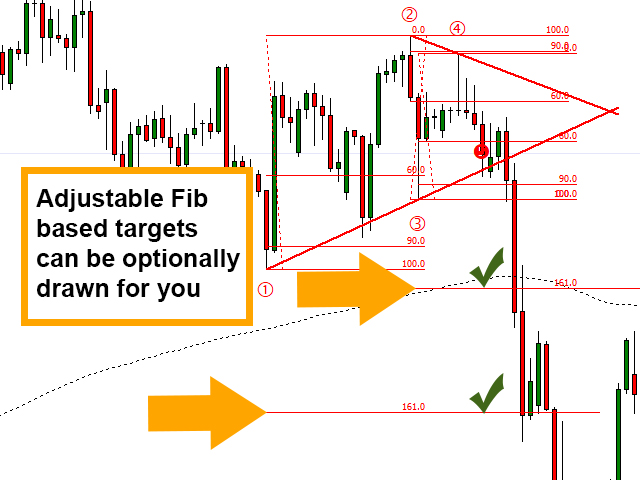
Fib Uzantısı Hedefi Çiz - Genellikle fiyatın ulaşacağı 2 ve 4 numaralı noktalar için bir hedef fic uzantısı düzeyi girmenizi sağlar.
Numara Etiketlerini Göster - Üçgenin noktaları için sayı etiketlerini görüntüleyin veya gizleyin
Etiket Mesafesi - Sayı etiketlerinin mum iniş ve çıkışlarından uzaklığını ayarlar
Üçgen Çizgi Genişliği - Çizilen üçgenlerin çizgi genişliği
Boğa ve Ayı Rengi - Her üçgen türü için renkleri seçin
Uyarılar - Açılır pencere, e-posta veya anlık uyarılar arasından seçim yapın
Zig-Zag Ayarları - Zevkinize göre ince ayar yapmak için Zig-Zag gösterge ayarlarını yapın. 1 ve 2 numaralı noktalar, modelin başlangıcını oluşturan standart Zig-Zag'a göre oluşturulur.
STRATEJİ VE SİMETRİK ÜÇGENLER NASIL TİCARET YAPILIR:
Simetrik üçgen desenlerini kullanmanın birçok yolu vardır, ancak en yaygın stratejiler aşağıda belirtilmiştir.
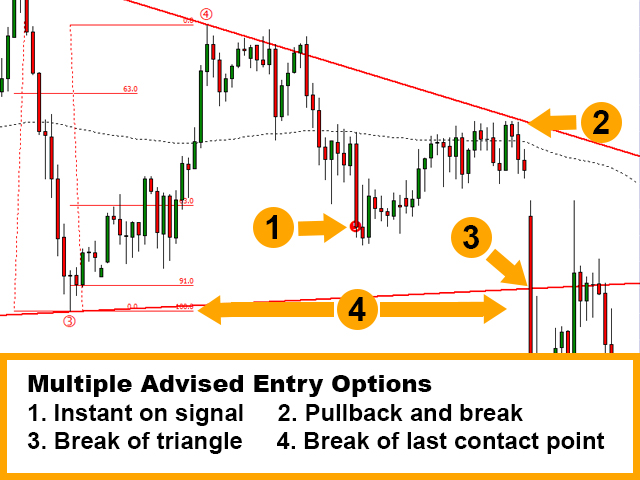
1. Hareketli bir ortalama (genellikle 200EMA) kullanın ve yalnızca zaman çerçeveleri trend yönüne göre üçgenlerde ara verin. Yalnızca doğru renkteki üçgenleri (yükseliş veya düşüş) almayı veya trend yönünde kırılan her şeyi takas etmeyi seçin.
2. Daha yüksek zaman çerçevesi trend yönünü kullanın ve yalnızca bu yönde girin. Simetrik üçgenler genellikle fiyat bir yönde güçlü bir şekilde itildikten sonra oluşacaktır. İlk hareketten sonra fiyat "duraklamaları" olarak oluşurlar ve genellikle başlangıç hareketiyle aynı yönde kırılırlar. Bu nedenle, grafikte çizilen üçgenlerde yükseliş veya düşüş eğilimi var. Risk:Ödül ve orijinal eğilime uygun molaların gücü genellikle çok daha iyidir.
3. 3. ve 4. noktalarda bekleyen emirlerle her üçgeni her iki yönde de ticaret yapın. Kuvvet. Üçgenin 3. ve 4. noktalarında bekleyen emirlerle bu avantajdan yararlanabilirsiniz, yani hareketi her iki yönde ilerlerken yakalarsınız.


Hi Master Lee Samson, your indicator is super, if you add Ascending and Descending patterns. It will be a super star. 10/10