Calc Trend Ex
- Uzman Danışmanlar
- Tatiana Savkevych
- Sürüm: 1.0
- Etkinleştirmeler: 5
Calc Trend Ex is a forex trending bot based on the Calc Trend indicator.
A bot created on the basis of this Calc Trend indicator and working on the principle - if there is an indicator signal, then the bot has closed an opposite deal and opened a new deal in the specified direction, it can be downloaded and used for work. The bot is as simple as possible! The bot fully reflects the work of the indicator. Moreover, the bot can be optimized (by optimizing the parameters of the indicator itself) and thus automatically obtain the most optimal indicator indicators for the required period of history.
You can buy an indicator and create a bot based on it without buying this development. The principle of operation is fully described in this description, it is obscenely simple. In fact, the whole principle is described in the previous paragraph, just modify money management to it as desired, error control and correct signal processing.
How to work.
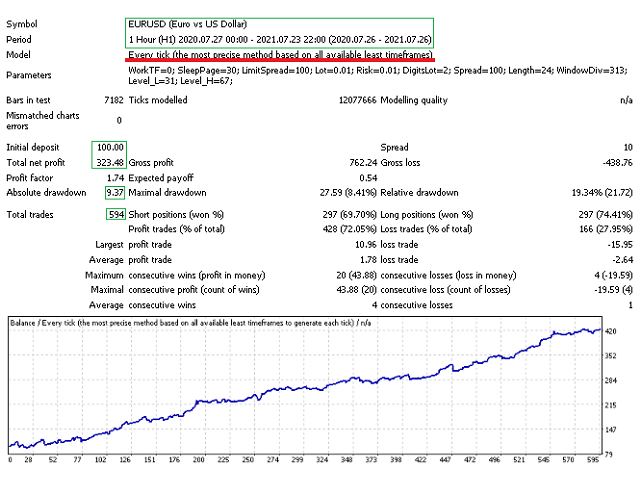
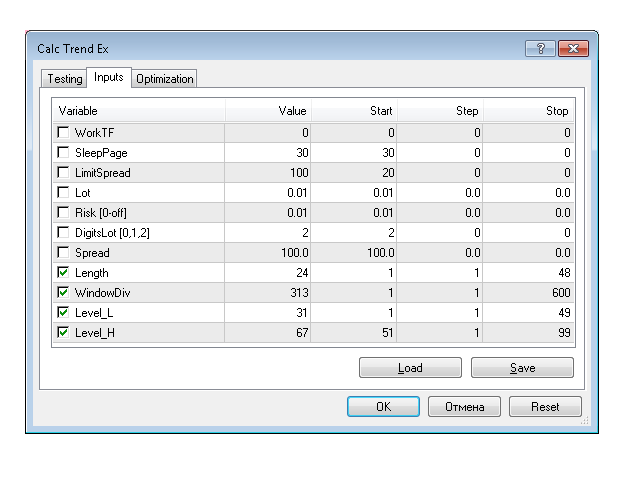
We optimize the year, we work for the month, provided that the timeframe is hourly. When filtering the results (optimization by balance), you need to look at the number of orders, the more the more reliable. Also pay attention to the minimum spread. Optimize for opening prices. Everything works on all ticks, and there is no problem since the principle of operation is simple.
I will repeat how exactly the entry signal is formed. For those who are in the tank and do not want to follow the link and read the same information in the description of the indicator.
The principle of operation of the signal indicator.
We display RSI indicator signals on a price function chart using a mathematical approach. As you know, the overbought and oversold zones that the standard RSI fixes are often broken by the price and the price goes the other way. This makes the standard indicator inapplicable for real work in its pure form. Also, for sure, each user has noticed that at any part of the history, it is possible to change the RSI settings in this way that for a certain period of history all entries will be as accurate as possible. This is where there is work to be done.
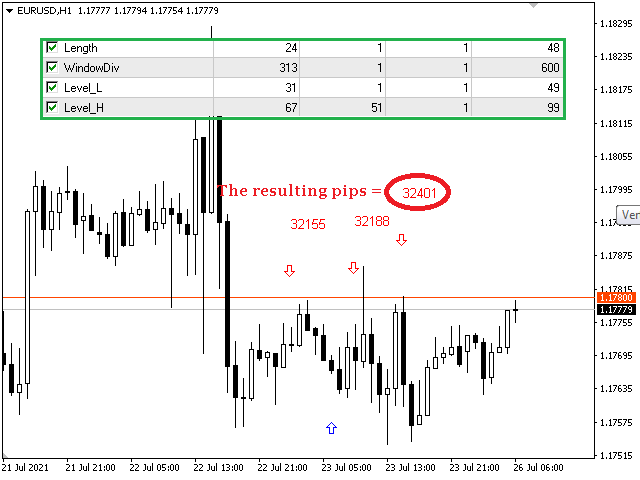
The principle of operation is basic. When the price returns from the overbought / oversold zone and breaks through the level specified in the settings (Level_L, Level_H), a buy or sell signal is generated. Everything is at the open prices, so there is no redrawing, and the signal is generated at the open price of the current candle. Also, the algorithm is created in such a way that signals for buy and sell must alternate, thus skipping unnecessary signals.
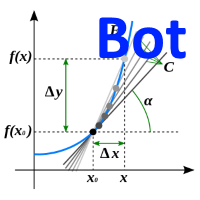
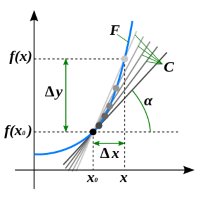
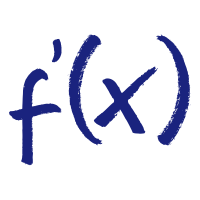
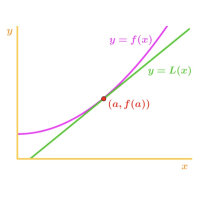
The principle of operation is managerial. Let's imagine that the period of the RSI indicator is controlled by a "magic" function that changes its period so that on a sufficiently long history interval (for example, a year) the indicator displays acceptable entry points. How is this approach implemented ?! To control the period of the RSI indicator, we will use the derivative of the price function at a certain time interval (Length). Derivative of a function is a concept of differential calculus that characterizes the rate of change of a function at a given point. It is defined as the limit of the ratio of the increment of a function to the increment of its argument when the increment of the argument tends to zero, if such a limit exists. The price function has a finite derivative (at the point under study), which means it is differentiable at this point. And we can work with her. After the mathematical transformation is made, we transform the result using the coefficient (WindowDiv) to a value acceptable for the RSI indicator, and that's it! It remains only to configure the resulting Calc Trend indicator.
The file for optimization is listed in the discussion. The main thing to understand is that the indicator parameters must be optimized for each instrument and each timeframe.
