Doubly Correct Range
- Göstergeler
- Igor Gerasimov
- Sürüm: 1.0
- Etkinleştirmeler: 5
//////////////////////////////////////////////// //////////////////////////////////
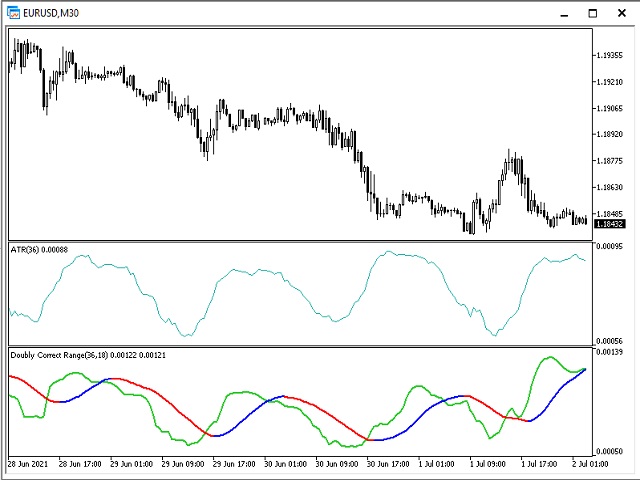
An improved version of the standard Average True Range indicator.
This is now double the precision and a colored averaging line.
The setup is quite simple - you need to specify the main period and the averaging period.
It is very easy to understand the readings of this indicator, the meaning is the same as that of the standard Average True Range.
//////////////////////////////////////////////// ///////////////////////////////////
I hope this indicator will be very useful to you in successful trading.
Good luck.