• Genel bakış
  • İncelemeler (7)
  • Yorumlar (10)
  • Yenilikler

Multi Chart Crosshairs MT5

5

Bu gösterge, farklı zaman ölçeklerinde birçok grafiğin gözden geçirilmesini daha hızlı ve daha kolay hale getirmek için tasarlanmıştır.

  • Birden fazla grafikte Zaman ve Fiyatı İzleyin
  • Bir grafikteki Sembolü Değiştirin ve aynı sembolün diğer tüm çizelgeleri de değişecektir.
  • Kullanımı kolay, ustalaşması hızlı

Gösterge, aynı Sembolde açık olan diğer tüm grafiklerde fare işaretçisinin geçerli grafikte bulunduğu fiyatı ve zamanı belirlemenize olanak tanır. Bu, birden fazla grafikteki bilgileri hızlı bir şekilde görmenizi sağlar, oysa normalde aynı konumu belirlemek için biraz zaman harcamanız gerekir.

Tüm açık grafiklerde sadece Zamanı izlemeyi de seçebilirsiniz. Bu, sapma avı yaparken kolayca gezinmenizi sağlar.

Bir çizelgede Sembolü değiştirirseniz, aynı sembolün diğer tüm çizelgeleri zaman çerçevesi ayarlarını koruyarak yeni Sembole geçer.

Nasıl kullanılır

Bir grafiği incelerken, trendleri ve işlem seviyelerini belirlemek için birkaç zaman dilimine bakmayı severim. Bu aracı, buna yardımcı olması ve ayrıca uzun bir süre boyunca birkaç tabloya baktığım görsel geri test için oluşturdum.

Araç, ekrana fare işaretçisini izleyen bir artı işareti ekler. CTRL veya SHIFT tuşu aşağıdayken etkinleştirilir, bu nedenle her zaman orada olmaz, ancak istediğiniz zaman olur.

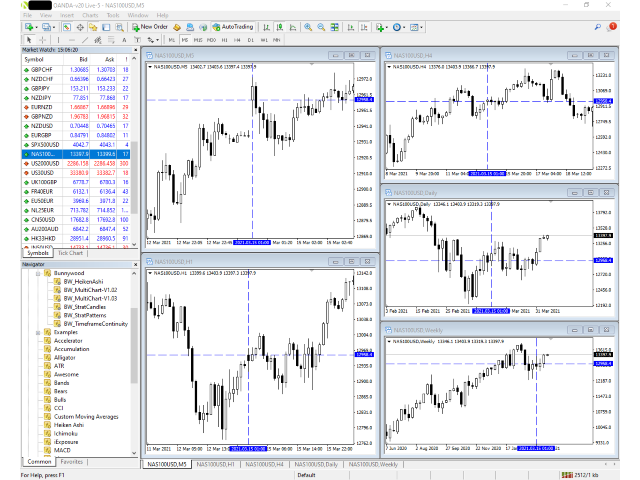
Etkinleştirildikten sonra, izlemek istediğiniz herhangi bir tablonun üzerine gelin ve aynı Sembole sahip diğer herhangi bir tablonun üzerine gelin, artı işareti o grafikte de aynı zaman ve fiyatı gösterecektir. Diğer pencerelerdeki çizelgeler, zaman/fiyat kombinasyonu ekranın merkezinde olacak şekilde ekranı otomatik olarak kaydıracaktır.

ESC tuşuna basana kadar görünür durumda kalan artı işaretlerini etkilemeden grafiğe çizim öğeleri ekleyebilirsiniz. ESC tuşuna bir kez basıldığında, siz tekrar ihtiyacınız olana kadar artı işaretlerinin tekrar gizlenmesine neden olur.

Gösteri

Lütfen kullanımdaki göstergeyi gösteren videoyu inceleyin.


Umarım benim kadar faydalı bulursunuz.

İlginiz için teşekkürler!


İncelemeler 7
mm0079
137
mm0079 2024.01.15 18:46 
 

Works as promised. I only could not change the colour input for crosshair (on mac) but thats all.

Forexezek
48
Forexezek 2023.11.14 10:51 
 

Hello! I bought the indicator. Very good! However, when I'm not using it, it would be nice if MT5's built-in crosshairs would work again to press the middle mouse button. It's deleting this feature for some reason. Could you modify it like this? Please

Sorry, but I didn't see that you already corrected it and wrote an answer. Thank you very much!

Could there possibly be a setting to set the crosshairs in the background/foreground? 100% perfect indicator after the repair! You are a perfect seller!

Igazi
151
Igazi 2023.05.26 19:05 
 

WOW! What an amazing indicator! Worth the purchase!

Önerilen ürünler
This indicator has been developed to identify and display these trends quickly and easily, allowing you to see instantly, those currency pairs which are trending, and those which are not – and in all timeframes, with just one click. The 28 currency pairs are displayed as a fan as they sweep from strong to weak and back again, and this is why we call it the ‘currency array’. All 28 pairs are arrayed before you, giving an instant visual description of those pairs that are trending strongly, those
PipFinite Trend PRO MT5
Karlo Wilson Vendiola
4.87 (665)
Breakthrough Solution For Trend Trading And Filtering With All Important Features Built Inside One Tool! Trend PRO's smart algorithm detects the trend, filters out market noise and gives entry signals with exit levels. The new features with enhanced rules for statistical calculation improved the overall performance of this indicator. Important Information Revealed Maximize the potential of Trend Pro, please visit www.mql5.com/en/blogs/post/713938 The Powerful Expert Advisor Version Automa
Your Trend Friend
Luigi Nunes Labigalini
5 (1)
The trend is your friend! Look at the color of the indicator and trade on that direction. It does not  repaint. After each candle is closed, that's the color of the trend. You can focus on shorter faster trends or major trends, just test what's most suitable for the symbol and timeframe you trade. Simply change the "Length" parameter and the indicator will automatically adapt. You can also change the color, thickness and style of the lines. Download and give it a try! There are big movements
Gösterge, tarihsel olanlarla karşılaştırılabilecek güncel teklifler oluşturur ve bu temelde bir fiyat hareketi tahmini yapar. Gösterge, istenen tarihe hızlı navigasyon için bir metin alanına sahiptir. Seçenekler: Sembol - göstergenin göstereceği sembolün seçimi; SymbolPeriod - göstergenin veri alacağı dönemin seçimi; GöstergeRenk - gösterge rengi; Ters - doğru tırnakları tersine çevirir, yanlış - orijinal görünüm; Sonraki, tarihi girebileceğiniz ve 'enter' tuşuna basa
Bu indikatör, her sipariş için önceden belirlediğiniz TP ve SL Değerlerini (o para biriminde) grafiklerde (işlem/sipariş satırına kapalı) gösterecek ve her sipariş için kar ve zararınızı tahmin etmenize çok yardımcı olacaktır. Ayrıca size PIP değerlerini de gösterir. gösterilen format "Kâr veya Zararımızın Döviz Değerleri / PIP değerlerimiz" şeklindedir. TP Değeri Yeşil Renkte ve SL Değeri Kırmızı Renkte gösterilecektir. Herhangi bir sorunuz veya daha fazla bilgi için lütfen fxlife.asia@hotma
Owl Smart Levels MT5
Sergey Ermolov
4.31 (39)
MT4 versiyonu  |  FAQ Owl Smart Levels Indicator , Bill Williams'ın gelişmiş fraktalları , piyasanın doğru dalga yapısını oluşturan Valable ZigZag ve kesin giriş seviyelerini gösteren Fibonacci seviyeleri gibi popüler piyasa analiz araçlarını içeren tek gösterge içinde eksiksiz bir ticaret sistemidir. pazara ve kar elde edilecek yerlere. Stratejinin ayrıntılı açıklaması Gösterge ile çalışma talimatı Baykuş Yardımcısı ticaretinde Danışman Yardımcısı Kullanıcıların özel sohbeti -> Satın aldıktan
Stokastik Osilatörün çoklu para birimi ve çoklu zaman çerçevesi modifikasyonu. Parametrelerde istediğiniz para birimini ve zaman dilimlerini belirtebilirsiniz. Panel, Sinyal ve Ana (stokastik geçiş) çizgilerinin mevcut değerlerini ve kesişimlerini görüntüler. Ayrıca gösterge aşırı alım ve aşırı satım seviyelerini geçerken bildirim gönderebilir. Noktalı bir hücreye tıkladığınızda bu sembol ve nokta açılacaktır. Bu MTF Tarayıcıdır. Para Birimi Gücü Ölçer'e benzer şekilde, Kontrol Paneli belirli b
Noize Absorption Index - is the manual trading system that measures the difference of pressure between bears forces and bulls forces. Green line - is a noize free index that showing curent situation. Zero value of index shows totally choppy/flat market.Values above zero level shows how powerfull bullish wave is and values below zero measures bearish forces.Up arrow appears on bearish market when it's ready to reverse, dn arrow appears on weak bullish market, as a result of reverse expectation.
Trading Utility for Forex Currency Pairs Only not for Gold  Functions Auto Lot Calculation based on Risk Auto stoploss  Auto TakeProfit Breakeven Auto Close Half % Close in percentage with respect to the PIPs Pending Orders BuyLimit Sell Limit with distances BuyStop Sell Stop    with distances Trading Informations Risk in percentage For Multiple trades Combine Takeprofit and Combine Stoplosses
Deriv Boom sell
Yaovi Inoussa Atchou
Our BOOM SELL ALERT indicator is specifically engineered to   take candles on BOOM 1000 , BOOM 500 is tool is optimized for M1 (1-minute) timeframe, ensuring you receive timely and actionable insights.   The indicator is a combination of   many indicators. -        AO Oscillator -        Stochastic   HOW TO USE THIS INDICATOR To use well this indicator , it   need to use SCHAFF TREND RSX ( 5 MIN OR M5) IF SCHAFF trend RSX is GREEN and you have a signal then SELL when you have ENTRY and out with
Trend Yakalayıcı: Alarm İndikatörü ile Trend Yakalayıcı Stratejisi, piyasa trendlerini ve potansiyel giriş ve çıkış noktalarını belirlemede yardımcı olan çok yönlü bir teknik analiz aracıdır. Piyasa koşullarına uyum sağlayarak trend yönünün net görsel temsili için dinamik bir Trend Yakalayıcı Stratejisi sunar. Tüccarlar tercihlerine ve risk toleranslarına göre parametreleri özelleştirebilirler. Gösterge, trendleri tanımlamaya yardımcı olur, potansiyel ters dönüşleri sinyaller, trailing stop m
FREE
HMA Trend Professional MT5
Pavel Zamoshnikov
4.5 (6)
Improved version of the free HMA Trend indicator (for MetaTrader 4) with statistical analysis. HMA Trend is a trend indicator based on the Hull Moving Average (HMA) with two periods. HMA with a slow period identifies the trend, while HMA with a fast period determines the short-term movements and signals in the trend direction. The main differences from the free version: Ability to predict the probability of a trend reversal using analysis of history data. Plotting statistical charts for analyz
The Riko Trend indicator is a revolutionary trend trading and filtering solution with all the important features of a trend tool built into one tool! The Riko Trend indicator is good for any trader, suitable for any trader for both forex and binary options. You don’t need to configure anything, everything is perfected by time and experience, it works great during a flat and in a trend. The Riko Trend indicator is a technical analysis tool for financial markets that reflects the current price
Fibonacci and RSI Demo version MQL5
Carlos Daniel Vazquez Rosas
4 (1)
Fibonacci and RSI. Demo versión only works with GBPUSD. For full version, please, visit visit https://www.mql5.com/en/market/product/52101 The indicator is a combination of the Fibonacci and RSI indicators. Every time the price touches one of the fibonacci levels and the rsi condition is met, an audible alert and a text alert are generated. Parameters number_of_candles : It is the number of candles that will be calculated. If you put 100, the indicator will give you the maximum and min
FREE
Premium seviye, %80'den fazla doğru tahmin doğruluğuna sahip benzersiz bir göstergedir! Bu gösterge en iyi Ticaret Uzmanları tarafından iki aydan uzun süredir test edilmiştir! Yazarın göstergesini başka hiçbir yerde bulamazsınız! Ekran görüntülerinden bu aracın doğruluğunu kendiniz görebilirsiniz! 1, sona erme süresi 1 mum olan ikili opsiyon ticareti için harikadır. 2 tüm döviz çiftleri, hisse senetleri, emtialar, kripto para birimleri üzerinde çalışır Talimatlar: Kırmızı ok görün
A powerful oscillator that provide Buy and Sell signals by calculating the investor liquidity. The more liquidity the more buy possibilities. The less liquidity the more sell possibilities. Please download the demo and run a backtest! HOW IT WORKS: The oscillator will put buy and sell arrow on the chart in runtime only . Top value is 95 to 100 -> Investors are ready to buy and you should follow. Bottom value is 5 to 0 -> Investors are ready to sell and you should follow. Alert + sound will app
Be notified of every color change of Heiken Ashi (HA) candles. The indicator will trigger past and new signals every time that HA candles change their colors. ( Note : this tool is based on the code of Heiken Ashi indicator developed by MetaQuotes Software Corp.) Features The signals are triggered at closing of last bar/opening of a new bar; Any kind of alerts can be enabled: Dialog Box, Email message, SMS notifications for smartphones and tablets, and Sound alerts; By default, up arrows are p
Description ABC Trend Detector Pro  is an indicator that identifies impulses and trends in the market and displays their presence on the price chart. Found patterns are drawn as colored connecting lines between their highs and lows. Above / below each extreme, the value of the range (the number of pips) of the trend is displayed. Recommendations You can use this indicator to determine the trend and, accordingly, to determine the direction of opening a position or closing an opposite posit
Volality Index Scalper
Lesedi Oliver Seilane
5 (1)
Volality Index scalper indicator  Meant for Volality pairs such as Volality 10, 25, 50, 75 and 100 The indicator works on all timeframes from the 1 minute to the monthly timeframe the indicator is non repaint the indicator has 3 entry settings 1 color change on zero cross 2 color change on slope change 3 color change on signal line cross Orange line is your sell signal Blue line is your buy signal.
Was: $249  Now: $99   Market Profile defines a number of day types that can help the trader to determine market behaviour. A key feature is the Value Area, representing the range of price action where 70% of trading took place. Understanding the Value Area can give traders valuable insight into market direction and establish the higher odds trade. It is an excellent addition to any system you may be using. Inspired by Jim Dalton’s book “Mind Over Markets”, this indicator is designed to suit the
PZ Trend Trading MT5
PZ TRADING SLU
3.67 (3)
Trend Trading is an indicator designed to profit as much as possible from trends taking place in the market, by timing pullbacks and breakouts. It finds trading opportunities by analyzing what the price is doing during established trends. [ Installation Guide | Update Guide | Troubleshooting | FAQ | All Products ] Trade financial markets with confidence and efficiency Profit from established trends without getting whipsawed Recognize profitable pullbacks, breakouts and early reversals The ind
Robust median Renko style indicator for creating custom charts resembling Median Renko, Mean Renko, Turbo Renko and Better Renko candles as well as vanilla Renko with wicks plus Point-O charts. This all in one package provides all of the signals needed by day traders, scalpers, and even long-term traders. Main characteristics The indicator is an overlay on the main chart so it is possible to utilize one-click trading and order manipulation directly on the custom charts. Visual order placement
Point Black
Ignacio Agustin Mene Franco
Black Card Pack indicator 5/1 point black It has the strategy of professional bollingers where each arrow gives you a different entry signal. It is used to operate in m1 and in d1 It is used for scalping and intraday, modified for forex markets ! suitable for all pairs modified for synthetic index markets suitable for all pairs! Ideal for volatility and jumps!
Note : i only sell this EA on MQL5, any other sellers is fake. Orbit Rage Final, a cutting-edge trading strategy meticulously designed around the bull/bear candle approach and divergence analysis. This powerful tool is engineered to empower you to shape the life you desire. To embark on this transformative journey, simply download and seamlessly integrate it into your MetaTrader 4 platform by placing it in the experts advisors folder. Orbit Rage Final revolutionizes trading by offering a risk-f
Show Pips for MT5
Roman Podpora
4.63 (19)
This information indicator will be useful for those who always want to be aware of the current situation on the account. - More useful indicators The indicator displays data such as profit in points, percentage and currency, as well as the spread for the current pair and the time until the bar closes on the current timeframe. There are several options for placing the information line on the chart: - To the right of the price (runs behind the price); - As a comment (in the upper left corner
FREE
Öncelikle, bu Ticaret Aracının Non-Repainting, Non-Redrawing ve Non-Lagging Gösterge olduğunu vurgulamakta fayda var, bu da onu profesyonel ticaret için ideal hale getiriyor. Çevrimiçi kurs, kullanıcı kılavuzu ve demo. Akıllı Fiyat Hareketi Kavramları Göstergesi, hem yeni hem de deneyimli tüccarlar için çok güçlü bir araçtır. İleri ticaret fikirlerini, Inner Circle Trader Analizi ve Smart Money Concepts Ticaret Stratejileri gibi 20'den fazla kullanışlı göstergeyi bir araya getirerek bir aray
Nova Vision is a cutting-edge, innovative, next-generation bot designed for successful trading in the Forex and Cryptocurrency markets (for applicable brokers). This tool is highly efficient and has unique capabilities, making it an indispensable assistant for traders. Nova Vision offers feature-rich capabilities and supports a wide range of currency pairs. It is specifically tailored to work in both the Forex and cryptocurrency markets, providing traders with flexibility and versatility in t
PipFinite Exit EDGE MT5
Karlo Wilson Vendiola
4.89 (36)
Did You Have A Profitable Trade But Suddenly Reversed? In a solid strategy, exiting a trade is equally important as entering. Exit EDGE helps maximize your current trade profit and avoid turning winning trades to losers. Never Miss An Exit Signal Again Monitor all pairs and timeframes in just 1 chart www.mql5.com/en/blogs/post/726558 How To Trade You can close your open trades as soon as you receive a signal Close your Buy orders if you receive an Exit Buy Signal. Close your Sell orde
Inguz
Maxim Kuznetsov
Ing (inguz,ingwar) - the 23rd rune of the elder Futhark ᛝ, Unicode+16DD. Add some runic magic to your trading strategies. The correct marking of the daily chart will indicate to you the successful moments for counter-trend trading. Simple to use, has high efficiency in volatile areas. Be careful in lateral movements. Signals ᛝ are generated when the main lines of construction intersect. Red arrow down - recommended sales Blue up arrow - recommended purchases rare purple arrows indicate
TPO Profile MT5
Kyra Nickaline Watson-gordon
Definition : TPO is a Time Price Opportunity. Instead of using bars or candles with an Open, High, Low, and Close price, each "bar" in a Market Profile is represented by horizontal bars against the price It is called Market Profile terminology. In other words time-price-opportunity (TPO) profiles are histograms of how much time was spent at each price within the span of the profile. By using a TPO chart, you are able to analyze the amount of trading activity, based on time, for each price leve
Bu ürünün alıcıları ayrıca şunları da satın alıyor
Atomic Analyst MT5
Issam Kassas
4.78 (18)
Öncelikle belirtmek gerekir ki bu Ticaret Göstergesi Yeniden Çizim Yapmaz, Gecikmez ve Gecikme Göstermez, bu da hem manuel hem de robot ticareti için ideal hale getirir. Kullanıcı kılavuzu: ayarlar, girişler ve strateji. Atom Analisti, Piyasada Daha İyi Bir Avantaj Bulmak İçin Fiyatın Gücünü ve Momentumunu Kullanan PA Fiyat Hareketi Göstergesidir. Gürültüleri ve Yanlış Sinyalleri Kaldırmaya ve Ticaret Potansiyelini Artırmaya Yardımcı Olan Gelişmiş Filtrelerle Donatılmıştır. Birden fazla katmanl
Öncelikle, bu Ticaret Sistemi'nin Non-Repainting, Non-Redrawing ve Non-Lagging Göstergesi olduğunu vurgulamak önemlidir, bu da hem manuel hem de robot ticareti için ideal hale getirir. Online kurs, kılavuz ve ön ayarları indir. "Smart Trend Trading System MT5", yeni ve deneyimli tüccarlar için özelleştirilmiş kapsamlı bir ticaret çözümüdür. 10'dan fazla premium göstergeyi birleştiriyor ve 7'den fazla sağlam ticaret stratejisi sunuyor, bu da çeşitli piyasa koşulları için esnek bir seçim yapar. Tr
Gold Stuff mt5
Vasiliy Strukov
4.9 (181)
Gold Stuff mt5, özellikle altın için tasarlanmış bir trend göstergesidir ve herhangi bir finansal enstrümanda da kullanılabilir. Gösterge yeniden çizilmez ve gecikmez. Önerilen zaman dilimi H1. Ayarları ve kişisel bir bonusu almak için satın alma işleminden hemen sonra benimle iletişime geçin!  Güçlü Destek ve Trend Tarayıcı göstergemizin ücretsiz bir kopyasını pm'den alabilirsiniz. Ben!   AYARLAR Ok Çiz - açık kapalı. grafik üzerinde oklar çizmek. Uyarılar - sesli uyarılar kapalı. E-post
Quantum Trend Sniper
Bogdan Ion Puscasu
4.92 (48)
Tanıtım       Kuantum Trend Keskin Nişancı Göstergesi   , trend tersine dönmeleri belirleme ve ticaret yapma şeklinizi değiştiren çığır açan MQL5 Göstergesi! 13 yılı aşkın ticaret tecrübesine sahip deneyimli tüccarlardan oluşan bir ekip tarafından geliştirilmiştir.       Kuantum Trend Keskin Nişancı Göstergesi       trend dönüşlerini son derece yüksek doğrulukla belirlemenin yenilikçi yolu ile ticaret yolculuğunuzu yeni zirvelere taşımak için tasarlanmıştır. ***Kuantum Trend Keskin Nişancı Gö
TPSproTREND PrO MT5
Roman Podpora
4.88 (8)
TPSpro TRENDPRO  - is a trend indicator that automatically analyzes the market and provides information about the trend and each of its changes, as well as giving signals for entering trades without redrawing! The indicator uses each candle, analyzing them separately. referring to different impulses - up or down impulse. Exact entry points into transactions for currencies, crypto, metals, stocks, indices!  -  Version MT4               DETAILED DESCRIPTION               R ecommended to use with
Top indicator for MT5   providing accurate signals to enter a trade without repainting! It can be applied to any financial assets:   forex, cryptocurrencies, metals, stocks, indices .  Watch  the video  (6:22) with an example of processing only one signal that paid off the indicator! MT4 version is here It will provide pretty accurate trading signals and tell you when it's best to open a trade and close it. Most traders improve their trading results during the first trading week with the help of
FX Power MT5 NG
Daniel Stein
5 (6)
Sabah Brifingimiz burada mql5 ve on Telegram! FX Power MT5 NG , uzun zamandır çok popüler olan döviz gücü ölçerimiz FX Power'ın yeni neslidir. Peki bu yeni nesil güç ölçer ne sunuyor? Orijinal FX Power hakkında sevdiğiniz her şey PLUS GOLD/XAU güç analizi Daha da hassas hesaplama sonuçları Ayrı ayrı yapılandırılabilir analiz dönemleri Daha da iyi performans için özelleştirilebilir hesaplama limiti Özel çokluDaha fazlasını görmek isteyenler için örnek ayarlar Her grafikte en sevdiğiniz renkler i
AT Forex Indicator MT5
Marzena Maria Szmit
5 (4)
The AT Forex Indicator MT5 is a sophisticated trading tool designed to provide traders with a comprehensive analysis of multiple currency pairs. This powerful indicator simplifies the complex nature of the forex market, making it accessible for both novice and experienced traders. AT Forex Indicator uses advanced algorithms to detect trends, patterns and is an essential tool for traders aiming to enhance their forex trading performance. With its robust features, ease of use, and reliable signal
FX Volume MT5
Daniel Stein
4.94 (17)
Sabah Brifingimiz aracılığıyla ayrıntılar ve ekran görüntüleri ile günlük piyasa güncellemenizi alın burada mql5 ve on Telegram ! FX Volume, bir brokerin bakış açısından piyasa duyarlılığı hakkında GERÇEK bir fikir veren İLK ve TEK hacim göstergesidir. COT raporlarından çok daha hızlı bir şekilde, brokerlar gibi kurumsal piyasa katılımcılarının Forex piyasasında nasıl konumlandıklarına dair harika bilgiler sağlar. Bu bilgileri doğrudan grafiğinizde görmek, ticaretiniz için gerçek oyun değiştir
Bu gösterge paneli, seçilen semboller için mevcut en son   harmonik kalıpları   gösterir, böylece zamandan tasarruf edersiniz ve daha verimli olursunuz /   MT4 sürümü . Ücretsiz Gösterge:   Basic Harmonic Pattern Gösterge sütunları Symbol :   seçilen semboller görünecektir Trend:   yükseliş veya düşüş Pattern :   desen türü (gartley, kelebek, yarasa, yengeç, köpekbalığı, cypher veya ABCD) Entry :   giriş fiyatı SL:   zararı durdur fiyatı TP1:   1. kar alma fiyatı TP2:   2. kar alma fiyatı
Reversal First Impulse levels (RFI)      INSTRUCTIONS        RUS       -       ENG              R ecommended to use with an indicator   -   TPSpro  TREND PRO -  Version MT4                 A key element in trading is zones or levels from which decisions to buy or sell a trading instrument are made. Despite attempts by major players to conceal their presence in the market, they inevitably leave traces. Our task was to learn how to identify these traces and interpret them correctly. Main functi
Trend Screener Pro MT5
STE S.S.COMPANY
4.88 (66)
Trend Göstergesi, Trend Alım Satım ve Filtreleme için Çığır Açan Benzersiz Çözüm, Tüm Önemli Trend Özellikleriyle Tek Bir Araç İçinde Yerleştirildi! Forex, emtialar, kripto para birimleri, endeksler ve hisse senetleri gibi tüm sembollerde/araçlarda kullanılabilen %100 yeniden boyamayan çoklu zaman çerçevesi ve Çoklu para birimi göstergesidir. Trend Screener, grafikte noktalarla ok trend sinyalleri sağlayan etkili bir trend trend göstergesidir. Trend analizörü göstergesinde bulunan özellikler: 1.
Tanıtım       Quantum Breakout PRO   , Breakout Bölgeleri ile ticaret yapma şeklinizi değiştiren çığır açan MQL5 Göstergesi! 13 yılı aşkın ticaret tecrübesine sahip deneyimli tüccarlardan oluşan bir ekip tarafından geliştirilmiştir.       Kuantum Breakout PRO       yenilikçi ve dinamik koparma bölgesi stratejisiyle ticaret yolculuğunuzu yeni zirvelere taşımak için tasarlanmıştır. Kuantum Breakout Göstergesi, size 5 kar hedefi bölgesi ile kırılma bölgelerinde sinyal okları ve kırılma kutusuna
IX Power MT5
Daniel Stein
4.2 (5)
IX Power   nihayet FX Power'ın rakipsiz hassasiyetini Forex dışı sembollere getiriyor. En sevdiğiniz endeksler, hisse senetleri, emtialar, ETF'ler ve hatta kripto para birimlerindeki kısa, orta ve uzun vadeli eğilimlerin yoğunluğunu doğru bir şekilde belirler. Terminalinizin sunduğu   her şeyi analiz   edebilirsiniz. Deneyin ve işlem yaparken   zamanlamanızın   nasıl   önemli ölçüde iyileştiğini   deneyimleyin. IX Power Temel Özellikler 100 hassas, yeniden boyanmayan hesaplama sonuçları -
Gösterge en uygun giriş ve çıkış noktalarını gösterir. Ayrıca, ticaretin daha iyi analiz edilmesi için tüm sinyaller hakkında istatistiksel veriler görüntüler. Bu göstergenin yardımıyla piyasayı daha iyi anlayabileceksiniz. Trendin gücü zayıflamaya başlar başlamaz (bu panelde gösterilecektir), trend çizgisi yatay konuma gelecektir - bu ticaretten çıkma sinyalidir. Ya da ortalama/medyan kâr seviyesine ulaşıldığında çıkabilirsiniz. Gösterge, 2010'dan beri edindiğim ticaret deneyimimin sonuc
PZ Day Trading MT5
PZ TRADING SLU
2.83 (6)
This indicator detects price reversals in a zig-zag fashion, using only price action analysis and a donchian channel. It has been specifically designed for short-term trading, without repainting or backpainting at all. It is a fantastic tool for shrewd traders aiming to increase the timing of their operations. [ Installation Guide | Update Guide | Troubleshooting | FAQ | All Products ] Amazingly easy to trade It provides value on every timeframe It displays suitable SL and TP levels It impl
Bu gösterge paneli, seçilen semboller için ticaret stratejinize bağlı olarak hem ölçeklendirme hem de uzun vadeli modda grafikteki   Arz ve Talep   bölgelerini keşfeder ve görüntüler. Ek olarak, gösterge tablosunun tarayıcı modu, istediğiniz tüm sembolleri bir bakışta kontrol etmenize ve uygun pozisyonları kaçırmamanıza yardımcı olur /   MT4 sürümü Ücretsiz gösterge:   Basic Supply Demand Özellikler Birden fazla döviz çiftinde   alım satım fırsatlarını görüntülemenize olanak tanıyarak,
ICT, SMC, SMART MONEY CONCEPTS, SMART MONEY, Smart Money Concept, Support and Resistance, Trend Analysis, Price Action, Market Structure, Order Blocks, BOS/CHoCH,   Breaker Blocks ,  Momentum Shift,   Supply&Demand Zone/Order Blocks , Strong Imbalance,   HH/LL/HL/LH,    Fair Value Gap, FVG,  Premium  &   Discount   Zones, Fibonacci Retracement, OTE, Buy Side Liquidity, Sell Side Liquidity, BSL/SSL Taken, Equal Highs & Lows, MTF Dashboard, Multiple Time Frame, BigBar, HTF OB, HTF Market Structure
Blahtech Supply Demand MT5
Blahtech Limited
4.54 (13)
Was: $299  Now: $99   Supply Demand uses previous price action to identify potential imbalances between buyers and sellers. The key is to identify the better odds zones, not just the untouched ones. Blahtech Supply Demand indicator delivers functionality previously unavailable on any trading platform. This 4-in-1 indicator not only highlights the higher probability zones using a multi-criteria strength engine, but also combines it with multi-timeframe trend analysis, previously confirmed swings
Matrix Arrow Indicator MT5
Juvenille Emperor Limited
5 (14)
Matrix Arrow Indicator MT5 ,   forex ,   emtialar ,   kripto   para birimleri ,   endeksler ,   hisse senetleri   gibi tüm sembollerde/araçlarda kullanılabilen   %100 yeniden boyamayan   çoklu zaman çerçevesi göstergesini izleyen benzersiz bir 10'u 1 arada trenddir.  Matrix Arrow Indicator MT5 , mevcut eğilimi erken aşamalarında belirleyecek ve aşağıdakiler gibi 10'a kadar standart göstergeden bilgi ve veri toplayacaktır: Ortalama Yönlü Hareket Endeksi (ADX) Emtia Kanal Endeksi (CCI) Klasik Hei
Fiyat tersine döndükçe ve geri çekildikçe piyasa yapısından elde edilen kâr değişir. Piyasa yapısını tersine çevirme uyarısı göstergesi, bir trendin veya fiyat hareketinin ne zaman tükenmeye yaklaştığını ve tersine dönmeye hazır olduğunu tanımlar. Genellikle bir geri dönüş veya büyük bir geri çekilme meydana gelmek üzereyken meydana gelen piyasa yapısındaki değişiklikler konusunda sizi uyarır. Gösterge, olası bir tükenme noktasının yakınında her yeni yüksek veya düşük oluştuğunda, başlangıçta
**   All Symbols   x   All Timeframes   scan just by pressing scanner button ** *** Contact me after the purchase to send you instructions and add you in "Trend Reversal group" for sharing or seeing experiences with other users. Introduction: Trendlines are the most famous technical analysis in trading . Trendlines continually form on the charts of markets across all the different timeframes providing huge opportunities for traders to jump in and profit on the action. In the other hand,  The tre
Auto Order Block with break of structure based on ICT and Smart Money Concepts (SMC) Futures Break of Structure ( BoS )             Order block ( OB )            Higher time frame Order block / Point of Interest ( POI )    shown on current chart           Fair value Gap ( FVG ) / Imbalance   -  MTF      ( Multi Time Frame )    HH/LL/HL/LH  -  MTF      ( Multi Time Frame )  Choch  MTF      ( Multi Time Frame )  Volume Imbalance     ,  MTF          vIMB Gap’s Power of 3 Equal High
Yeni Nesil Otomatik Arz ve Talep Bölgeleri. Her Grafikte Çalışan Yeni ve Yenilikçi Algoritma. Tüm Bölgeler Piyasanın Fiyat Hareketine Göre Dinamik Olarak Oluşturulmaktadır. İKİ TÜR UYARI --> 1) FİYAT BİR BÖLGEYE ÇIKTIĞINDA 2) YENİ BİR BÖLGE OLUŞTURDUĞUNDA Bir tane daha işe yaramaz gösterge almazsın. Kanıtlanmış Sonuçlarla eksiksiz bir Ticaret Stratejisi elde edersiniz.     Yeni özellikler:     Fiyat Arz/Talep Bölgesine ulaştığında uyarılar     Yeni bir Arz/Talep Bölgesi olu
Volume by Price MT5
Brian Collard
3.6 (5)
The Volumebyprice.com Indicator for MetaTrader 5 features Volume Profile and Market Profile TPO (Time Price Opportunity). Volume and TPO histogram bar and line charts. Volume Footprint charts. TPO letter and block marker collapsed and split structure charts. Static, dynamic and flexible range segmentation and compositing methods with relative and absolute visualizations. Session hours filtering and segment concatenation with Market Watch and custom user specifications. Graphical layering, posit
Legacy of Gann for MT5
Pavel Zamoshnikov
5 (6)
The indicator very accurately determines the levels of the possible end of the trend and profit fixing. The method of determining levels is based on the ideas of W.D.Gann, using an algorithm developed by his follower Kirill Borovsky. Extremely high reliability of reaching levels (according to K. Borovsky  - 80-90%) Indispensable for any trading strategy – every trader needs to determine the exit point from the market! Precisely determines targets on any timeframes and any instruments (forex, met
[ MT4 Version ] Only the next 10 units at current price! Final price: $299 Are you tired of spending months on demo or live accounts to test your trading strategies? The Backtesting Simulator is the ultimate tool designed to elevate your backtesting experience to new heights. Utilizing Metatrader historical symbol information, it offers an unparalleled simulation of real market conditions. Take control of your testing speed, test ideas quickly or at a slower pace, and witness remarkable improve
Easy By Sell is a market indicator for opening and closing positions. It becomes easy to track market entries with alerts. It indicates trend reversal points when a price reaches extreme values ​​and the most favorable time to enter the market. it is as effective as a Fibonacci to find a level but it uses different tools such as an algorithm based on ATR indicators and Stochastic Oscillator. You can modify these two parameters as you wish to adapt the settings to the desired period. My othe
This is arguably the most complete harmonic price formation auto-recognition indicator you can find for the MetaTrader Platform. It detects 19 different patterns, takes fibonacci projections as seriously as you do, displays the Potential Reversal Zone (PRZ) and finds suitable stop-loss and take-profit levels. [ Installation Guide | Update Guide | Troubleshooting | FAQ | All Products ] It detects 19 different harmonic price formations It plots primary, derived and complementary Fibonacci p
Trend Line Map Pro MT5
STE S.S.COMPANY
4.3 (10)
Trend Line Map indicator is an addons for   Trend Screener Indicator . It's working as a scanner for all signals generated by Trend screener ( Trend Line Signals ) . It's a Trend Line Scanner based on Trend Screener Indicator.  If you don't have Trend Screener Pro Indicator,   the Trend Line Map Pro will not work.     LIMITED TIME OFFER : Trend Line Map Indicator is available for only 50 $ and lifetime. ( Original price 125$ ) By accessing to our MQL5 Blog,  you can find all our premium indica
Yazarın diğer ürünleri
This indicator will draw patterns based on   Rob Smith's   The Strat   as they emerge in real time on your chart. As price evolves,   TheStrat   offers 18 distinct price action patterns that can help you get good entries in the market. Each pattern involves two or three candles, and this indicator will draw a bounding box around the candles and name the pattern. The indicator also shows when a potential setup is forming, known by stratters as an Actionable signal. Candles Each candle is de
Multi Chart Crosshairs
Robert Gerald Wood
5 (2)
This indicator is designed to make reviews of many charts on different timescales quicker, and easier to do. Track Time and Price across multiple charts Change Symbol on one chart and all other charts of the same symbol will be changed too. Easy to use, quick to master The indicator allows you to identify the price and time where the mouse pointer is on the current chart, across all other charts open on the same Symbol. This allows you to quickly see information on multiple charts whereas normal
Aralık Tükenmesi, fiyat cari dönem için beklenen aralığı karşıladığında veya aştığında gerçekleşir. Bu seviyelerde fiyat, dönemin başına göre momentumunu kaybetmeye başlar, bu nedenle yeni pozisyonlar almadığınızdan emin olmak için iyi bir nokta. Bu gösterge, Günlük, Haftalık ve Aylık dönemler için seviyeleri göstererek, grafiğinizde bunun olma olasılığının yüksek olduğu yerleri size gösterecektir. Fiyatların bu tükenme seviyelerini aştığını gördüğünüzde, bu size hareketin arkasındaki momentumun
Active Pivot Levels
Robert Gerald Wood
5 (1)
Pivot seviyeleri, her pazarda tanınan, iyi kurulmuş bir teknik seviyedir. Bu gösterge, herhangi bir sembol için mevcut Üç Aylık, Aylık, Haftalık, Günlük ve dört saatlik pivotları grafik üzerinde çizecektir. Ayrıca her dönem için Destek ve Direnç seviyelerini gösterebilir ve 1 ile 4 arasındaki seviyelerden hangisinin görüntüleneceğini seçebilirsiniz.     Şunlardan Pivot türünü seçin: Standart Camarilla DeMark Ormancı Fibonacci Lütfen dikkat, DeMark pivotlarının orijinal spesifikasyona göre tek bi
Bu Komut Dosyası, trend çizgileri, Fibonachi Düzeltmeleri vb. gibi herhangi bir türdeki çizim nesnelerini bir veya daha fazla başka grafiğe kopyalamanıza olanak tanır. Varsayılan olarak komut dosyası, geçerli grafikteki, yani komut dosyasının uygulandığı grafikteki tüm nesneleri, o anda yüklü olan aynı Symbol'ün diğer herhangi bir grafiğine kopyalar. Ayarlar HedefZaman Dilimi PERIOD_CURRENT dışında herhangi bir değere ayarlandığında, nesneleri komut dosyasının uygulandığı grafikle aynı Sem
FREE
TheStrat TFC Monitor MT5
Robert Gerald Wood
5 (1)
The Strat   kullanarak işlem yaparken, birden çok zaman dilimine göz kulak olmak önemlidir. Bu gösterge, her zaman dilimi için mevcut mumun Günlük, Haftalık, Aylık ve Üç Aylık durumunu gösterecektir. Daire simgesi, o zaman dilimindeki mumun şu anda TheStrat terminolojisinde bir Inside veya Type 1 olduğunu gösterir. Bir Inside Day mumu, fiyat hareketini pekiştiriyor ve biz, aralığın kırılmasını arıyoruz. Yukarıyı veya aşağıyı gösteren bir Üçgen simgesi, trend olan bir mum veya TheStrat terminoloj
A simple script that can delete all the drawing objects on a chart, or just the objects of a specific type. Settings: DeleteObjectsOfType By default the value will be blank which means ALL drawing objects on the chart will be deleted. If you only wish to delete specific types of drawing object, change this setting to the type of object to delete. For example, Fibonacci Retracement, Text, Label or Trend Line. Please see the demonstration video for more information.
FREE
Rob Smith'in TheStrat'ını öğrenirken bu basit göstergeyi oluşturdum ve çok faydalı buldum, sizinle paylaşayım dedim. Yararlı bulursanız, lütfen MQL5'te yayınladığım diğer göstergelere bakın. Gösterge, grafik üzerinde daha yüksek bir zaman aralığından seçtiğiniz fiyat seviyesini gösteren tek bir çizgi çizer. Ayarları kullanarak, görüntülediği zaman çerçevesi üzerinde tam kontrole sahip olursunuz, ancak   varsayılan olarak, ölçeği bir adım yukarı taşıyarak daha yüksek zaman dilimini kendisi hesapl
FREE
This script allows you to toggle the "Show Trade Levels" option, but for the current chart only. Normally, you can only change the setting using the Options -> Chart menu for ALL charts, but this script allows you to do it for a SINGLE chart. I'm using it when I take screenshots, because most of the time I'm not trying to show the trades, just some functionality of one of my other tools. Iif you need that functionality, then this script is very helpful! If the script helps you, please let me
FREE
This indicator will draw patterns based on Rob Smith's The Strat as they emerge in real time on your chart. As price evolves, TheStrat offers 18 distinct price action patterns that can help you get good entries in the market. Each pattern involves two or three candles, and this indicator will draw a bounding box around the candles and name the pattern. The indicator also shows when a potential setup is forming, known by stratters as an Actionable signal. Candles Each candle is defined by i
TheStrat Levels
Robert Gerald Wood
This indicator draws the prior Highs and Lows for multiple timeframes, and can display potential Take Profit and Stop Loss levels. In Rob Smith's # The Strat   terms,   these are potential entry points, or alternatively potential targets for open positions. I like to use them in both ways. On a lower timeframe, say 5 minutes to get a good entry on a daily or weekly level, and then as a potential target. Very small stops required giving an excellent risk/reward ratio. Please watch the DEMO video
TheStrat Candles
Robert Gerald Wood
4.5 (2)
Bu gösterge, her mumun üstüne veya altına bir etiket çizecektir.       Rob Smith'in       Strat       grafiğinizde zamanla geliştikçe. Fiyat geliştikçe, bir mum üç durum arasında geçiş yapabilir. Mum ilk açıldığında, önceki yüksek ve alçak mumların içine tamamen oturursa, o zaman Tip 1 olarak başlar. tip 2 ve fiyat hareketi değişken ve yönsüz ise, önceki mumun karşı tarafını kırabilir ve tip 3 olabilir. mumlar Her mum, önceki mumla olan ilişkisi ile tanımlanır. Tip 1 - İç mum   - Mum tam
TheStrat FTFC
Robert Gerald Wood
FTFC, Rob Smith'in   The Strat   tarafından tanımlandığı şekliyle Tam Zaman Çerçevesi Sürekliliği anlamına gelir. Bu gösterge grafikte iki çizgi çizer; Üç Aylık, Aylık, Haftalık, Günlük veya Saatlik açılış seviyelerinin en yükseği ve bu değerlerin en küçüğünün ikincisi. Bu size, ticaretin tek yönde çok güçlü olma olasılığının daha yüksek olduğu bir kanal verir. Satırlar arasında fiyat hareketi daha dalgalı olacak ve daha geniş stoplar kullanabilirsiniz. Yüksekler ve alçaklar arasındaki orta nokt
Piyasalar yuvarlak rakamları gerçekten sever ve genellikle düşen bir piyasada destek veya fiyat yükselirken direnç olarak hareket ederler. Bu gösterge, Yuvarlak değerlerde fiyat seviyeleri çizmek için tasarlanmıştır. Bunu otomatik olarak yapar, ancak bunu geçersiz kılma ve görmek istediğiniz seviyeleri belirleme seçeneğiniz de vardır. Yuvarlak bir seviye 10'luk adımlar kadar basit olabilir, yani 10, 20, 30 vb. Gösterge, her biri farklı formatta olan Major ve Minor olmak üzere iki sınıf çizgi çiz
TheStrat Monitor
Robert Gerald Wood
3 (2)
If you've not already learnt about The Strat trading strategy , go google it now. I promise it won't be a waste of your time, and you will likely learn some new tricks whether you use it or not. OK, so now you know what TheStrat is, you will be able to understand what this indicator can do for you. Key Features In short, the Indicator will: Show Timeframe Continuity for all supported timeframes Supports two timeset views, Day trader and Swing trader Show when Full Timeframe Continuity is in pl
The Strat   kullanarak işlem yaparken, birden çok zaman dilimine göz kulak olmak önemlidir. Bu gösterge, her zaman dilimi için mevcut mumun Günlük, Haftalık, Aylık ve Üç Aylık durumunu gösterecektir. Daire simgesi, o zaman dilimindeki mumun şu anda TheStrat terminolojisinde bir Inside veya Type 1 olduğunu gösterir. Bir Inside Day mumu, fiyat hareketini pekiştiriyor ve biz, aralığın kırılmasını arıyoruz. Yukarıyı veya aşağıyı gösteren bir Üçgen simgesi, trend olan bir mum veya TheStrat terminoloj
ATR Extremes
Robert Gerald Wood
Ortalama Gerçek Aralık (ATR), belirli bir süre boyunca fiyattaki hareket miktarını ölçen yaygın olarak kullanılan bir göstergedir. Ancak verdiği değerin herhangi bir sınır içinde tanımlanmaması, zararı durdur veya kar al hesaplamaları dışında herhangi bir amaçla kullanılmasını neredeyse imkansız hale getirir. Bu gösterge, standart ATR göstergenizdir, ancak uç noktaları görebilmeniz için yüzdelik sınırlar ekledik. Yüzdelikler ile Bölünmüş Medyanlar dediğimiz bir şey arasında seçim yapabilirs
Range Exhaustion
Robert Gerald Wood
Aralık Tükenmesi, fiyat cari dönem için beklenen aralığı karşıladığında veya aştığında gerçekleşir. Bu seviyelerde fiyat, dönemin başına göre momentumunu kaybetmeye başlar, bu nedenle yeni pozisyonlar almadığınızdan emin olmak için iyi bir nokta. Bu gösterge, Günlük, Haftalık ve Aylık dönemler için seviyeleri göstererek, grafiğinizde bunun olma olasılığının yüksek olduğu yerleri size gösterecektir. Fiyatların bu tükenme seviyelerini aştığını gördüğünüzde, bu size hareketin arkasındaki momentumun
This indicator will draw a label above or below each candle based on   Rob Smith's   The Strat   as they develop over time on your chart. As price evolves, a candle can switch between three states. When the candle first opens, if it sits completely within the previous candles high and low, then it will start as a Type 1. As time moves on, if it breaks either the high or low of the previous candle, it will be come a type 2, and should the price action be volatile and directionless, it may then
TheStrat Levels MT5
Robert Gerald Wood
5 (1)
This indicator draws the prior Highs and Lows for multiple timeframes, and can display potential Take Profit and Stop Loss levels. In Rob Smith's # The Strat  terms, these are potential entry points, or alternatively potential targets for open positions. I like to use them in both ways. On a lower timeframe, say 5 minutes to get a good entry on a daily or weekly level, and then as a potential target. Very small stops required giving an excellent risk/reward ratio. Key Features  - Levels from Ho
FTFC, Rob Smith'in   The Strat   tarafından tanımlandığı şekliyle Tam Zaman Çerçevesi Sürekliliği anlamına gelir. Bu gösterge grafikte iki çizgi çizer; Üç Aylık, Aylık, Haftalık, Günlük veya Saatlik açılış seviyelerinin en yükseği ve bu değerlerin en küçüğünün ikincisi. Bu size, ticaretin tek yönde çok güçlü olma olasılığının daha yüksek olduğu bir kanal verir. Satırlar arasında fiyat hareketi daha dalgalı olacak ve daha geniş stoplar kullanabilirsiniz. Yükselişler ve düşüşler arasındaki orta no
TheStrat Monitor MT5
Robert Gerald Wood
5 (1)
Henüz   Strat ticaret stratejisini   öğrenmediyseniz, şimdi google'a gidin. Vaktini boşa harcamayacağına söz veriyorum ve kullansan da kullanmasan da muhtemelen bazı yeni numaralar öğreneceksin. Tamam, artık TheStrat'ın ne olduğunu biliyorsunuz, bu göstergenin sizin için neler yapabileceğini anlayabileceksiniz. Ana Özellikler Kısacası, Gösterge şunları yapacaktır: Desteklenen tüm zaman dilimleri için Zaman Çerçevesi Sürekliliğini Göster İki zaman seti görünümünü destekler, Günlük tüccar ve Swi
Pivot seviyeleri, her pazarda tanınan, iyi kurulmuş bir teknik seviyedir. Bu gösterge, herhangi bir sembol için mevcut Üç Aylık, Aylık, Haftalık, Günlük ve dört saatlik pivotları grafik üzerinde çizecektir. Ayrıca her dönem için Destek ve Direnç seviyelerini gösterebilir ve 1 ile 4 arasındaki seviyelerden hangisinin görüntüleneceğini seçebilirsiniz.     Şunlardan Pivot türünü seçin: Standart Camarilla DeMark Ormancı Fibonacci Lütfen dikkat, DeMark pivotlarının orijinal spesifikasyona göre tek bi
Piyasalar yuvarlak rakamları gerçekten sever ve genellikle düşen bir piyasada destek veya fiyat yükselirken direnç olarak hareket ederler. Bu gösterge, Yuvarlak değerlerde fiyat seviyeleri çizmek için tasarlanmıştır. Bunu otomatik olarak yapar, ancak bunu geçersiz kılma ve görmek istediğiniz seviyeleri belirleme seçeneğiniz de vardır. Yuvarlak bir seviye 10'luk adımlar kadar basit olabilir, yani 10, 20, 30 vb. Gösterge, her biri farklı formatta olan Major ve Minor olmak üzere iki sınıf çizgi çiz
ATR Extremes MT5
Robert Gerald Wood
Ortalama Gerçek Aralık (ATR), belirli bir süre boyunca fiyattaki hareket miktarını ölçen yaygın olarak kullanılan bir göstergedir. Ancak verdiği değerin herhangi bir sınır içinde tanımlanmaması, zararı durdur veya kârı al hesaplamaları dışında herhangi bir amaçla kullanılmasını neredeyse imkansız hale getirmektedir. Bu gösterge sizin standart ATR göstergenizdir, ancak uç noktaları görebilmeniz için yüzdelik dilimler ekledik. Yüzdelikler ile Bölünmüş Medyanlar dediğimiz bir şey arasında seçim yap
Filtrele:
mm0079
137
mm0079 2024.01.15 18:46 
 

Works as promised. I only could not change the colour input for crosshair (on mac) but thats all.

Forexezek
48
Forexezek 2023.11.14 10:51 
 

Hello! I bought the indicator. Very good! However, when I'm not using it, it would be nice if MT5's built-in crosshairs would work again to press the middle mouse button. It's deleting this feature for some reason. Could you modify it like this? Please

Sorry, but I didn't see that you already corrected it and wrote an answer. Thank you very much!

Could there possibly be a setting to set the crosshairs in the background/foreground? 100% perfect indicator after the repair! You are a perfect seller!

Robert Gerald Wood
4427
Geliştiriciden yanıt Robert Gerald Wood 2023.11.16 14:55
Hello, many thanks for the review, and thank you for spotting the bug. I have just published a fix and you should be able to download the new version now.
The ability to configure the crosshairs as in the background is also available now.
Igazi
151
Igazi 2023.05.26 19:05 
 

WOW! What an amazing indicator! Worth the purchase!

nabil84
129
nabil84 2023.03.08 09:54 
 

The Best Tool to track time across multiple charts and Instruments ( As per now its the only one available on the Market for MT5 to get the job done) .Highly Recommended for Traders who want to track specific timing on different instrument.

hvralpha
61
hvralpha 2022.07.03 16:42 
 

This is a fantastic indicator and it works well as advertised. Sinc your crosshairs and quickly change chart symbols. I bought it and could not be happier. Makes my extensive analysis and changing symbols very easy.

Robert Gerald Wood
4427
Geliştiriciden yanıt Robert Gerald Wood 2022.07.04 11:35
So glad you're happy, thank you for the review :)
Mike Louw
202
Mike Louw 2022.06.30 16:04 
 

Just purchased it and works very well. Does what I want it to do.

Robert Gerald Wood
4427
Geliştiriciden yanıt Robert Gerald Wood 2022.06.30 16:55
Thanks for the review, glad you are happy with it 😊
Get Fit
54
Get Fit 2021.07.22 00:14 
 

I love this indicator. Great for how I trade using multiple time frame analysis. Great indicator. Thank you so much!!!!!

Robert Gerald Wood
4427
Geliştiriciden yanıt Robert Gerald Wood 2022.04.01 11:59
Thank you!
İncelemeye yanıt
Sürüm 2.0 2023.11.16
Added a configuration parameter so you can choose to have the crosshair lines drawn in the background.
By default, it is set to false so the crosshairs are drawn in the foreground as they were in the previous versions.
Be aware, if your chart has the candles displayed as always on top, then the crosshairs will always be drawn behind the candles.
Sürüm 1.90 2023.11.14
Fixed issue with the built-in crosshairs not working after using this indicator. Now, once you press the ESC key the built-in crosshairs works again.
Sürüm 1.80 2023.03.07
Performance improvements for instances where many charts are loaded.
Sürüm 1.70 2023.03.05
Added ability to track Time across all charts, not just the current charts symbol. This is controlled by the new setting TrackTimeOnly which defaults to false so existing users are unaffected unless they turn the option on.