Actual Depth of Market Chart
- Göstergeler
- Sergey Andreev
- Sürüm: 1.5
- Güncellendi: 20 Temmuz 2020
- Etkinleştirmeler: 5
The professional tool of stock traders in now available on MetaTrader 5. The Actual depth of market chart indicator visualizes the depth of market in the form of a histogram displayed on a chart, which refreshes in the real-time mode.
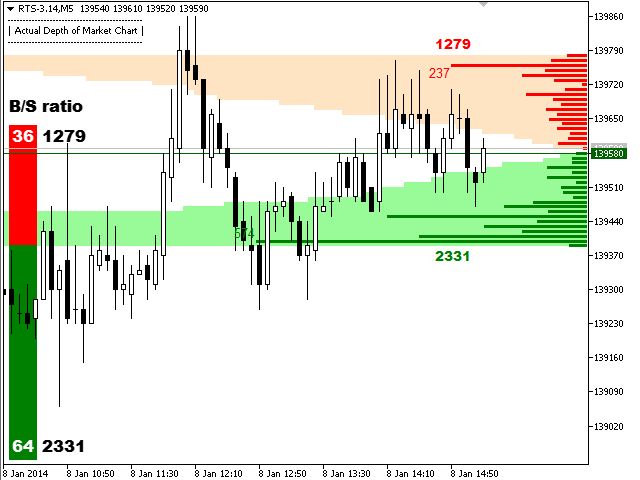
Now Actual Depth of Market indicator displays the current ratio of volume of buy and sell requests (B/S ratio). It shows the share of volume of each type of requests in the entire flow of requests as well as the absolute values of the volume.
What's the use of it? There is a common point of view among HFT traders, that when there is a significant domination of request of one type, the price tends where the requests are executed, i.e. where the volume is bigger. Watch it and use for trading with our indicator Actual Depth of Market!
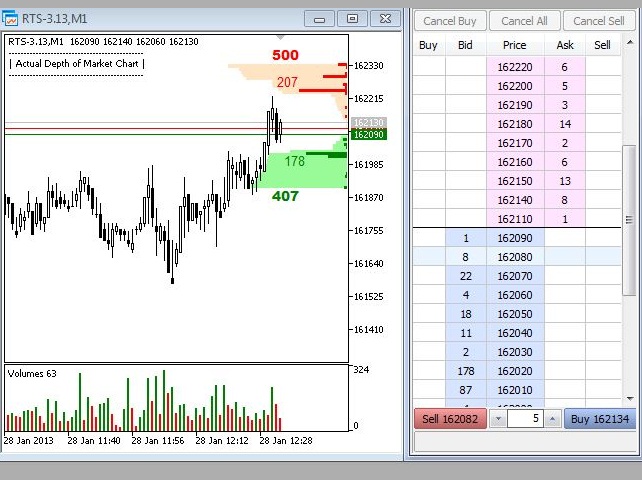
With the Actual depth of market chart indicator you will be able to estimate requests on the market right and see big market makers right on the chart. This will allow precise scalping and setting stop orders for positions 100% correctly.
The indicator displays the buy and sell requests in the form of horizontal histogram bars of two corresponding colors (buy-sell). Bars are displayed on the price chart and their length corresponds to the volume of requests for the given level. Additionally, it indicates the volume of biggest buy and sell requests.
The indicator displays the total number of buy and sell requests as a stacked area chart. This allows estimating the total volume of requests that will be executed when passing to the next price level. The total volume of buy and sell requests is also displayed on the chart.
On default, the indicator is displayed on the chart background and it does not interfere with any other indicators. When using this indicator for trading, it is recommended to go by real volumes.
This indicator will only work with symbols that have the depth of market available. First of all, it will be interesting for trades on the FORTS market and other stock markets accessible through MetaTrader 5.
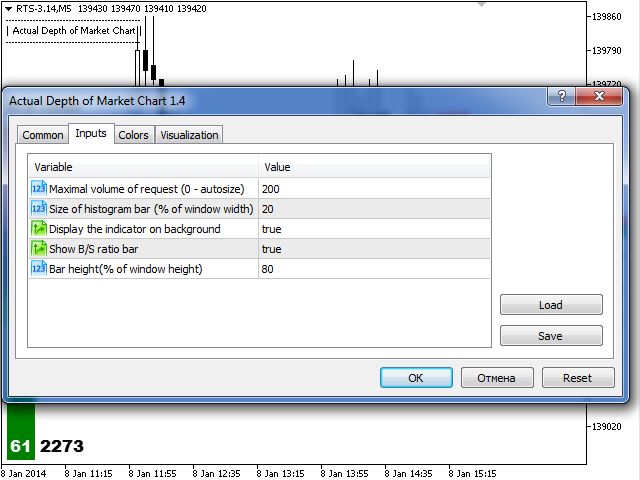
The indicator parameters allow adjusting it to the maximum convenience of use:
- Maximal volume of request (0 - autosize) - maximal volume of a request that corresponds to the bar size. If '0' is specified, the size will be set automatically according to the maximal volume of a request in the depth of market. This parameter allows fixing the histogram scale (default value is 200).
- Size of histogram bar - size of a bar of the histogram (%). Percentage of the window width that will be occupied by a request of the volume equal to the one set in the first parameter (default value is 20).
- Display the indicator on background - display the indicator on the chart background. Allows drawing the indicator underneath the price chart and other indicators (default value is true).
- Show B/S ratio bar - display B/S rates on the chart.
- Bar height(% of window height) - height of B/S diagram (as percentage of the window height).


абсолютно бесполезный индикатор, стандартный стакан показывает больше и точнее. Автор на вопросы не отвечает