• Genel bakış
  • İncelemeler (2)
  • Yorumlar (3)
  • Yenilikler

MR Reversal Patterns 5

5

In the "Masters of Risk" trading system, one of the main concepts is related to places where markets change direction. In fact, this is a change in priority and a violation of the trend structure at the extremes of the market, where supposedly there are or would be stop-losses of "smart" participants who are outside the boundaries of the accumulation of volume. For this reason, we call them "Reversal Patterns" - places with a lot of weight for the start of a new and strong trend.

Some of the important benefits of the indicator are as follows:
  • Through the indicator you can see the changes in the trend structure of the market.
  • The indicator shows the key places where the price movement changes its direction.
  • The patterns contain accumulated volume in the market.
  • The structure of the patterns is similar to the "MW" indicators, but is created from scratch by the author's methodology.
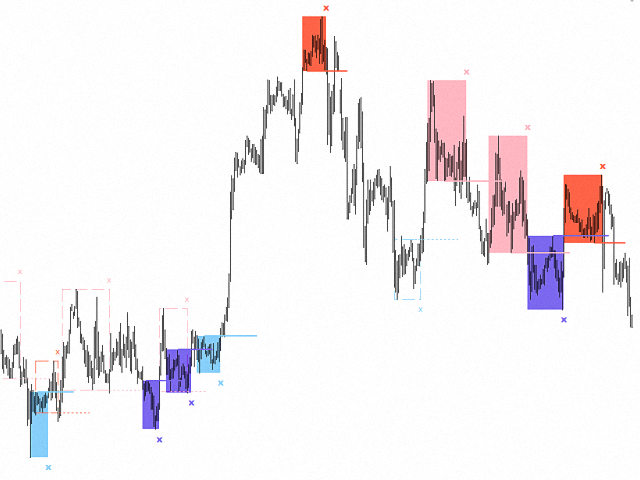
  • Reversal pattern 1 - "Change of priority" (“Pereprior” in Russian language) indicates a strong change in trend direction or a tendency. It is characterized by updating the reasonable extremum Low from the uptrend and High from the downtrend.
  • Reversal pattern 2 - "Violation of trend structure" (“Slom“ in Russian language) indicates a less pronounced change in trend direction or a tendency. It is also characterized by updating the reasonable extremum Low from the uptrend and High from the downtrend.
  • Of the Patterns - "Reversal pattern 1" is more powerful than "Reversal pattern 2" for breaking the tendency of market movements.
  • The indicator shows the "Structural levels" at which the price movement in a given direction has been broken. The structural level line continues to the first possible price test point where a breakout has occurred.
  • Indicator shows "Stop loss" places. You can see how the "Big" players are hunting for stop losses.
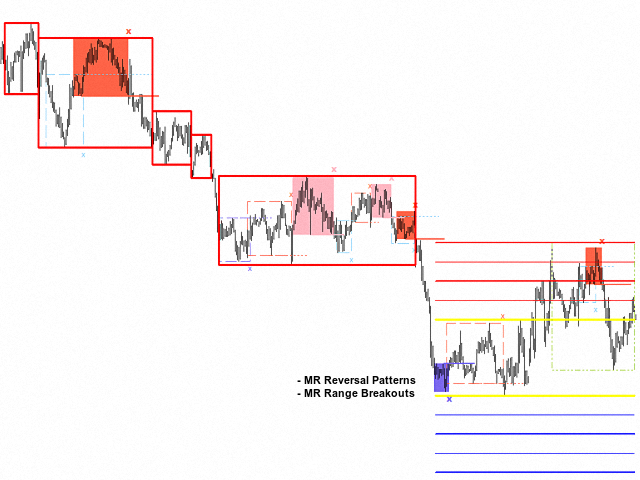
  • In combination with the "MR Range Breakouts" indicator, you can see how buyers and sellers are distributed in the "Range". Since every trader waits for confirmation that their market entry is correct, the appearance of "Reversal Patterns" in the "Range" forms the accumulation of the open positions in a place, that we define as a "Point of Control" in the Volume Profile of the Range ". During the movement of the price in a trend, you can see how "Balances" are formed according to the "Auction Market Theory".
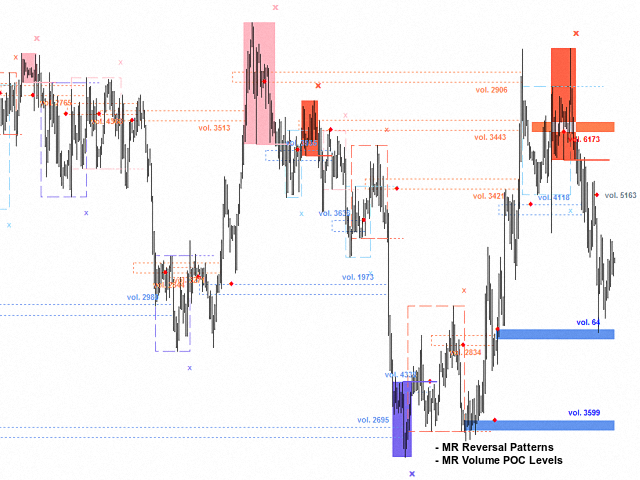
    • In combination with the "MR Volume POC Levels" indicator, you can track key places where volumes are absorbed and then new volumes appear in the opposite direction.
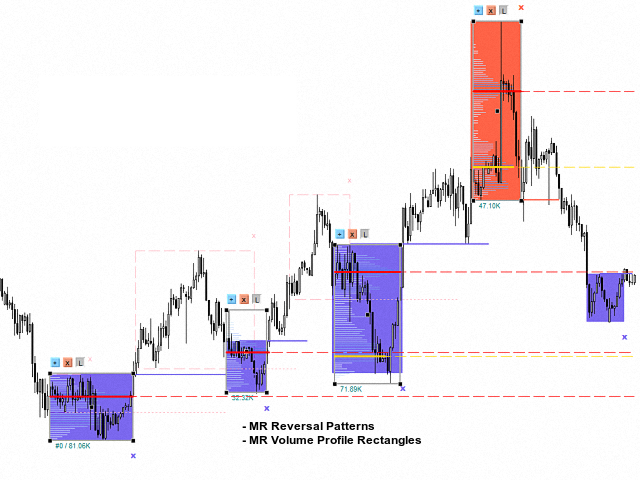
      • In combination with the "MR Volume Profile Rectangles" indicator, you can see how the volumes are distributed in the "Reversal Patterns". Volumes in the "Reversal Patterns" structure are like fingerprints.
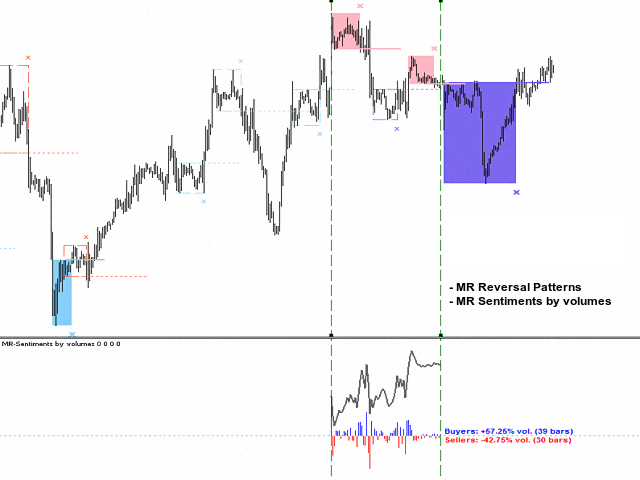
      • In combination with the "MR Sentiments by volumes" indicator, you can see when the imbalance of volumes have weight when "Reversal patterns" appear and their combinations between them.

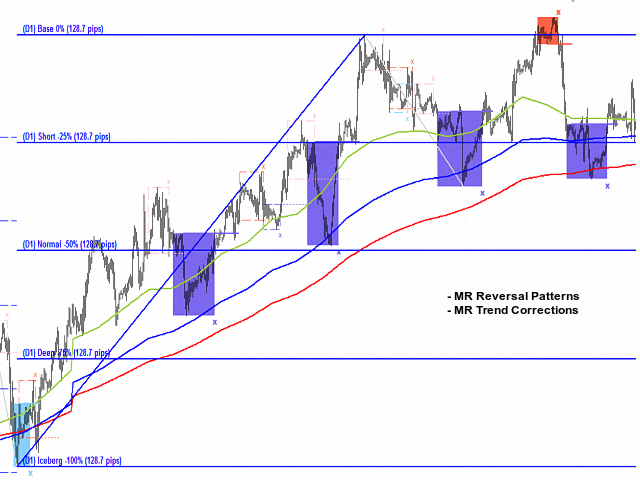
          • In combination with the "MR Trend Corrections" indicator, you can track how the price moves in "Impulse" and where the price ends its corrections.


          Note:

          In the new version of the indicator, we use a formula to determine "Reversal Patterns" based on updating the extremes of the price movement. This gives us several advantages, such as more accurate determination of "Reversal Patterns", smaller stop losses and better entries along the price movement. For people who are used to the old scale of the patterns, you should select a higher time frame in the indicator settings. For example, an old formula for determining "Reversal Patterns" on the H1 time frame displayed patterns that you can now see if you select the H4 time frame in the indicator settings. It takes a little time to get used to the new way of defining "Reversal Patterns", but in time you will appreciate the new advantages!!!


          If you liked the indicator, please support our work by giving 5 stars!!!

          For MetaTrader 4 https://www.mql5.com/en/market/product/63854

          How to use indicators - Article


          Indicator settings:

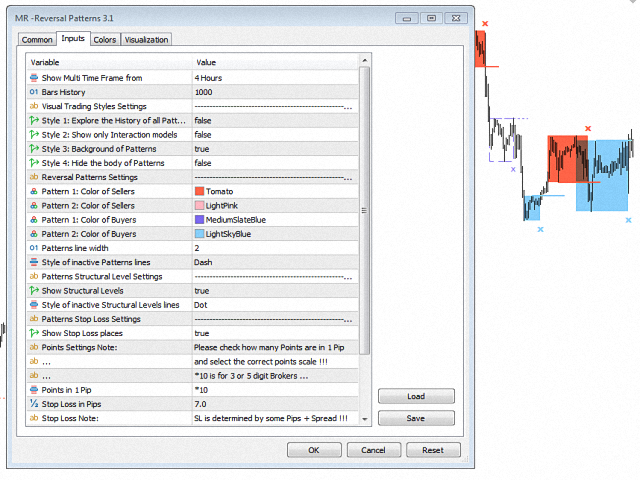
          Show Multi Time Frame from - Multi time frame on which to calculate the indicator.By default, the indicator works with data from time frame H1.
          Bars History - Number of bars on which the indicator works from multi time frame H1.

          Section "Visual Trading Styles Settings"
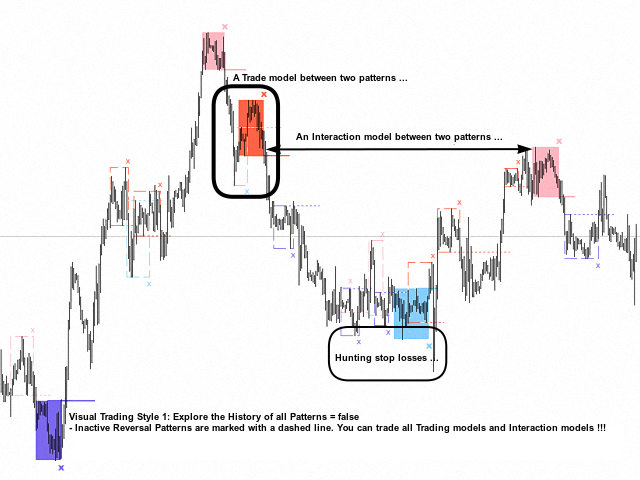
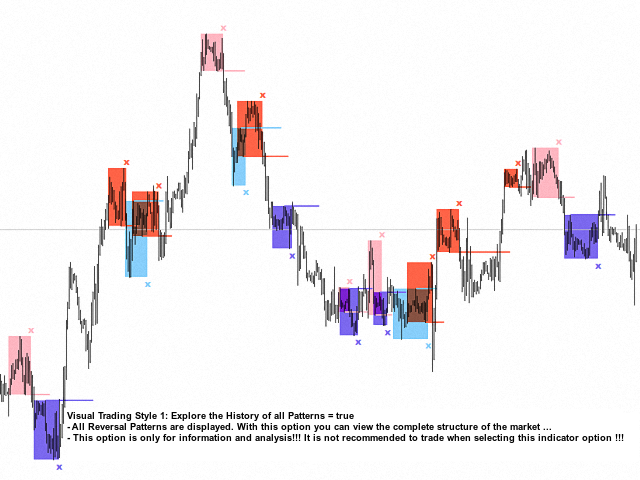
          Style 1: Explore the History of all Patterns - Shows or not patterns closed by the price, with a dashed line and no background. If you have chosen "false", inactive "Reversal Patterns" are marked with a dashed line and you can trade all "Trading models" and "Interaction models". If you have chosen "true", all "Reversal Patterns" are displayed and you can view the complete structure of the market. This option is only for information and analysis!!!
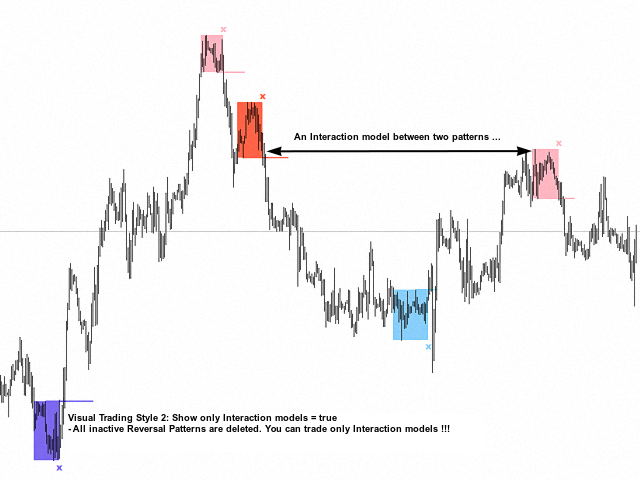
          Style 2: Show only Interaction models - All inactive "Reversal Patterns" are deleted and you can trade only "Interaction models"!!!
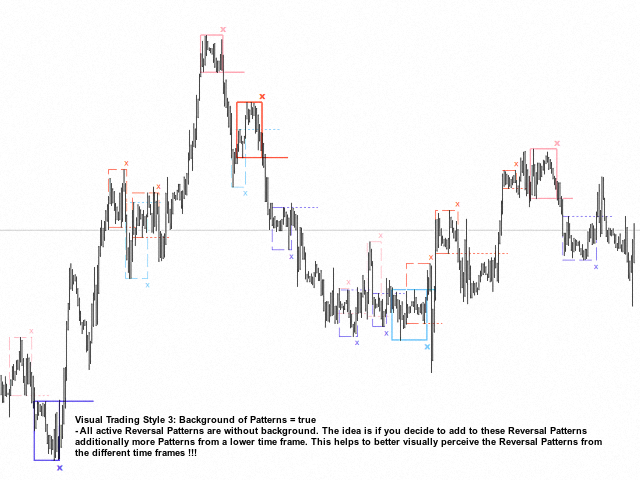
          Style 3: Background of Patterns - Shows or not the background of the Reversal Patterns.
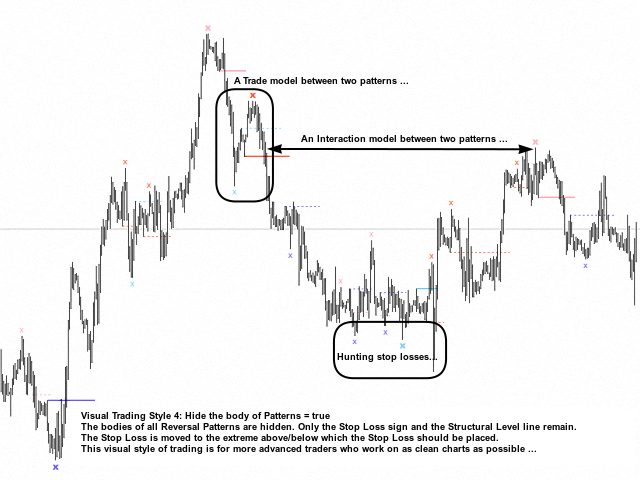
          Style 4: Hide the body of Patterns - Shows or hide the body of Reversal Patterns. The body of the Patterns will become colorless to keep the alerts working. The Stop Loss changes its place from the end of the Patterns body to the extreme point where it should be set.

          Section "Reversal Patterns Settings"
          Pattern 1: Color of Sellers - Background color for Sellers Pattern 1. It also defines the color for displaying Structural Levels and Stop Losses.
          Pattern 2: Color of Sellers - Background color for Sellers Pattern 2. It also defines the color for displaying Structural Levels and Stop Losses.
          Pattern 1: Color of Buyers - Background color for Buyers Pattern 1 for Buy. It also defines the color for displaying Structural Levels and Stop Losses.
          Pattern 2: Color of Buyers - Background color for Buyers Pattern 2. It also defines the color for displaying Structural Levels and Stop Losses.
          Patterns line width - Shows the line width for Patterns and Structural Levels.
          Style of inactive Patterns lines - You can choose how to display the body of the inactive Patterns.

          Section "Patterns Structural Level Settings"
          Show Structural Levels - Shows or not Structural Levels of Patterns.
          Style of inactive Structural Levels lines - You can choose how to display the Structural Levels of Patterns.

          Section "Patterns Stop Loss Settings"
          Points in 1 Pip - Offers you a choice of the number of Points in 1 Pip.
          Stop Loss in Pips - You choose the size of the stop loss. For example, a stop loss of 5 pips + a spread of 2 pips form a size of 7 pips for the total stop loss.
          Stop Loss font size - You can choose the size of the stop loss symbol "x".

          Section "Alert settings for Reversal Patterns"
          Alert when created Reversal Pattern - Displays an alarm when a new Pattern is drawn.
          Alert when Reversal Pattern is closed - Displays an alarm when a Pattern is closed by the price movement and it is shown with a dashed line.

            İncelemeler 2
            nwh1984
            602
            nwh1984 2024.12.05 18:33 
             

            Excellent Indicator when used in conjunction with the other offered tools from the author. I have been really enjoying combining the reversal boxes with the POC levels indicator! Although I did rent all of the available indicators from this author, I find the mentioned indicators to be my favorite of the bunch when combined together.

            David Gaganidze
            359
            David Gaganidze 2022.06.01 07:43 
             

            отличный индикатор

            Önerilen ürünler
            Owl Smart Levels MT5
            Sergey Ermolov
            4 (29)
            MT4 versiyonu  |  FAQ Owl Smart Levels Indicator , Bill Williams'ın gelişmiş fraktalları , piyasanın doğru dalga yapısını oluşturan Valable ZigZag ve kesin giriş seviyelerini gösteren Fibonacci seviyeleri gibi popüler piyasa analiz araçlarını içeren tek gösterge içinde eksiksiz bir ticaret sistemidir. pazara ve kar elde edilecek yerlere. Stratejinin ayrıntılı açıklaması Gösterge ile çalışma talimatı Baykuş Yardımcısı ticaretinde Danışman Yardımcısı Kullanıcıların özel sohbeti -> Satın aldıktan
            Noize Absorption Index - is the manual trading system that measures the difference of pressure between bears forces and bulls forces. Green line - is a noize free index that showing curent situation. Zero value of index shows totally choppy/flat market.Values above zero level shows how powerfull bullish wave is and values below zero measures bearish forces.Up arrow appears on bearish market when it's ready to reverse, dn arrow appears on weak bullish market, as a result of reverse expectation.
            STRICTLY FOR BOOM INDEX ONLY!!!!! Here I bring the Maximum Trend Arrows OT1.0 MT5 indicator. This indicator is made up of a combination of different trend indicators for entries and exits, for entries an orange arrow will paint on the chart below the current market and a red flag for closing of trades and it produces buy arrows only. When the orange arrow appears, it will appear along with it's sound to notify you. The 1H timeframe is recommended, don't use it anywhere else than on the 1H timefr
            Premium seviye, %80'den fazla doğru tahmin doğruluğuna sahip benzersiz bir göstergedir! Bu gösterge en iyi Ticaret Uzmanları tarafından iki aydan uzun süredir test edilmiştir! Yazarın göstergesini başka hiçbir yerde bulamazsınız! Ekran görüntülerinden bu aracın doğruluğunu kendiniz görebilirsiniz! 1, sona erme süresi 1 mum olan ikili opsiyon ticareti için harikadır. 2 tüm döviz çiftleri, hisse senetleri, emtialar, kripto para birimleri üzerinde çalışır Talimatlar: Kırmızı ok göründüğü an
            Your Trend Friend
            Luigi Nunes Labigalini
            5 (1)
            The trend is your friend! Look at the color of the indicator and trade on that direction. It does not  repaint. After each candle is closed, that's the color of the trend. You can focus on shorter faster trends or major trends, just test what's most suitable for the symbol and timeframe you trade. Simply change the "Length" parameter and the indicator will automatically adapt. You can also change the color, thickness and style of the lines. Download and give it a try! There are big movements w
            L'indicatore SMC Venom Model BPR è uno strumento professionale per i trader che operano nell'ambito del concetto di Smart Money (SMC). Identifica automaticamente due modelli chiave sul grafico dei prezzi: FVG   (Fair Value Gap) è una combinazione di tre candele, in cui c'è un gap tra la prima e la terza candela. Forma una zona tra livelli in cui non c'è supporto di volume, il che spesso porta a una correzione dei prezzi. BPR   (Balanced Price Range) è una combinazione di due modelli FVG che for
            HMA Trend Professional MT5
            Pavel Zamoshnikov
            4.25 (4)
            Improved version of the free HMA Trend indicator (for MetaTrader 4) with statistical analysis. HMA Trend is a trend indicator based on the Hull Moving Average (HMA) with two periods. HMA with a slow period identifies the trend, while HMA with a fast period determines the short-term movements and signals in the trend direction. The main differences from the free version: Ability to predict the probability of a trend reversal using analysis of history data. Plotting statistical charts for analyzi
            The Penta-O is a 6-point retracement harmonacci pattern which usually precedes big market movements. Penta-O patterns can expand and repaint quite a bit. To make things easier this indicator implements a twist: it waits for a donchian breakout in the right direction before signaling the trade. The end result is an otherwise repainting indicator with a very reliable trading signal. The donchian breakout period is entered as an input. [ Installation Guide | Update Guide | Troubleshooting | FAQ | A
            Magic Finger can help you identify trends and trading opportunities clearly. The finger points to the open position signal, and the discoloration line is confirmed by the trend. If you are a day trader, you can choose to trade during a period of active trading, referring to the discoloration line as the basis for the next order, finger signal as a filter. If you are a trend trader, you can choose a period above H1, wait for the appearance of the finger signal in the key price area, and enter th
            Wave Trend MT5
            Diego Arribas Lopez
            MT4 Version Wave Trend MT5 Wave Trend is an oscillator, which helps identifing in a extremely accurate manner market reversals. The Oscillator being obove the overbought level and a cross down of the fast into the slow MA usually indicates a good SELL signal. If the oscillators is below the oversold level and the fast MA crosses over the slower MA usually highlights a good BUY signal. The Wave Trend indicator can be also used when divergences appear against the price, indicating the current move
            Statistical Arbitrage Spread Generator for Cointegration [MT5] What is Pair Trading? Pair trading is a market-neutral strategy that looks to exploit the relative price movement between two correlated assets — instead of betting on the direction of the market. The idea? When two assets that usually move together diverge beyond a statistically significant threshold, one is likely mispriced. You sell the expensive one, buy the cheap one , and profit when they converge again. It’s a statistica
            FREE
            Neural Hybrid Direction Predictor
            Javier Santiago Gaston De Iriarte Cabrera
            Boltzmann-Hopfield Hibrit Tahmin Göstergesi, fiyat hareketlerini tahmin etmek için sinir ağı tahmini ile volatilite analizini birleştiren gelişmiş bir MetaTrader göstergesidir. Tahmin edilen yükseliş hareketleri için yeşil oklar ve düşüş hareketleri için kırmızı oklar gösterir. Gösterge yalnızca belirli volatilite koşulları karşılandığında sinyal üretir ve tahminleri filtrelemek için ATR, geçmiş volatilite ve desen tanıma kullanır. Temel Özellikler: Sonraki çubuk yönü için tahmin okları Volatili
            Renko Gold
            Ignacio Agustin Mene Franco
            Renko Gold! clearly indicates the floors and ceilings where it goes from 4 lines, the line below that marks the floor in green confirming with the thinnest line clarifies the purchase entry, the same is for sale, the top line marks the ceiling and the thinnest red line marks the sale, This indicator works for all temporalities! For Forex and Synthetic Indices markets! It also works for crypto markets! Good profit! World Investor.
            An indicator of pattern #31 ("Long Island") from Encyclopedia of Chart Patterns by Thomas N. Bulkowski. The second gap is in the opposite direction. Parameters: Alerts - show alert when an arrow appears   Push - send a push notification when an arrow appears (requires configuration in the terminal) GapSize - minimum gap size in points ArrowType - a symbol from 1 to 17 ArrowVShift - vertical shift of arrows in points   ShowLevels - show levels ColUp - color of an upward line ColDn - color of a d
            SolarTrade Suite Finansal Göstergesi: Jüpiter Piyasa Göstergesi - Finans Piyasaları Dünyasında Güvenilir Rehberiniz! Bu, değerini hesaplamak için özel yenilikçi ve gelişmiş algoritmalar kullanan ve ayrıca göze hoş gelen bir tasarıma sahip bir trend göstergesidir. Bu göstergenin okumalarını anlamak çok kolaydır: mavi renk - al, kırmızı - sat. Açıklamanın alt kısmında SolarTrade Suite serisindeki diğer ürünlerimize göz atın. Yatırım ve finans piyasaları dünyasında güvenle gezinmek ister misin
            Introducing   Order Blocks Breaker , a brand-new way to identify and leverage order blocks in your trading strategy. After developing multiple order block tools with unique concepts, I’m proud to present this tool that takes things to the next level. Unlike previous tools,   Order Blocks Breaker   not only identifies order blocks but also highlights   Breaker Order Blocks —key areas where the price is likely to retest after a breakout. MT4 -  https://www.mql5.com/en/market/product/124101/ This t
            Trading Utility for Forex Currency Pairs Only not for Gold  Functions Auto Lot Calculation based on Risk Auto stoploss  Auto TakeProfit Breakeven Auto Close Half % Close in percentage with respect to the PIPs Pending Orders BuyLimit Sell Limit with distances BuyStop Sell Stop    with distances Trading Informations Risk in percentage For Multiple trades Combine Takeprofit and Combine Stoplosses
            Göstergenin Hakkında Bu gösterge, bir finansal aracın kapanış fiyatları üzerinde yapılan Monte Carlo simülasyonlarına dayanmaktadır. Tanım olarak, Monte Carlo, daha önce gözlemlenen sonuçlara dayalı rastgele sayılar kullanarak bir süreçteki farklı sonuçların olasılıklarını modellemek için kullanılan bir istatistiksel tekniktir. Nasıl Çalışır? Bu gösterge, tarihsel verilere dayanarak zaman içinde rastgele fiyat değişikliklerini modelleyerek bir menkul kıymet için birden fazla fiyat senaryosu olu
            Mine Farm is one of the most classic and time-tested scalping strategies based on the breakdown of strong price levels. Mine Farm is the author's modification of the system for determining entry and exit points into the market... Mine Farm - is the combination of great potential with reliability and safety. Why Mine Farm?! - each order has a short dynamic Stop Loss - the advisor does not use any risky methods (averaging, martingale, grid, locking, etc.) - the advisor tries to get the most
            This indicator is used to compare the relative strength of the trade on the chart against the other several selected symbols. By comparing the price movement of each traded variety based on the same base day, several trend lines of different directions can be seen, reflecting the strong and weak relationship between the several different traded varieties, so that we can have a clearer understanding of the market trend. For example, you can apply this indicator on a EurUSD chart and compare it w
            Note : i only sell this EA on MQL5, any other sellers is fake. Orbit Rage Final, a cutting-edge trading strategy meticulously designed around the bull/bear candle approach and divergence analysis. This powerful tool is engineered to empower you to shape the life you desire. To embark on this transformative journey, simply download and seamlessly integrate it into your MetaTrader 4 platform by placing it in the experts advisors folder. Orbit Rage Final revolutionizes trading by offering a risk-f
            Atomic Analyst MT5
            Issam Kassas
            4.32 (19)
            Öncelikle belirtmek gerekir ki bu Ticaret Göstergesi Yeniden Çizim Yapmaz, Gecikmez ve Gecikme Göstermez, bu da hem manuel hem de robot ticareti için ideal hale getirir. Kullanıcı kılavuzu: ayarlar, girişler ve strateji. Atom Analisti, Piyasada Daha İyi Bir Avantaj Bulmak İçin Fiyatın Gücünü ve Momentumunu Kullanan PA Fiyat Hareketi Göstergesidir. Gürültüleri ve Yanlış Sinyalleri Kaldırmaya ve Ticaret Potansiyelini Artırmaya Yardımcı Olan Gelişmiş Filtrelerle Donatılmıştır. Birden fazla katmanl
            This Indicator enhances the default Relative Strength Index (RSI) by introducing several improvements. First, it visually highlights overbought and oversold regions by changing the RSI color from white to red. Second, it includes additional reference lines at 20, 40, 50, 60, and 80, providing a clearer framework for assessing RSI values. The most notable feature is the use of the middle 50-line to indicate the current market cycle. The color of the 50-line dynamically reflects the cycle: green f
            How to use Pair Trading Station Pair Trading Station is recommended for H1 time frame and you can use it for any currency pairs. To generate buy and sell signal, follow few steps below to apply Pair Trading Station to your MetaTrader terminal. When you load Pair Trading Station on your chart, Pair Trading station will assess available historical data in your MetaTrader platforms for each currency pair. On your chart, the amount of historical data available will be displayed for each currency pai
            Laguerre SuperTrend Clouds   adds an Adaptive Laguerre averaging algorithm and alerts to the widely popular SuperTrend indicator. As the name suggests,   Laguerre SuperTrend Clouds (LSC)   is a trending indicator which works best in trendy (not choppy) markets. The SuperTrend is an extremely popular indicator for intraday and daily trading, and can be used on any timeframe. Incorporating Laguerre's equation to this can facilitate more robust trend detection and smoother filters. The LSC uses the
            SolarTrade Suite Finansal Robot: LaunchPad Market Expert - işlemleri açmak için tasarlanmıştır! Bu, değerlerini hesaplamak için özel yenilikçi ve gelişmiş algoritmalar kullanan bir işlem robotudur, Finans Piyasaları Dünyasındaki Asistanınız. Bu robotu başlatmak için anı daha iyi seçmek için SolarTrade Suite serisindeki gösterge setimizi kullanın. Açıklamanın alt kısmında SolarTrade Suite serisindeki diğer ürünlerimize göz atın. Yatırım ve finans piyasaları dünyasında güvenle gezinmek ister m
            Trade smarter, not harder: Empower your trading with Harmonacci Patterns This is arguably the most complete harmonic price formation auto-recognition indicator you can find for the MetaTrader Platform. It detects 19 different patterns, takes fibonacci projections as seriously as you do, displays the Potential Reversal Zone (PRZ) and finds suitable stop-loss and take-profit levels. [ Installation Guide | Update Guide | Troubleshooting | FAQ | All Products ] It detects 19 different harmonic pri
            Öncelikle, bu Ticaret Aracının Non-Repainting, Non-Redrawing ve Non-Lagging Gösterge olduğunu vurgulamakta fayda var, bu da onu profesyonel ticaret için ideal hale getiriyor. Çevrimiçi kurs, kullanıcı kılavuzu ve demo. Akıllı Fiyat Hareketi Kavramları Göstergesi, hem yeni hem de deneyimli tüccarlar için çok güçlü bir araçtır. İleri ticaret fikirlerini, Inner Circle Trader Analizi ve Smart Money Concepts Ticaret Stratejileri gibi 20'den fazla kullanışlı göstergeyi bir araya getirerek bir araya
            PipFinite Trend PRO MT5
            Karlo Wilson Vendiola
            4.84 (552)
            Breakthrough Solution For Trend Trading And Filtering With All Important Features Built Inside One Tool! Trend PRO's smart algorithm detects the trend, filters out market noise and gives entry signals with exit levels. The new features with enhanced rules for statistical calculation improved the overall performance of this indicator. Important Information Revealed Maximize the potential of Trend Pro, please visit www.mql5.com/en/blogs/post/713938 The Powerful Expert Advisor Version Automatin
            Was: $249  Now: $149   Market Profile defines a number of day types that can help the trader to determine market behaviour. A key feature is the Value Area, representing the range of price action where 70% of trading took place. Understanding the Value Area can give traders valuable insight into market direction and establish the higher odds trade. It is an excellent addition to any system you may be using. Inspired by Jim Dalton’s book “Mind Over Markets”, this indicator is designed to suit the
            Bu ürünün alıcıları ayrıca şunları da satın alıyor
            RelicusRoad Pro MT5
            Relicus LLC
            4.78 (18)
            Şimdi 147 $ (birkaç güncellemeden sonra 499 $ 'a yükseliyor) - Sınırsız Hesaplar (PC'ler veya Mac'ler) RelicusRoad Kullanım Kılavuzu + Eğitim Videoları + Özel Discord Grubuna Erişim + VIP Durumu PİYASAYA BAKMAK İÇİN YENİ BİR YOL RelicusRoad, forex, vadeli işlemler, kripto para birimleri, hisse senetleri ve endeksler için dünyanın en güçlü ticaret göstergesidir ve yatırımcılara kârlı kalmaları için ihtiyaç duydukları tüm bilgileri ve araçları sağlar. Başlangıç ​​seviyesinden ileri seviyeye ka
            MetaForecast M5
            Vahidreza Heidar Gholami
            5 (3)
            MetaForecast, fiyat verilerindeki harmonileri kullanarak herhangi bir piyasanın geleceğini tahmin eder ve görselleştirir. Piyasa her zaman tahmin edilemezken, fiyatlarda bir desen varsa, MetaForecast geleceği mümkün olduğunca doğru bir şekilde tahmin edebilir. Benzer ürünlere göre, MetaForecast piyasa eğilimlerini analiz ederek daha kesin sonuçlar üretebilir. Giriş Parametreleri Past size (Geçmiş boyut) MetaForecast'ın gelecekteki tahminler oluşturmak için kullandığı çubuk sayısını belirtir. Mo
            FxaccurateLS
            Shiv Raj Kumawat
            WHY IS OUR FXACCCURATE LS MT5 THE PROFITABLE ? PROTECT YOUR CAPITAL WITH RISK MANAGEMENT Gives entry, stop and target levels from time to time. It finds Trading opportunities by analyzing what the price is doing during established trends. POWERFUL INDICATOR FOR A RELIABLE STRATEGIES We have made these indicators with a lot of years of hard work. It is made at a very advanced level. Established trends provide dozens of trading opportunities, but most trend indicators completely ignore them! The
            NOTE: CYCLEMAESTRO is distributed only on this website, there are no other distributors. Demo version is for reference only and is not supported. Full versione is perfectly functional and it is supported. CYCLEMAESTRO , the first and only indicator of Cyclic Analysis, useful for giving signals of TRADING, BUY, SELL, STOP LOSS, ADDING. Created on the logic of   Serghei Istrati   and programmed by   Stefano Frisetti ;   CYCLEMAESTRO   is not an indicator like the others, the challenge was to inter
            Kârlı ticaret fırsatlarını kolaylıkla belirlemenize yardımcı olabilecek güçlü bir forex ticaret göstergesi mi arıyorsunuz? Beast Super Signal'den başka bir yere bakmayın. Bu kullanımı kolay trend tabanlı gösterge, sürekli olarak piyasa koşullarını izleyerek yeni gelişen trendleri araştırır veya mevcut trendlere atlar. Canavar Süper Sinyali, tüm dahili stratejiler birbiriyle uyumlu ve %100 örtüştüğünde bir al ya da sat sinyali vererek ek onay ihtiyacını ortadan kaldırır. Sinyal oku uyarısını aldı
            [ MT4 Version ]  [ Order Blocks ]  [ Kill Zones ]  [ SMT Divergences ] How to trade using Order Blocks :  Click here User Interface Performance:  During testing in the strategy tester, the UI may experience lag. Rest assured, this issue is specific to the testing environment and does not affect the indicator's performance in live trading. Elevate your trading strategy with the  Order Blocks ICT Multi TF  indicator, a cutting-edge tool designed to enhance your trading decisions through advanced o
            [ MT4 Version ]  [ Kill Zones ]  [ SMT Divergences ] How to trade using Order Blocks:  Click here User Interface Performance:  During testing in the strategy tester, the UI may experience lag. Rest assured, this issue is specific to the testing environment and does not affect the indicator's performance in live trading. Elevate your trading strategy with the  Order Blocks ICT Multi TF  indicator, a cutting-edge tool designed to enhance your trading decisions through advanced order block analysis
            AT Forex Indicator MT5
            Marzena Maria Szmit
            5 (5)
            The AT Forex Indicator MT5 is a sophisticated trading tool designed to provide traders with a comprehensive analysis of multiple currency pairs. This powerful indicator simplifies the complex nature of the forex market, making it accessible for both novice and experienced traders. AT Forex Indicator uses advanced algorithms to detect trends, patterns and is an essential tool for traders aiming to enhance their forex trading performance. With its robust features, ease of use, and reliable signal
            The Naveen Dynamic Square  MT5  is one of the best known  technical analysis tools  inspired  by WD Gann along with the Gann Fan and Gann Box. It is considered a cornerstone of his trading technique that is based on time and price symmetry. The Naveen Dynamic Square MT5   is a powerful tool in finance for determining support and resistance levels based on a stock's extreme price points. It works by extrapolating probable price levels from a central value, typically an all-time or cyclical high o
            CBT Quantum Maverick Yüksek Verimli İkili Opsiyon Ticaret Sistemi CBT Quantum Maverick, hassasiyet, basitlik ve disiplinli ticaret arayan yatırımcılar için tasarlanmış yüksek performanslı bir ikili opsiyon ticaret sistemidir. Özelleştirme gerekmez—bu sistem, ilk kullanımda etkili sonuçlar için optimize edilmiştir. Sinyalleri kolayca anlamak için biraz pratik yapmak yeterlidir. Ana Özellikler: Hassas Sinyaller: Yeni mum bazlı ticaret sinyalleri—mevcut mumdan sonra gelecek mum hedeflenir ve sık
            Precision Index Osilatörü (Pi-Osc) - Precision Trading Systems'dan Roger Medcalf Sürüm 2, grafiklerinizde hızlı bir şekilde yüklenmek üzere dikkatle yeniden kodlandı ve deneyimi artırmak için bazı teknik geliştirmeler de içerdi. Pi-Osc, herkesin stoplarını almak için zorlanan pazarların gitmek zorunda kaldığı aşırı yorgunluk noktalarını bulmak için tasarlanmış doğru ticaret zamanlama sinyalleri sunmak amacıyla oluşturuldu. Bu ürün, aşırı noktaların nerede olduğunu bilmek gibi yaşlı bir sorun
            Ortalama geri dönüş ticareti için profesyonel ve nicel bir yaklaşım uygulayan benzersiz gösterge. Fiyatın tahmin edilebilir ve ölçülebilir bir şekilde ortalamaya döndüğü ve yön değiştirdiği gerçeğinden yararlanır, bu da nicel olmayan ticaret stratejilerinden büyük ölçüde daha iyi performans gösteren net giriş ve çıkış kurallarına izin verir. [ Installation Guide | Update Guide | Troubleshooting | FAQ | All Products ] Ticaret sinyallerini temizle Ticaret yapmak inanılmaz derecede kolay Özelleşt
            The   Time_Price_SQ9_Degree   indicator is based on the 9 Gann square. Using this indicator, you can identify strong time and price zones. The indicator displays the levels as a degree value. The degrees can be set in the settings. After launching, the MENU button appears. If it is highlighted, it can be moved to any point on the graph, and after double-clicking on it, it stops being highlighted and menu buttons appear. To hide the menu, just double-click on the button, it will become highlight
            IQ Gold Gann Levels a non-repainting, precision tool designed exclusively for XAUUSD/Gold intraday trading. It uses W.D. Gann’s square root method to plot real-time support and resistance levels, helping traders spot high-probability entries with confidence and clarity. William Delbert Gann (W.D. Gann) was an exceptional market analyst, whose trading technique was based on a complex blend of mathematics, geometry, astrology, and ancient mathematics which proved to be extremely accurate. Download
            AÇIKLAMA ICSM (Impulse-Correction SCOB Mapper), fiyat hareketini analiz eden ve geçerli impulsları, düzeltmeleri ve SCOB'ları (Single Candle Order Block) tanımlayan göstergedir. Esnek, bilgilendirici, kullanımı kolay olması ve tüccarın en likit ilgi alanlarına yönelik farkındalığını önemli ölçüde artırması nedeniyle her türlü teknik analizle kullanılabilen güçlü bir araçtır. AYARLAR Genel | Görsel Renk teması — ICSM'nin renk temasını tanımlar. SCOB | Görsel SCOB'u göster — SCOB'u etkinleş
            TPA True Price Action indicator reveals the true price action of the market makers through 100% non-repainting signals strictly at the close of a candle! TPA shows entries and re-entries, every time the bulls are definitely stronger than the bears and vice versa. Not to confuse with red/green candles. The shift of power gets confirmed at the earliest stage and is ONE exit strategy of several. There are available now two free parts of the TPA User Guide for our customers. The first "The Basics"
            Visual Heatmap Book Analyzer
            Alexandre Moraes De Souza Lima
            Visual Heatmap Book Analyser This indicator monitors the market liquidity and generates colors based on order patterns, quantities, and renewal activities in the book. This allows you to visualize the order flow and identify areas of high and low liquidity and activity. The indicator uses machine learning techniques to analyze the order behavior in the book, enabling it to detect patterns and trends in orders, allowing you to make informed decisions about your trading operations. The color pale
            MT4 Version SMT Divergences MT5 SMT Divergences is one of the most innovative indicators in the market. It offers the possibility of analyzing price divergences between 2 pairs. These divergences highlight and help to foresee what banks and institutions are planning to do. SMT divergences also provides you with a kill zones indicator and the possibility of filtering divergences occurring during these kill zones.  This indicator is specially powerful if applied in 2 highly correlated pairs. A pri
            Pro Thunder V10: Nihai Binomo Seçenekleri Ticaret Göstergesi! Pro Thunder V10 ile ticaretinizi bir üst seviyeye taşıyın, binomo seçenek ticaretinde zirveye ulaşın! Yapay Zeka Destekli Sinir Ağları teknolojisiyle güçlendirilen bu devrim niteliğindeki gösterge, rakipsiz hassasiyet ve güvenilirlik sunmak için tasarlandı. Gerçek zamanlı, yeniden çizilmeyen sinyallerden, piyasaların en volatil koşullarında bile kesintisiz performansa kadar Pro Thunder V10 sizin en güçlü ticaret ortağınız.
            Reversal ALGO
            Muhammad Abdullah Bhatti
            Reversal Algo – Piyasa Tersine Dönüş Analizi için Teknik Gösterge Reversal Algo, yatırımcılara piyasa trendlerindeki olası dönüş noktalarını belirlemelerine yardımcı olmak için tasarlanmış gelişmiş bir teknik göstergedir. Geçmiş fiyat verilerini titizlikle analiz ederek, piyasa momentumunun değişebileceğine işaret eden önemli zirve ve dip seviyelerini tespit eder. Bu gösterge, grafiklerde net ve belirgin görsel sinyaller sunarak trendlerin tersine dönebileceği kilit bölgeleri belirlemenize yardı
            Offer 249 down from 350 for the next 1 copies. then back to 350 $ Are you tired of using outdated indicators that leave you guessing where to set your profit targets? Look no further than the AK CAP Opening Range Breakout Indicator. This powerful tool is backed by a US patent and has already helped countless traders pass funded challenges like FTMO. We use it daily on our prop traders and internal funds, and now it's available to you as well. The calculation behind the indicator is incredibly a
            IQ FX Gann Levels a precision trading indicator based on W.D. Gann’s square root methods. It plots real-time, non-repainting support and resistance levels to help traders confidently spot intraday and scalping opportunities with high accuracy. William Delbert Gann (W.D. Gann) was an exceptional market analyst, whose trading technique was based on a complex blend of mathematics, geometry, astrology, and ancient mathematics which proved to be extremely accurate. Download the Metatrader 4 Version M
            Introduction Excessive Momentum Indicator is the momentum indicator to measure the excessive momentum directly from raw price series. Hence, this is an extended price action and pattern trading. Excessive Momentum Indicator was originally developed by Young Ho Seo. This indicator demonstrates the concept of Equilibrium Fractal Wave and Practical Application at the same time. Excessive Momentum detects the market anomaly. Excessive momentum will give us a lot of clue about potential reversal and
            PZ Trend Trading MT5
            PZ TRADING SLU
            3.8 (5)
            Capture every opportunity: your go-to indicator for profitable trend trading Trend Trading is an indicator designed to profit as much as possible from trends taking place in the market, by timing pullbacks and breakouts. It finds trading opportunities by analyzing what the price is doing during established trends. [ Installation Guide | Update Guide | Troubleshooting | FAQ | All Products ] Trade financial markets with confidence and efficiency Profit from established trends without getting whip
            Super Zone indicator
            Dmitriy Sotnikov
            5 (1)
            Super Zone   For several years of observing the principles of the market, Super Zone worked, both then and now, because the indicator  allows you to see the trading range of the  week and even the month that major market participants use. It’s very easy to use, we work on H4 in the weekly range (  in the tester it doesn’t work in the demo mode  ) - we sell from the upper zones, we buy from the lower ones. It marks the zones from the beginning of the week (month) that are  not redrawn  , works on
            Introduction! to the Indicator that Connects Trend , Pattern , and Candlestick Trigger  3 Steps in Under 30 Seconds ️ Trade effortlessly — no analysis required, Your smart assistant is ready to simplify your workflow No more chart overload Trade with confidence using smart bias detection Compatible with all currencies, crypto, stocks, metals, indices, and any timeframe Just click and execute — it’s that simple Ideal for busy traders who want speed and clarity. TPTSyncX is a powerfu
            TrendMaestro5
            Stefano Frisetti
            note: this indicator is for METATRADER4, if you want the version for METATRADER5 this is the link:  https://www.mql5.com/it/market/product/108106 TRENDMAESTRO ver 2.4 TRENDMAESTRO recognizes a new TREND in the bud, he never makes mistakes. The certainty of identifying a new TREND is priceless. DESCRIPTION TRENDMAESTRO identifies a new TREND in the bud, this indicator examines the volatility, volumes and momentum to identify the moment in which there is an explosion of one or more of these data a
            This indicator is based on the mathematics of the great trader W.D. Ganna. With its help, you can easily find strong levels by analyzing swings to find the optimal entry point. The indicator works on all instruments and all timeframes. The indicator is fully manual and has control buttons. All you need to do is press the NEW button, a segment will appear, which you can place on any movement, swing or even 1 candle that you want to analyze. By placing the segment, press the OK button. A grid (th
            Protect against whipsaws: revolutionize your swing trading approach Swing Trading is the first indicator designed to detect swings in the direction of the trend and possible reversal swings. It uses the baseline swing trading approach, widely described in trading literature. The indicator studies several price and time vectors to track the aggregate trend direction and detects situations in which the market is oversold or overbought and ready to correct. [ Installation Guide | Update Guide | Tro
            This indicator identifies and displays zones, as it were areas of strength, where the price will unfold. The indicator can work on any chart, any instrument, at any timeframe. The indicator has two modes. The indicator is equipped with a control panel with buttons for convenience and split into two modes. Manual mode: To work with manual mode, you need to press the NEW button, a segment will appear. This segment is stretched over the movement and the LVL button is pressed. The level is displayed
            Yazarın diğer ürünleri
            MR Reversal Patterns 4
            Sergey Khramchenkov
            5 (2)
            In the "Masters of Risk" trading system, one of the main concepts is related to places where markets change direction. In fact, this is a change in priority and a violation of the trend structure at the extremes of the market, where supposedly there are or would be stop-losses of "smart" participants who are outside the boundaries of the accumulation of volume. For this reason, we call them "Reversal Patterns" - places with a lot of weight for the start of a new and strong trend. Some of the imp
            MR Volume POC Levels 4
            Sergey Khramchenkov
            5 (3)
            The most crucial price level in any "Volume Profile" is the "Point of Control" . Is the price level with the highest traded volume. And mainly, is the level where the big guys start there their positions, so it's an accumulation/distribution level for smart money. The idea of the indicator arose after the "MR Volume Profile Rectangles" indicator was made. When creating the "MR Volume Profile Rectangles" indicator, we spent a lot of time comparing the volumes with those from the volume profile
            The most crucial price level in any "Volume Profile" is the "Point of Control" . Is the price level with the highest traded volume. And mainly, is the level where the big guys start there their positions, so it's an accumulation/distribution level for smart money. The idea of the indicator arose after the "MR Volume Profile Rectangles" indicator was made. When creating the "MR Volume Profile Rectangles" indicator, we spent a lot of time comparing the volumes with those from the volume profile
            A "Volume Profile" is an advanced charting indicator that displays total volume traded at every price level over a user specified time period. The main components of the volume profile are POC ( Point Of Control - the price level, at which the maximum number of contracts were executed during a selected period), VAH ( Value Area High - the highest price in the Value Area) and VAL ( Value Area Low - the lowest price in the Value Area). When we settled on the original indicator, we spent a lot of
            MR Range Breakouts 4
            Sergey Khramchenkov
            5 (1)
            " A trading range occurs when a financial instrument trades between constant high and low prices over a period of time. The upper part of the trading range of a financial instrument often provides price resistance, while the lower part of the trading range usually offers price support.  Traders can enter in the direction of a breakout or breakdown from a trading range... " This is the "Classical Theory" understanding of ranges. We have a different understanding of the nature of ranges and the
            MR Dynamic POC 4
            Sergey Khramchenkov
            The most crucial price level in any "Volume Profile" is the "Point of Control" . Is the price level with the highest traded volume. And mainly, is the level where the big guys start there their positions, so it's an accumulation/distribution level for smart money. The idea of the indicator arose after the "MR Volume Profile Rectangles" indicator was made. When creating the "MR Volume Profile Rectangles" indicator, we spent a lot of time comparing the volumes with those from the volume profile
            We publish the indicator as a useful tool in trading and call this indicator the "Swiss Army Knife" because it provides many possibilities and combinations to help understand the material on the "Masters of Risk" trading system. The indicator itself is not part of the tools used in the "Masters of Risk" trading system. The indicator consists of 3 separate multi-timeframe indicators, which in combination with each other help to reduce the "noise" of false signals. The first of the indicators are
            "Sentiments of traders" in the financial markets is a topic that has been of interest to us for a long time. In time, we could not find the right formula to define these sentiments. We went through many stages in the search for the right methodology - from taking data from external sources to calculate open positions of buyers and sellers to calculating tick volumes, but still we were not satisfied with the results. The calculation of open positions of buyers and sellers from external sources ha
            MR Range Breakouts 5
            Sergey Khramchenkov
            5 (2)
            " A trading range occurs when a financial instrument trades between constant high and low prices over a period of time. The upper part of the trading range of a financial instrument often provides price resistance, while the lower part of the trading range usually offers price support.  Traders can enter in the direction of a breakout or breakdown from a trading range... " This is the "Classical Theory" understanding of ranges. We have a different understanding of the nature of ranges and the
            A "Volume Profile" is an advanced charting indicator that displays total volume traded at every price level over a user specified time period. The main components of the volume profile are POC ( Point Of Control - the price level, at which the maximum number of contracts were executed during a selected period), VAH ( Value Area High - the highest price in the Value Area) and VAL ( Value Area Low - the lowest price in the Value Area). When we settled on the original indicator, we spent a lot of
            MR Dynamic POC 5
            Sergey Khramchenkov
            The most crucial price level in any "Volume Profile" is the "Point of Control" . Is the price level with the highest traded volume. And mainly, is the level where the big guys start there their positions, so it's an accumulation/distribution level for smart money. The idea of the indicator arose after the "MR Volume Profile Rectangles" indicator was made. When creating the "MR Volume Profile Rectangles" indicator, we spent a lot of time comparing the volumes with those from the volume profile
            We publish the indicator as a useful tool in trading and call this indicator the "Swiss Army Knife" because it provides many possibilities and combinations to help understand the material on the "Masters of Risk" trading system. The indicator itself is not part of the tools used in the "Masters of Risk" trading system. The indicator consists of 3 separate multi-timeframe indicators, which in combination with each other help to reduce the "noise" of false signals. The first of the indicators are
            "Sentiments of traders" in the financial markets is a topic that has been of interest to us for a long time. In time, we could not find the right formula to define these sentiments. We went through many stages in the search for the right methodology - from taking data from external sources to calculate open positions of buyers and sellers to calculating tick volumes, but still we were not satisfied with the results. The calculation of open positions of buyers and sellers from external sources ha
            Filtrele:
            nwh1984
            602
            nwh1984 2024.12.05 18:33 
             

            Excellent Indicator when used in conjunction with the other offered tools from the author. I have been really enjoying combining the reversal boxes with the POC levels indicator! Although I did rent all of the available indicators from this author, I find the mentioned indicators to be my favorite of the bunch when combined together.

            Sergey Khramchenkov
            2274
            Geliştiriciden yanıt Sergey Khramchenkov 2024.12.06 16:53
            Thank you!!!
            David Gaganidze
            359
            David Gaganidze 2022.06.01 07:43 
             

            отличный индикатор

            Sergey Khramchenkov
            2274
            Geliştiriciden yanıt Sergey Khramchenkov 2022.06.01 17:44
            Спасибо !!!
            İncelemeye yanıt
            Sürüm 3.1 2023.04.20
            - Fixed technical details related to the drawing of the "Structural Levels".
            Sürüm 3.0 2023.03.16
            - In the new version of the indicator, we use a formula to determine "Reversal Patterns" based on updating the extremes of the price movement.
            Sürüm 2.5 2022.10.19
            - Fixed drawing issue on Structural levels.
            Sürüm 2.4 2022.10.13
            - Added display of structural levels to Patterns.
            Sürüm 2.3 2022.09.16
            - Stop loss places added.
            Sürüm 2.2 2022.09.01
            - Faster loading of the indicator.
            Sürüm 2.1 2022.08.08
            - Fixed some technical issues.
            - It has been restored that the closing of the patterns takes place at the "Close" price of the candles.
            Sürüm 2.0 2022.01.28
            - New and improved formula for determining the patterns.
            - A new formula for determining the boundaries of the patterns.
            - From version 2.0 the patterns are closed by the price High for Sell Reversal Patterns and by the price Low for Buy Reversal Patterns. The prices of High and Low are from the candles of the selected time frame, in the indicator settings.
            - In the new version of the indicator, price data is synchronized for correct drawing of patterns. Added a timer for the time required for synchronization. You don't need to update price data. The indicator does this itself.
            Sürüm 1.31 2021.03.16
            Fixed an issue with updates and notifications Patterns.