ADR Reversal Indicator
- Göstergeler
- LEE SAMSON
- Sürüm: 1.40
- Güncellendi: 24 Eylül 2022
- Etkinleştirmeler: 10
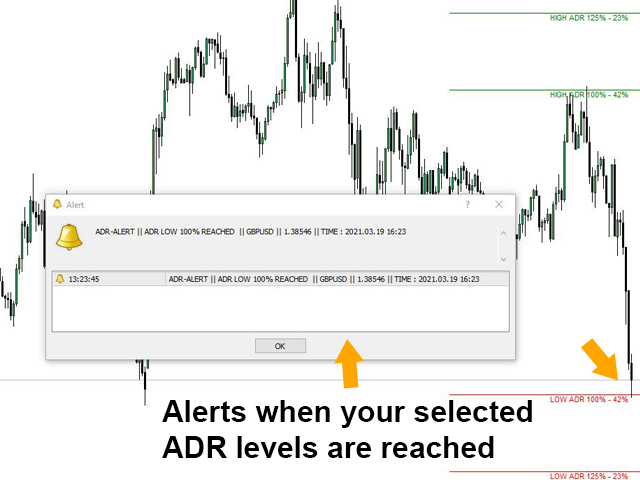
ADR Ters Çevirme Göstergesi, normal ortalama günlük aralığına göre fiyatın şu anda nerede işlem gördüğünü bir bakışta size gösterir. Fiyat, ortalama aralığı ve seçtiğiniz seviyenin üzerindeki seviyeleri aştığında, açılır pencere, e-posta veya push yoluyla anında uyarılar alacaksınız, böylece hızlı bir şekilde geri çekilmelere ve geri dönüşlere atlayabilirsiniz. Gösterge, grafikte ortalama günlük aralık uç noktalarında yatay çizgiler ve ayrıca fiyatları aşan matematiksel olasılıkları olan seviyelerin üzerindeki uzantıları çizer. Aşağıda bununla ilgili daha fazla ayrıntı ...
GÖSTERGEYİ İLGİLENDİRMEK VE TÜM ÇİFTLERİ İZLEMEK İÇİN ADR UYARI KONTROLÜ BURADA AYRICA MEVCUTTUR: https://www.mql5.com/en/market/product/62756
MT5 Sürümü burada da mevcuttur: https://www.mql5.com/en/market/product/64477/
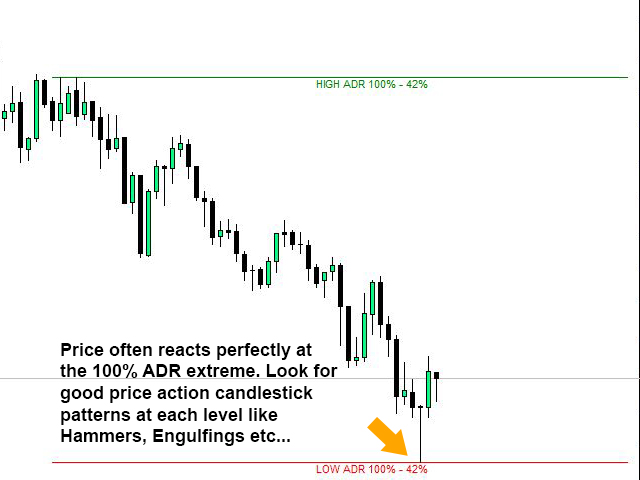
Zamanın yaklaşık %60'ı, normal ortalama günlük aralık (ADR) içinde işlem görür ve bu seviyelerin üzerindeki itmeler, genellikle, onu tipik olarak bir geri çekme (kâr alma) hareketinin izleyeceği keskin bir fiyat hareketinin bir göstergesidir. Günlük aralığın üstünden veya altından en son destek veya direnç seviyesine geri çekilme ticareti yaparak bu keskin hareketlerden yararlanabilirsiniz.
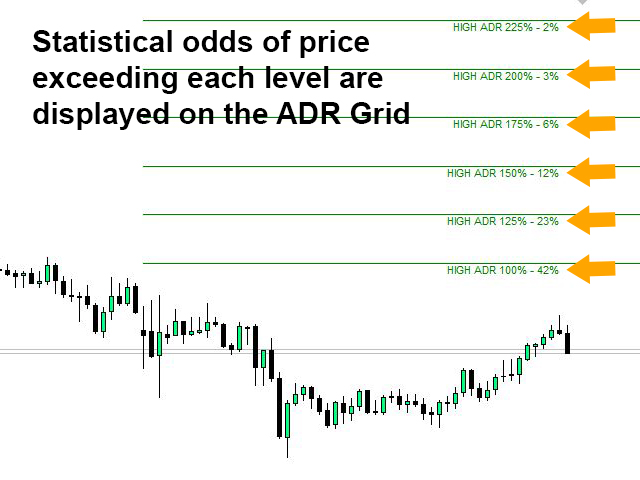
Büyük forex çiftleri ve çeşitli çaprazlar için fiyatın belirli ADR seviyelerinin ötesine geçme olasılığının ortalama yüzdesini bulmak için 20 yılı aşkın geçmiş veriler toplandı. Bu veriler, fiyatın ADR'sinin %3'ünün yalnızca %200'ünün ötesine geçtiğini, yani bu seviyede bir geri dönüş veya geri çekilme ihtimalinizin %97 olacağı anlamına geliyor!!!
Bunlar, veriler tarafından gösterilen ADR uzantısı ortalamalarıdır:
Fiyat, zamanın yaklaşık %42'sinde ADR10'un %100'ünü aştı.
Fiyat, zamanın yaklaşık %23'ünde ADR10'un %125'ini aştı.
Fiyat, zamanın yaklaşık %12'sinde ADR10'un %150'sini aştı.
Fiyat, zamanın yaklaşık %6'sında ADR10'un %175'ini aştı.
Fiyat, zamanın yaklaşık %3'ünde ADR10'un %200'ünü aştı.
Fiyat, zamanın yaklaşık %2'sinde ADR10'un %225'ini aştı.
Yukarıdaki seviyelerden de görebileceğiniz gibi, fiyat normal ADR'sinin %150'sine ulaşırsa, daha ileri gitme olasılığı sadece %12'dir ve size büyük bir avantaj sağlar. Fiyat hareketinin size o seviyede bir dönüş işaretleri göstermesini bekleyin ve geri çekilmeye başlayın!
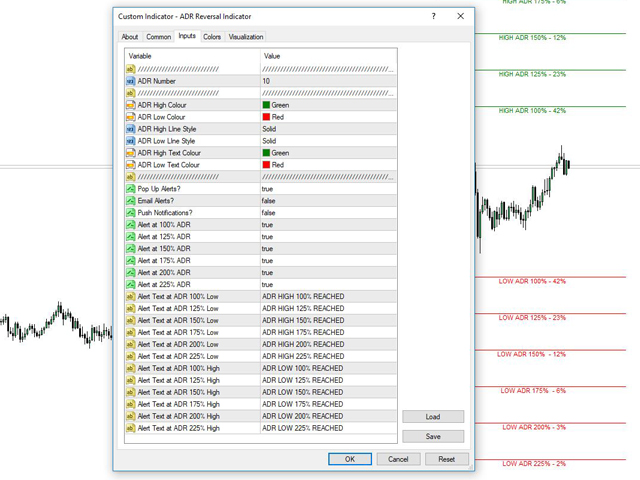
Gösterge Ayarları:
Çalışmak istediğiniz ADR numarasını seçin. NOT: Yukarıdaki istatistikler ADR10 verilerine dayanmaktadır.
ADR seviyeleri için çizgilerin renklerini ve stilini seçin.
Açılır pencerelerden, e-postalardan veya anlık uyarılardan almak istediğiniz uyarı türlerini seçin.
Yalnızca belirli ADR uç noktalarında uyarılar almak istiyorsanız, her bir düzeyi açma veya kapatma seçeneği.
Her seviye için istediğiniz uyarıların metnini seçin.
Giriş Stratejisi Fikri:
Fiyatın belirli bir seviyeye gelmesini ve uyarı almasını bekleyin. Seviye ne kadar yüksek olursa, geri alma şansı o kadar iyi olur, ancak alacağınız uyarı sayısı o kadar az olur. Bir uyarı aldığınızda, ya iyi bir fiyat hareketli mum kalıbının oluşmasını bekleyebilirsiniz (yutan, çekiç, kayan yıldız vb...) ya da EMA9 gibi sıkı bir EMA kullanmak ve atlamak isteyebilirsiniz. M5 veya M15 kullanmak için en iyi zaman dilimleri.
Bu alım satımların, ölçekleme alım satımları olması amaçlanmıştır, bu nedenle ideal olarak, bir destek veya direnç seviyesi olarak hareket etmesi muhtemel olan en son en yüksek veya en düşük seviyeleri hedef alır. Bu ADR uyarıları genellikle Londra veya NY oturumlarında gerçekleşir, bu nedenle Asya oturumunun iniş çıkışlarını hedeflemek genellikle iyi bir fikirdir.
Izgara Ticareti ADR Düzeyleri:
Birçok kişi ADR kullanarak ticaret yapıyor. Seçili ADR seviyelerinde (%100, %150, %200 vb.) küçük pozisyonlar girin ve ardından fiyat seviyelerin üzerine çıktıkça, her yeni ticaret tetiklendiğinde daha yüksek bir ortalamaya sahip bir pozisyon kazanırsınız. Bu daha sonra geri çekilmeden daha fazla kar elde edilmesine ve alınan ilk pozisyondan daha yüksek bir ortalama fiyat girişi yapılmasına izin verir.


A good Indicator. Thank you.