Market Reversal Alerts Dashboard
- Göstergeler
- LEE SAMSON
- Sürüm: 3.0
- Güncellendi: 10 Ağustos 2021
- Etkinleştirmeler: 10
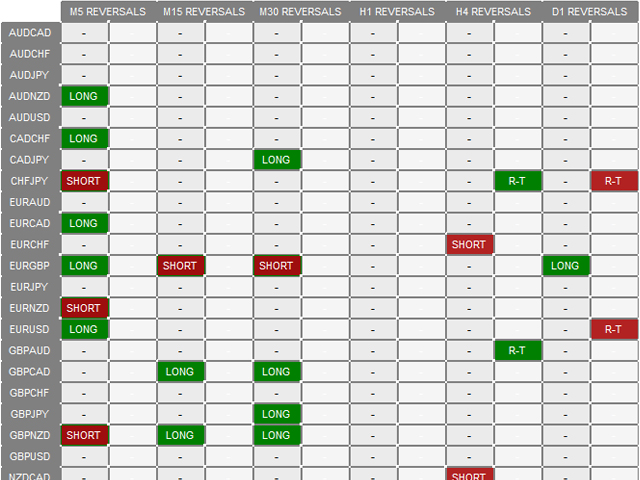
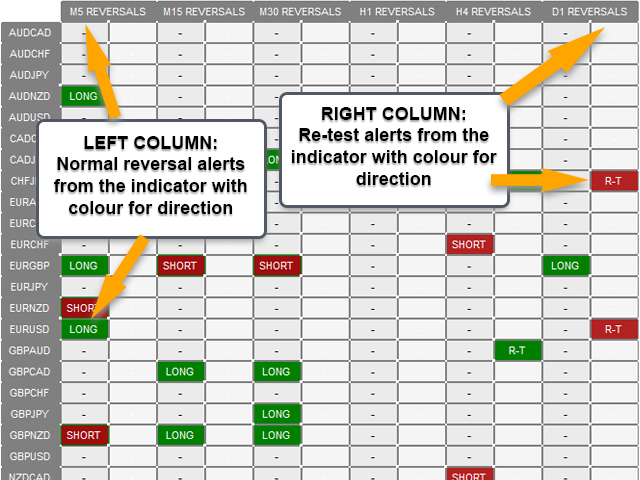
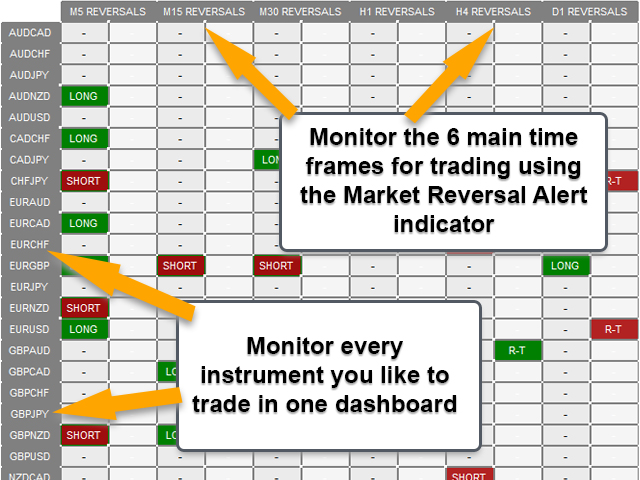
Bu gösterge panosu, piyasa yapısını tersine çevirme göstergesiyle kullanım için bir uyarı aracıdır. Birincil amacı, belirli zaman dilimlerinde geri dönüş fırsatları ve ayrıca göstergenin yaptığı gibi uyarıların yeniden test edilmesi (onay) konusunda sizi uyarmaktır. Pano, kendi başına bir grafik üzerinde oturacak ve seçtiğiniz çiftler ve zaman dilimlerinde size uyarılar göndermek için arka planda çalışacak şekilde tasarlanmıştır. Piyasa tersine çevrilme göstergesinin tek bir MT4'te birden fazla grafik üzerinde çalışması yerine, birçok kişi birden çok çifti ve zaman dilimini aynı anda izlemek için bir kısa çizgi talep ettikten sonra geliştirildi. M5, M15, M30, H1, H4 ve D1 zaman dilimlerinde uyarı verir. Daha yüksek zaman dilimleri, ticaretteki her şeyde olduğu gibi elbette en iyi sonucu verir.
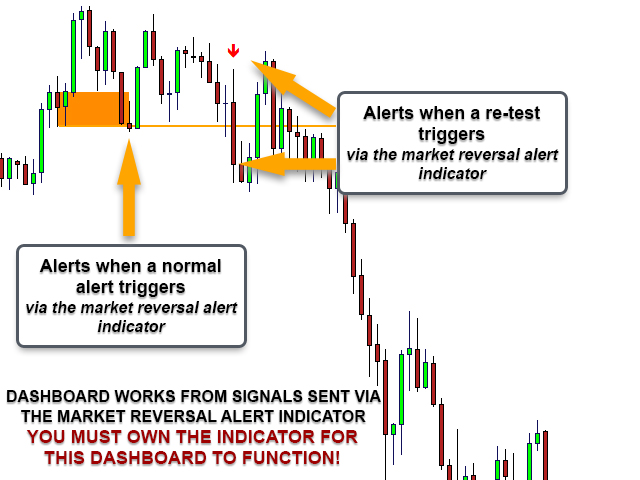
BU ÖN PANEL, PAZAR YAPISI TERSİNE DÖNÜŞ GÖSTERGESİ İÇİN EK OLARAK TASARLANMIŞTIR. PİYASA DÖNÜŞ UYARILARI GÖSTERGESİ TARAFINDAN VERİLEN DESENLERE VE SİNYALLERE GÖRE BAĞIMSIZ ÇALIŞACAKTIR.
Piyasa Ters Dönme Uyarıları göstergesini buradan alın: https://www.mql5.com/en/market/product/46295
Bu gösterge panosunun MT5 sürümü burada mevcuttur: https://www.mql5.com/en/market/product/65828
EA burada mevcuttur: Otomatik ticaret piyasası geri dönüş uyarıları! https://www.mql5.com/en/market/product/65383
Dikdörtgenleri çizmek ve belirli bir çiftteki piyasa yapısındaki değişimlere uyarı vermek için oluşturduğum gösterge, gösterge tablosunu çalıştırıyor.
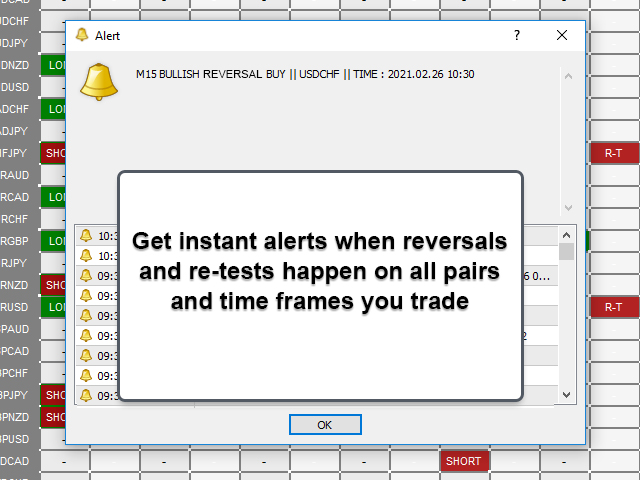
Gösterge paneli, birden fazla çifti ve zaman dilimini izlemenize ve bir grafik açıkken uyarı almanıza olanak tanır.
Gösterge Girişleri / Ayarlar:
Gösterge tablosunun boyutunu ve konumunu ayarlayın.
Gösterilecek çiftleri ve gerekirse aracı kurumunuzun son ekini veya ön ekini seçin.
Sola fitiller, agresif mod ve tekrar test mesafesi ayarları dahil olmak üzere piyasa tersine çevrilme göstergesi ince ayarı için ayarlamalar.
Hangi zaman dilimleri için uyarı almak istediğinizi seçin.
Hangi zaman dilimleri için yeniden test uyarıları almak istediğinizi seçin.
Uyarı tercihi, açılır pencere, e-posta veya push bildirimleri arasından seçim yapın.
Her uyarı için metni gerektiği gibi ayarlayın.
Piyasa Tersine Dönme Uyarısı Göstergesi Hakkında:
Piyasa yapısı, birçok tüccar tarafından bir dizi farklı strateji için yaygın olarak kullanılmaktadır. Web'de piyasa yapısı hakkında çok sayıda bilgi var, ancak temel olarak gösterge, potansiyel olarak vardiyalar meydana geldiğinde size erken uyarılar vermek için tasarlanmıştır. Gösterge, bir trende veya harekete karşıt renkteki mumların üzerine dikdörtgenler çizer. Bu mumlar, fiyat karşı yönde yukarı/aşağı kapanana kadar bir yönde sürekli bir hareketi destekleme eğilimindedir.
Bu nedenle, göstergenin temel dayanağı, bir aşağı hareketten sonra bir uyarı aldığınızda, bir dip oluşmuş ve piyasa yapısında bir değişiklik meydana gelmek üzeredir (geri dönüş/geri çekilme - kısa veya uzun vadeli). Tabii ki her uyarı çalışmayacak ve fiyat aynı yönde devam ederse (bu durumda aşağı) ve en son en düşük seviyenin altında kapanırsa, gösterge uyarıyı grafikten kaldırır ve yeni yapıda çizim yapmaya devam eder.


BEST INDICATOR EVER!!! It really fits muy needs!! It gaves me just what I want in teh entire Market!! Congrats!!! Amazing Job!!!!