RedYGreen2
- Göstergeler
- Lin Luo
- Sürüm: 2.0
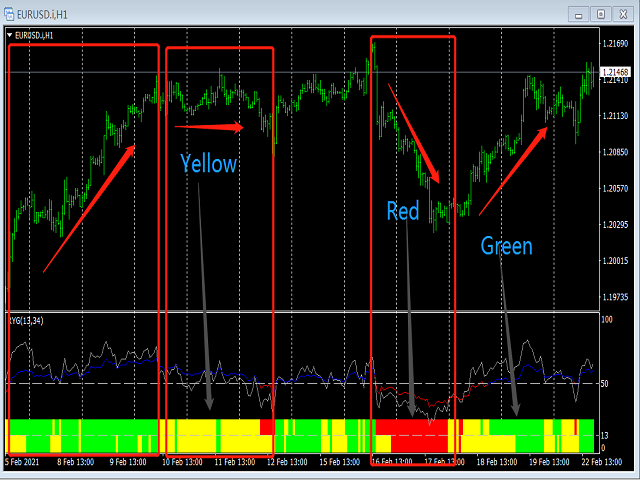
红黄绿简明指示趋势与震荡指标升级版。
使用红黄绿三色来标示上升趋势 、震荡、下跌趋势。
红色表示空头趋势(下跌)。
绿色表示多头趋势(上涨)。
黄色表示震荡区域。
从黄色转变为红色时,行情可能从震荡转变为下跌趋势。一段连续的红色,说明下跌趋势很强。
从黄色转变为绿色时,行情可能从震荡转变为上升趋势。一段连续的绿色,说明上升趋势很强。
指标的上半部分区域和下半部分区域若同步为红色,表明下跌趋势已经形成共振,接下来大概率走出一段空头趋势。
同时,红绿黄分为上下两部分:
若上下部分同时为绿色,表明上涨趋势已经形成共振,接下来大概率走出一段多头趋势。
若上下部分同时为红色,表明下跌趋势已经形成共振,接下来大概率走出一段空头趋势。
若上下同时为黄色,表明当前行情为震荡。
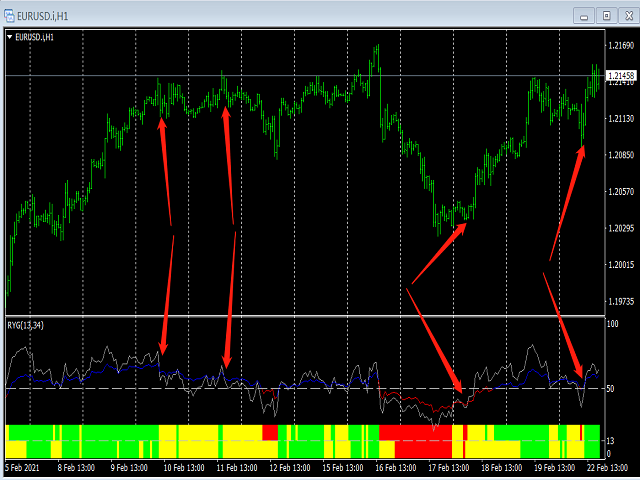
升级版2.0:
新增两条快慢线。
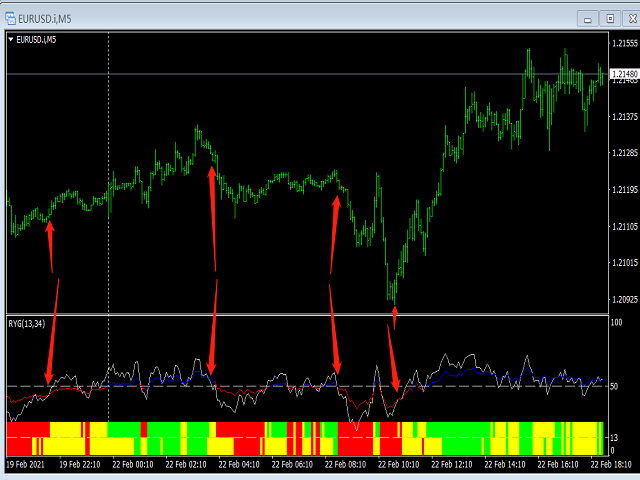
当慢线(Blue/Red线)为蓝色时,视为多头行情。当慢线为红色时,视为空头行情。
当快线(DarkGray线)从下方向上穿过慢线时,作为参考做多信号,激进交易者可进场做多。反之亦然。
参数可调。
//+-------------------------------------------------------------------------------------------+
特别提示
市场行情是不确定的,任何指标都是根据行情价格的演变而来,不保证使用此指标的盈利性。