AIS Cauchy Distribution Levels MT4
- Göstergeler
- Aleksej Poljakov
- Sürüm: 1.5
- Güncellendi: 7 Nisan 2021
- Etkinleştirmeler: 5
The Cauchy distribution is a classic example of a fat-tailed distribution. Thick tails indicate that the probability of a random variable deviating from the central trend is very high. So, for a normal distribution, the deviation of a random variable from its mathematical expectation by 3 or more standard deviations is extremely rare (the 3 sigma rule), and for the Cauchy distribution, deviations from the center can be arbitrarily large. This property can be used to simulate price changes in the market. Thus, the Cauchy distribution can filter out large and sharp price movements caused by unexpected and / or unpredictable factors.
The indicator allows you to select the price to use. And its indicator operation is configured using the following parameters:
- iPeriod - the number of bars for calculation
- PercentLvl 1-3 - deviation of levels in percent, allowable values are greater than 0 and less than 100 (by default - 50, 20 and 10 percent)
- Shift - level continuation to the right
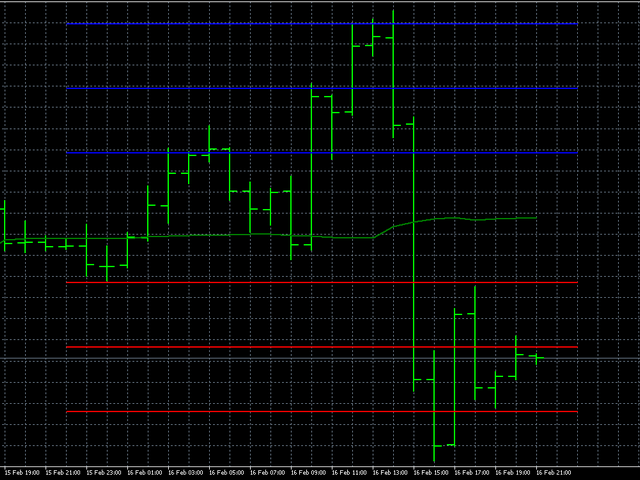
The use of this indicator in trading is based on the assumption that the price, after crossing the highest or lowest level, is likely to return to the average value. That is, Buy trades should be opened if the price crossed the lower 10% level, and Sell trades should be opened if the price rose above the upper 10% level (Figure 1).
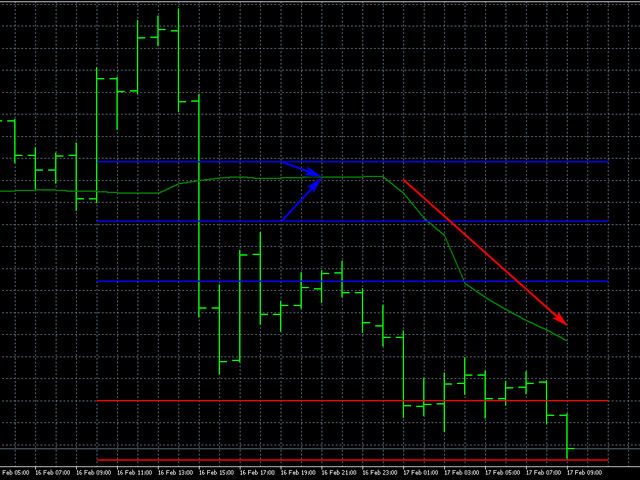
Also, using this indicator, you can judge the phases of the trend. To do this, you need to assess the levels within which the past readings of the indicator are (Figure 2).
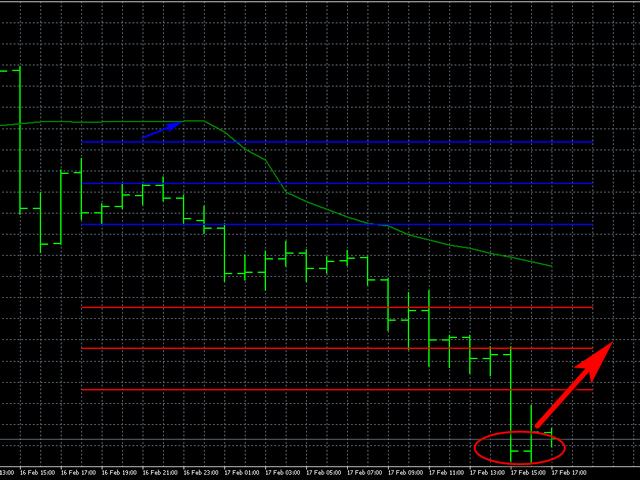
In particular, it is possible to determine the moment of the trend change (Figures 3-4).
Of course, the levels can be adjusted one way or the other to improve the quality of the signals, and the other to improve the quality of the signals.


