Trend Momentum MA
- Göstergeler
- Flavio Javier Jarabeck
- Sürüm: 1.1
- Güncellendi: 27 Mart 2021
- Etkinleştirmeler: 20
Imagine a simple and powerful line that gives you everything you need: Trend and Momentum.
Welcome to the Trend Momentum Moving Average!
Visually it seems like a very simple Moving average, but in fact it is a VIDYA (Variable/Volatility Index Dynamic Average) type of moving average - originally created by Tushar Chande - and the main purpose of this special Moving Average is to understand and interpret the current volatility of the market and apply it as a smoothing factor for a traditional Exponential Moving Average.
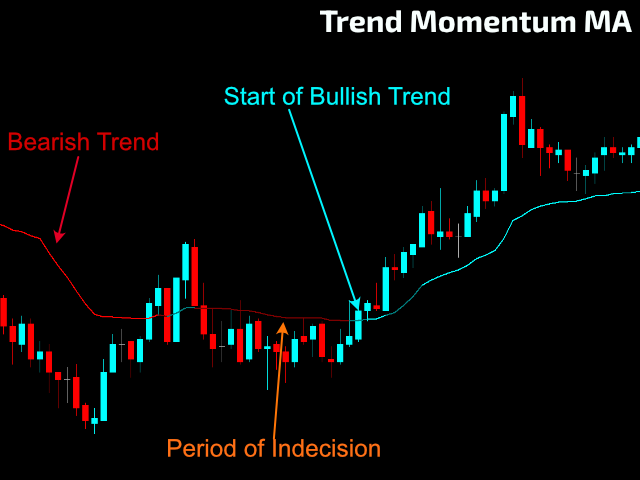
The VIDYA itself is very useful for trend sentiment, but we at Minions Labs added a Momentum state into it in the form of colors right into the Moving Average itself. So will have a Tend indicator with a coloring system that shows you the current Momentum of the market. The idea is not ours, but we couldn't backtrack the origin of it, but we can find this type of indicator in famous platforms like ThinkOrSwim and TradingView, so we decided to code it for you, fan of Metatrader 5.
HOW TO "READ" THIS INDICATOR
- The VIDYA moving average will give you the general sentiment of the market when prices are above or below it. As with all indicators, you need to calibrate the Trend Momentum MA to your liking (i.e. Symbol, Timeframe and your strategy).
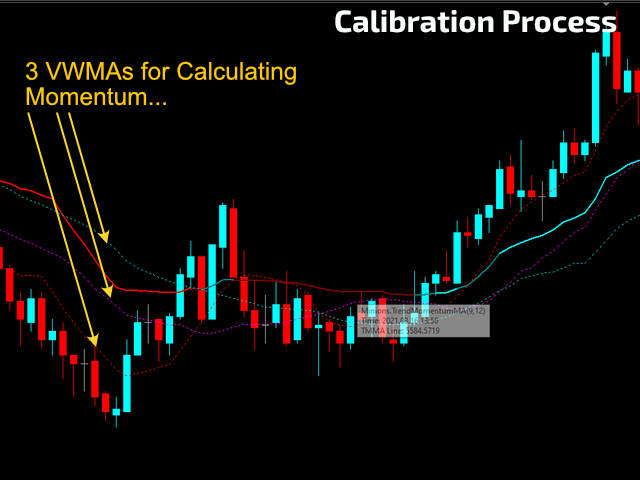
- The Momentum part of this indicator will show you, through a series of 3 Variable Weight Moving Averages (VWMA), the current situation of the market. So they will color the VIDYA line accordingly.
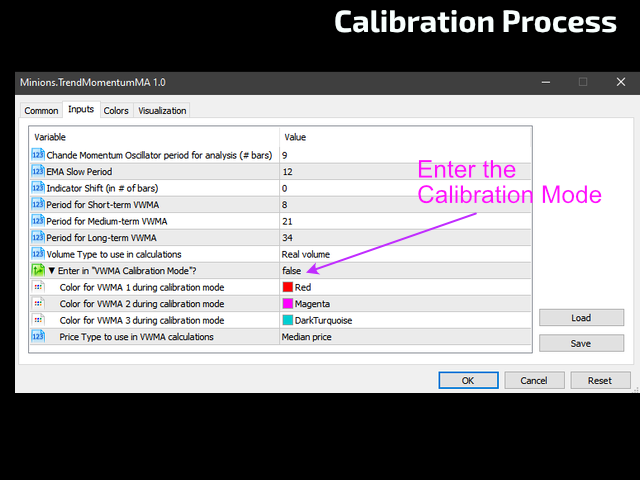
- In order to make the calibration of Momentum reading easy, we added a "Calibration Mode" inside the indicator, showing where in the Chart the VWMAs are being plotted.
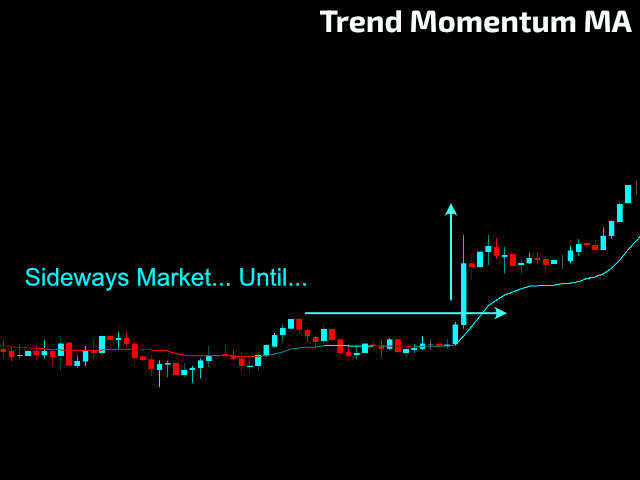
- The Momentum "colors" will show you the temporary Bullish and Bearish periods happening in your chart. Light colors represent in general periods of indecision (accumulation/distribution) and strong colors represent the Bullish and Bearish Momentum.
SETTINGS
- Chande Momentum Oscillator Period for Analysis
- EMA Slow Period
- Shift period
- Period for the Short-term VWMA
- Period for the Medium-term VWMA
- Period for the Long-term VWMA
- Volume Type for the Analysis (Real Volume or Ticks Volume)
- Enter in "Calibration Mode"?
- VWMA Colors during the Calibration Mode.
- Price Type to use in the VWMAs.
Do you want to try it for yourself, live into your assets? Download the DEMO version here: Trend Momentum MA DEMO
* Due to the new MQL5 policy developers cannot provide DEMO versions to the general public here in this website anymore.
Buffers to use on your EA:
#0 - VIDYA buffer data
#1 - VIDYA colors - #0-No Trend / #1-Slightly Bullish/Accumulation / #2-BULLISH / #3-Slightly Bearish/Distribution / #4-BEARISH
#2 - VWMA #1 data
#3 - VWMA #2 data
#4 - VWMA #3 data
Didn't Find a Feature You Need?
No product is perfect for everyone. If you think you need a missing feature from our product just send us a message. We love feedback!
