Market Watch Panel MT4
- Yardımcı programlar
- Dmitriy Skub
- Sürüm: 1.13
- Güncellendi: 14 Ekim 2021
- Etkinleştirmeler: 5
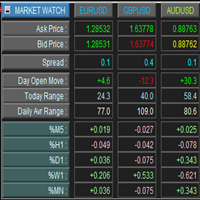
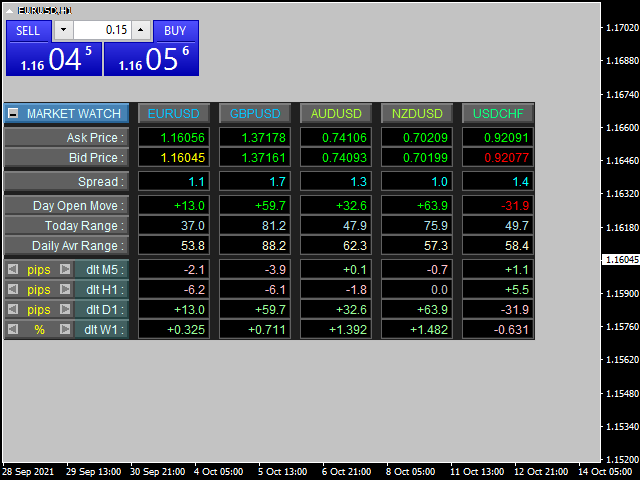
This is a panel for market review and evaluation of multicurrency price movements. It shows main parameters for a user defined group of symbols in the form of a table. The following values are displayed:
- Symbol name;
- Ask price value;
- Bid price value;
- Spread size in pips;
- Stop level in pips - may be hidden by a user;
- Change of price in pips comparing to the day start;
- Current daily range (High - Low) in pips;
- Average daily range in pips for user defined number of days;
- Price change percentage during the specified time periods (timeframes).
Parameters
- Common Title - text displayed next to the panel minimization button. Its only purpose is to specify its name.
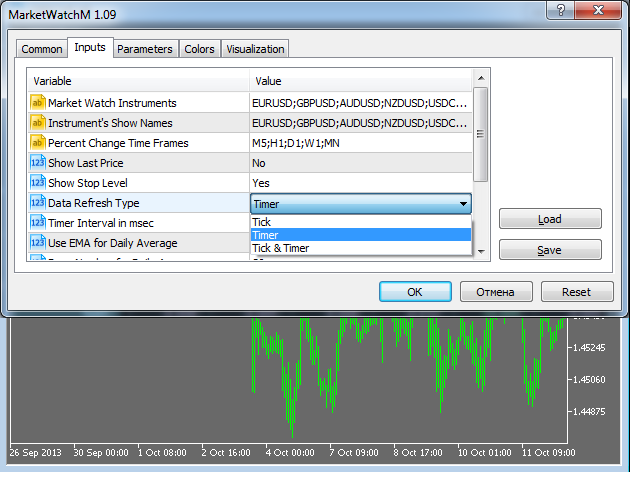
- Market Watch Instruments - the list of work instrument names. The names of the instrument must be separated with a comma. For example, EURUSD;GBPUSD.
- Instrument's Show Names - the list of the instrument names that should be displayed in the screen. You can use a custom name for an instrument as its original name can be too long and contain unnecessary information. The names of the instruments must be separated with a comma, and their position must match the position of the corresponding work instruments.
- Percent Change Time Frames - the list of periods (timeframes) the price change percentage is displayed for. It must be separated with a semicolon. For example, M5;H1;D1;W1 will display the percentage change for four timeframes (5 minute, hourly, daily and monthly). Price change is calculated as 100 * (Close - Open) / Open.
- Show Stop Level - show/hide the stops level. The notion of a stop level is not common for exchange symbols. Also, some modern dealing centers do not use this notion any more.
- Data Refresh Type - mode of updating the information on the screen. The following modes are available - Tick / Timer / Tick & Timer. In Tick & Timer mode, the information is updated at every tick of the instrument and according to a set time interval.
- Timer Interval in msec - the time interval for updating the information according to the timer (if selected in the previous parameter).
- Use EMA for Daily Average - use EMA average when calculating the average daily range. If set to No, the simple averaging will be used.
- Days Number for Daily Average - number of days for calculating the average daily range. Usually, it is set to 20 days, which approximately corresponds to one work month.
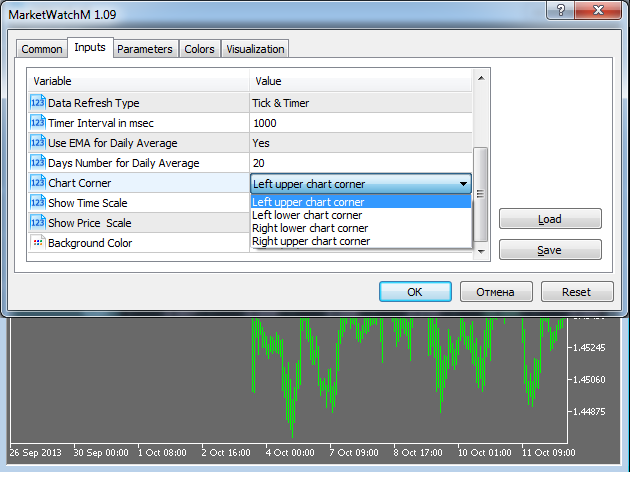
- Chart Corner - chart corner the panel will be located at (binding to the selected corner).
- Show Time Scale - show/hide the time scale on the current chart.
- Show Price Scale - show/hide price scale on the current chart.
- Background Color - background color for the panel.
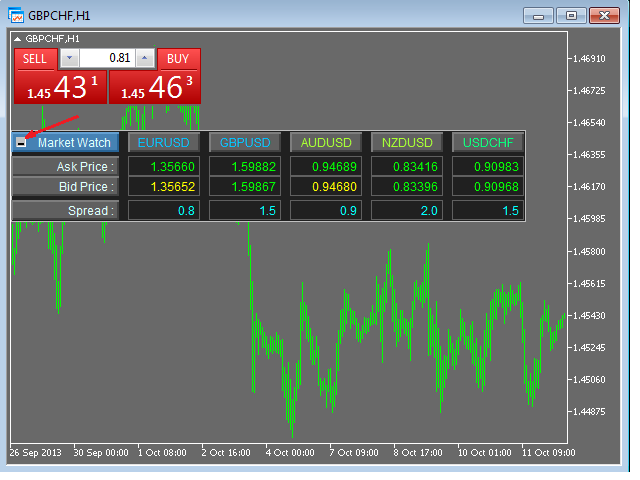
There is a button that minimizes the information displayed. Once it is pressed, the panel will display only Ask/Bid price and current spread.
Left-click the symbol name to highlight the symbol's column background. Click again to deselect the column. Left-click the timeframe name to highlight the timeframe's line background. Click again to deselect the line. This allows you to quickly find the appropriate symbol (timeframe), especially when you have many symbols set for display.
Below is the offer for active users and all of you who has read to this line. :)
If you have any interesting ideas for improving this or any other product I offer, then you'll get a big discount for my products if the idea is realized.
Please write all your suggestions in the Comments tab, so we can have a documentary proof of the ideas and see who the first author is.
