Japanese Candle Patterns
- Göstergeler
- Kristmundur Roman Zakharii
- Sürüm: 1.0
- Etkinleştirmeler: 20
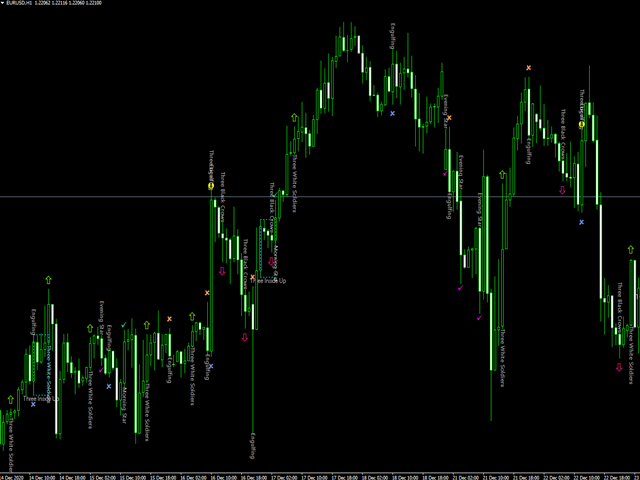
This indicator (translated from the Japanese source) automatically identifies authentic Japanese candlepatterns (Japanese Sakata Gohou rules) and displays with arrows the following Japanese candlestick patterns:
BEARISH AND BULLISH ENGULFING CANDLES (known as Tsutsumi in Japanese)
BULLISH THREE WHITE SOLDIERS
BEARISH THREE BLACK CROWS
BEARISH EVENING STARS
BULLISH MORNING STARS
THREE LINES
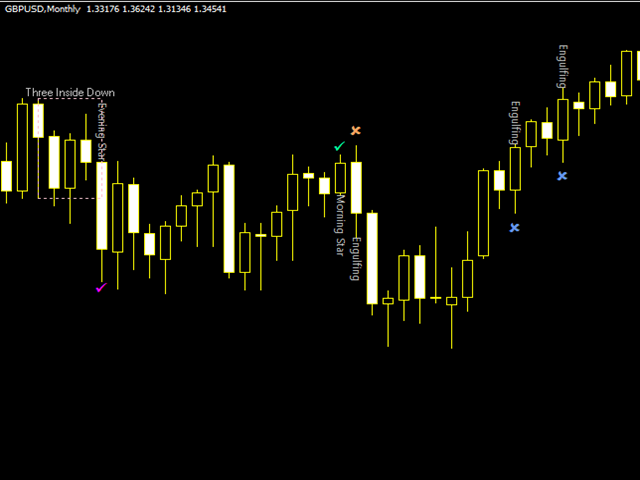
THREE INSIDE DOWN (marks with a box)
THREE INSIDE UP (marks with a box)
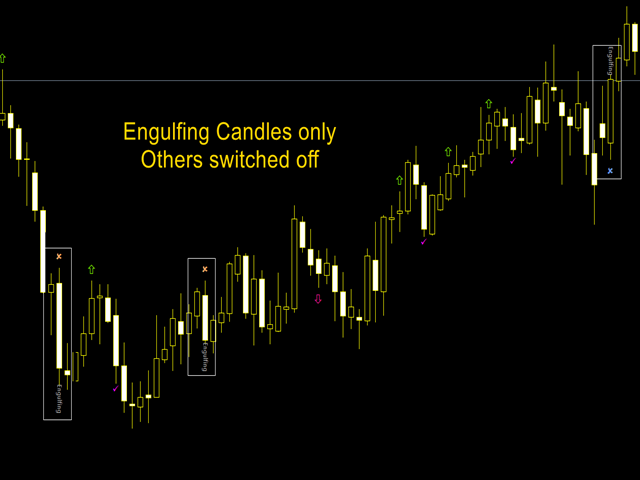
You can switch off or on to have only the desired patterns to be displayed.
For example, if you wish to have only engulfing candles you can switch off the other patterns.
Alert can be set on/off when the desired pattern forms.
Note that Bearish Englufing and Morning Star have nearly 80 percent success rate. Stops can be set at the top end of bearish engulfing / bottom end of morning star.
Target not more than 4-5 candles in the direction of a trigger pattern. Hence it is recommended to trade candle patterns on higher timeframes, preferably daily.
For example, on daily, a trade triggered by engulfing candle can last 4 days, on 4 hours - 12 hours, on 1 hour - 4 hours.I usually monitor candle patterns formed right after the NY close (when we the new daily candle just formed) or after weekly candle closes on Friday.
I watch only daily and weekly patterns before I plan new trades. A monthly pattern can also be very powerful, informing of coming multidays trends.
Ideally, newly formed pattern should align with the moving averages, Ichimoku (pullback to MA, Kijun or Kumo, MA crossover etc.) or pivot setup (for example morning star off yearly or monthly pivot).
Those can provide powerful tips in analysis, as market is heavily correlated (especially if you observe similir patterns on correlated pairs as USDXXX crosses).
Engulfing formation on daily or weekly chart is a powerful signal that can generate hundreds of pips.
It does not make sense to use candle pattern on timeframes less than 1 hour as moves will be insignificant, barely enough to cover the trade cost and the spread.
One should not trade candle patterns in consolidations though as any candle pattern is a reversal or trend continuation sign.
When using patterns with proven moving averages I recommend to use MTF (multitimeframe) moving averages of same period (higher timeframe MA that can plot on lower charts / that do not change when you flip charts).
I advise to stick to MTF 8 EMA (or VWMA) as it had been proven to be a dynamic support on any timeframe. Along with Candle patterns this is a powerful trading system by itself.
Good luck!
