Accurate Support and Resistance Tool
- Yardımcı programlar
- Riedwaan Shaheed Patel
- Sürüm: 1.0
- Etkinleştirmeler: 5
Making Charting simple!
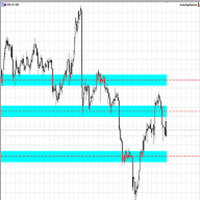
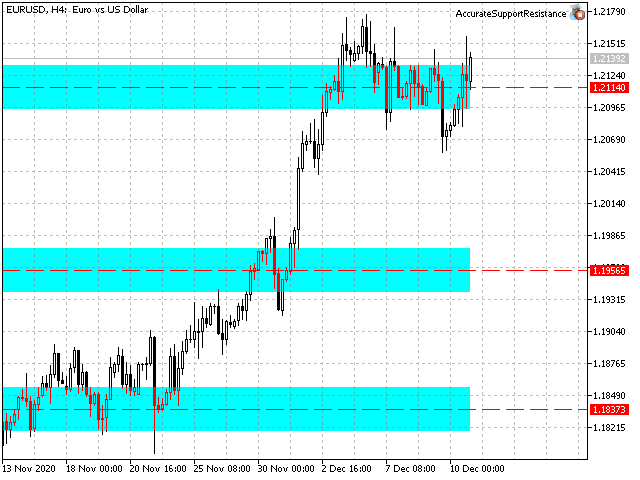
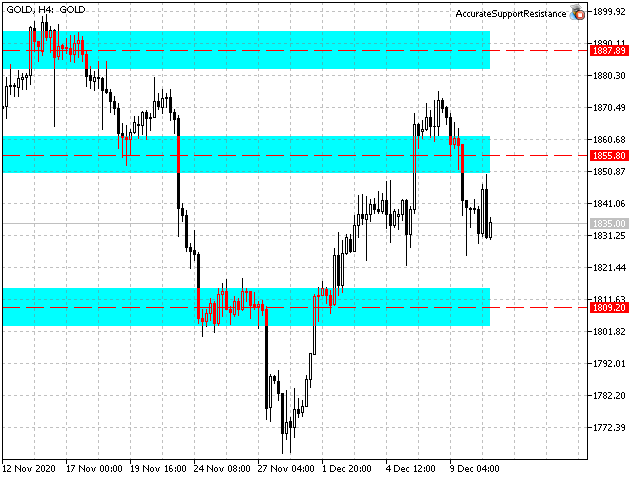
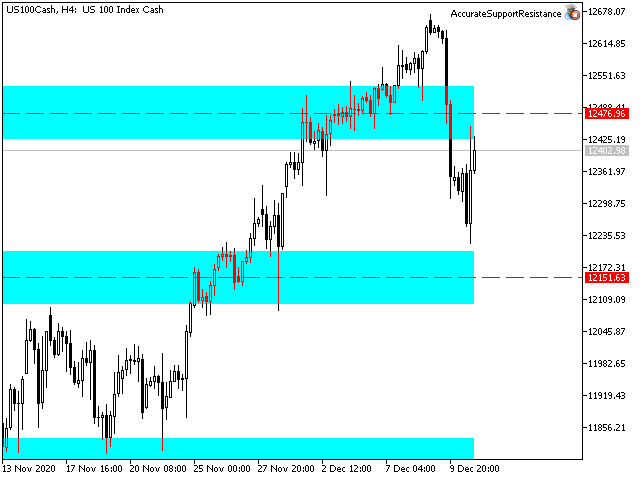
The Support/Resistance EA combines a sophisticated neural network algorithm with an Average Range computation to make your supply and demand zones easy to spot!
The EA is very easy to use and can save you valuable time when charting through financial instruments. Areas of consolidation are highlighted according to your preference and timeframe, making it easier to identify areas of break-out or small regions to scalp.
Features:
- Choose two Timeframes (From 1 Minute up to 1 Month available) and the EA will automatically chart areas of Supply/Demand
- Choose the period of each Timeframe being used
- Control the color of the Ranging region
- Variable Support/Resistance line Width and Style
- Cleans up previous Support/Resistance regions upon initialization
- Can be used on any Financial Instrument
Recommended Settings:
| Higher Timeframe | Above lower Timeframe Eg. 1 Day |
| Higher Timeframe Period | Between 30 - 60 |
| Lower Timeframe | Below higher Timeframe Eg. 4 Hours |
| Lower Timeframe Period | Atleast 50% of Higher Timeframe Period |
| Region Fill Color | Anything light Eg. Aqua |
| Object Border | Black |
| Level (Color) | Red |
| Line Style | Dash |
| Line Width | 1 |
Please feel welcome to message me with any concerns. Thank you for your support!!!!
