PrettyPriceScale
- Göstergeler
- Nikolay Kositsin
- Sürüm: 1.21
- Güncellendi: 6 Mayıs 2021
- Etkinleştirmeler: 5
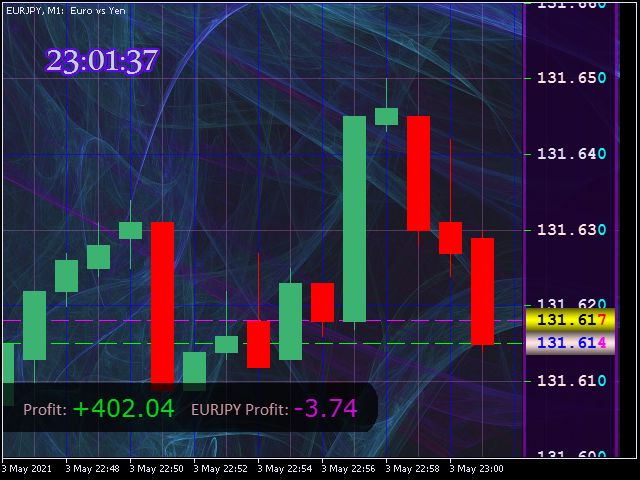
Индикатор предназначен для замены стандартной вертикальной ценовой шкалы, расположенной с правой стороны в окне графика клиентского терминала, на более удобную ценовую шкалу с возможностью детальной настройки параметров отображения этой шкалы. Кроме этого, индикатор позволяет делать фоновую заливку окна графика любым изображением по желанию пользователя и двухцветную сетку с элементами её тонкой настройки. В первую очередь, индикатор будет полезен трейдерам, обладающим не самым лучшим зрением, работающим на мониторах с большим разрешением и эстетам, обожающим максимальный зрительный комфорт при продолжительной, многочасовой работе за монитором.
Все входные параметры индикатора разбиты на десять групп:
- Настройки отображения фонового изображения графика.
- Настройки ценовой панели.
- Настройки шрифтов и текста ценовой панели.
- Параметры Bid и Ask линий на графике.
- Параметры Bid и Ask кирпичей фоновой заливки на ценовой панели.
- Параметры шрифта для отображения Bid и Ask значений на ценовой панели.
- Параметры отображения сетки на графике.
- Параметры отображения тикера серверного времени в верхнем левом углу графика.
- Параметры отображения тикера состояния торгового счёта.
- Параметр для изменения частоты обновления выводимого на график итогового изображения.
Смысл настроек волне понятен из их названий, отдельного уточнения требует входной параметр " Background picture", позволяющий загружать фоновые изображения на график. Все изображения, названия которых располагаются в выпадающем списке этого входного параметра до изображения " img_BMP_000.bmp ", и начинаются со слова " test", уже загружены в скомпилированный файл индикатора и могут быть использованы для фоновых заливок непосредственно. Изображения, начинающиеся с " img_BMP_000.bmp " и до " img_BMP_199.bmp " пользователь терминала должен загрузить сам по своему усмотрению в папку " MQL5\Images\BG ", которую следует создать. Размеры изображений, располагаемых в папке, следует делать, исходя из разрешения используемого монитора. Если размер изображения окажется меньше, чем размер графика, то то оно заполнит график в текстурно-плиточном порядке, по этой причине размеры текстурных изображений могут быть и меньше размера графика. Имена BMP файлов изображений для загрузки из папки следует выбирать из списка, предложенного выше по порядку от " img_BMP_000.bmp " и до " img_BMP_199.bmp ".
Можно редактировать, лежащие в данной папке изображения, во внешнем графическом редакторе непосредственно при работающем терминале Метатрейдера, а анализировать результат этого редактирования после его сохранения в папке проще всего, просто поменяв таймфрейм графика, на который загружено данное фоновое изображение.
Следует учесть, что в индикаторе для обновления графика используется миллисекундный таймер с частотой обновления гораздо меньшей одной секунды (1000 миллисекунд). В ситуации проверки индикатора в тестере стратегий из-за накладываемых ограничений режима тестирования эта частота обновления не может быть ниже одной секунды и в результате вполне возможны некоторые погрешности в работе индикатора в тестере.
Самые оптимальные параметры тестера стратегий:
- Период тестирования - одна минута.
- Интервал - два дня.
- Моделирование - каждый тик на основе реальных тиков.
После установки индикатора на график доступ к окну входных параметров осуществляется через контекстное меню, вызываемое по клику на правой кнопке мыши и выбору пункта меню " Список индикаторов" или по горячим клавишам " Ctrl + I".
На закладке "Обсуждение" есть ссылка на файл демонстрационной, полнофункциональной версии индикатора, которая работает по полчаса в сутки.


Мне очень нравится, как можно настраивать индикатор, но я бы хотел добавить возможность настраивать расстояние сетки, например, от 50 до 50 или от 20 до 20.