• Genel bakış
  • İncelemeler
  • Yorumlar
  • Yenilikler

CoioteWeisWave

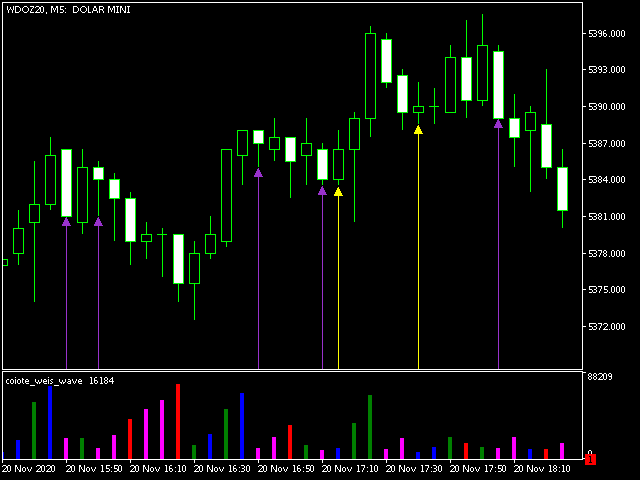
CoioteWeisWave é uma releitura do indicador de VSA WeisWave com indicação do estouro de fractal, método de analise dos TradersPiolhos e implementado originalmente pelo Trader Dario Junqueira.

A versão Coiote foi reprojetada para indicação da volatilidade do volume no fractal.

A coloração adicional (azul e magenta) dão sinais de entrada, saída e pontos de gerenciamento, podendo ser usados também como suporte e resistência.

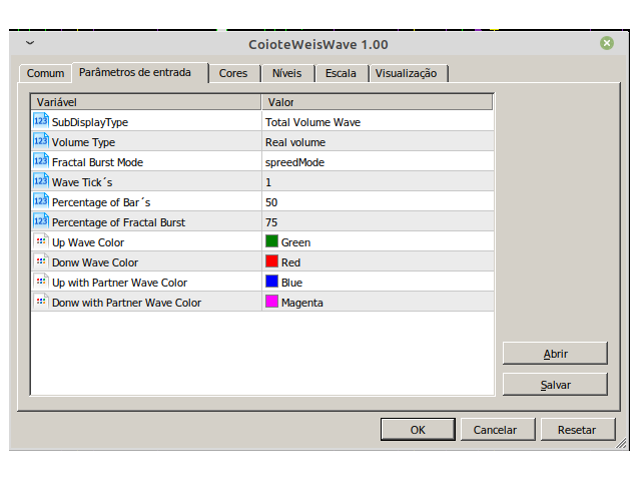
Existem 3 modos de exibição do weis wave, por volume total, por range e por média de volume (Tim Ord).
É possível definir um percentual para determinar o "estouro do fractal"
E é possível definir o método de calcula do "estouro do fractal", sendo por speed, por volume e por spreed_volume.

Além disso as configurações tradicionais de weis wave, o tipo de volume usado (real ou tick), a quantidade de ticks na onda e o percentual de barras.

Önerilen ürünler
Mean Reversion Supply Demand Indicator Mean Reversion Supply Demand is the indicator to detect the important supply demand zone in your chart. The concept of supply demand trading relies on the quantity mismatching between buying and selling volumes in the financial market. Typically, supply demand zone serves to predict the turning point. The wave pattern, for any supply demand zone to work as an successful trade, looks like the price must touch the base zone, move away and then return to zone
WAPV Weis Wave Chart Forex
Eduardo Da Costa Custodio Santos
MT5 için Weis Wave Chart Forex bir Fiyat ve Hacim göstergesidir. Fiyat ve Hacim okuması, Richard Demille Wyckoff tarafından oluşturulan üç yasaya dayalı olarak geniş çapta dağıtıldı: Arz ve Talep, Neden ve Etki ve Çabaya Karşı Sonuç. 1900'de R.Wyckoff, analizlerinde dalga grafiğini zaten kullanmıştı. Yıllar sonra, 1990 civarında, David Weis Otomatikleştirilmiş R. Wyckoff'un dalga grafiği ve bugün size David Weis'in dalga grafiğinin evrimini sunuyoruz. Varlıkta üretilen dalga ile ilgili Hacim mik
WAPV Weis Wave Chart MT5
Eduardo Da Costa Custodio Santos
MT5 için Weis Dalga Tablosu bir Fiyat ve Hacim göstergesidir. Fiyat ve Hacim okuması, Richard Demille Wyckoff tarafından oluşturulan üç yasaya dayalı olarak geniş çapta dağıtıldı: Arz ve Talep, Neden ve Etki ve Çabaya Karşı Sonuç. 1900'de R.Wyckoff, analizlerinde dalga grafiğini zaten kullanmıştı. Yıllar sonra, 1990 civarında, David Weis Otomatikleştirilmiş R. Wyckoff'un dalga grafiği ve bugün size David Weis'in dalga grafiğinin evrimini sunuyoruz. Varlıkta üretilen dalga ile ilgili Hacim miktar
BS Vwap 5 Bands
Bruno Gomes Falcao Seixas
The BS Vwap 5 Bands indicator is an advanced tool that integrates price and volume data, providing a comprehensive view of market dynamics. Designed with a focus on performance and tested under real trading conditions, this indicator aims to deliver valuable insights to traders. Its innovative approach combines VWAP with five distinct bands, revealing whether the price is aligned with the "fair price" and indicating overbought or oversold conditions. Additionally, the indicator offers visual cus
Renko Plus
Eadvisors Software Inc.
With Renko Plus you can use the features in the Indicator functionality, just add it to the Metatrader5 chart.             The Renko chart is a type of chart, developed by the Japanese, that is constructed using price movement rather than standardized prices and time intervals like most charts. It is believed to be named after the Japanese word for bricks, "renga", as the graphic looks like a series of bricks.             A new brick is created when the price moves a specified pri
Gm Vwap Point
Antonio Augusto Barreto De Melo
VWAP is an intraday calculation used primarily by algorithms and institutional traders to assess where a stock is trading in relation to its weighted average volume for the day. Day traders also use VWAP to assess market direction and filter out trading signals. This indicator is used to analyze and calculate the Vwap from a certain point on the graph, which is widely used to analyze the beginning of a movement of the price relationship with the volume. - Multi Vwaps on the same chart, placed
Keltner Channels (ou   Canais de Keltner ) é mais um indicador de   volatilidade   utilizado pela   análise técnica. Também chamado de   envelope , esse canal foi criado por Chester Keltner para monitorar os seus investimentos no mercado futuro de café na década de 1960. Porém, com o passar do tempo, passou também a ser utilizado para outros ativos e, atualmente, é uma das ferramentas mais utilizadas pelos traders. Nesta versão customizada foram adicionados novas opções de método de média movel
Weis Wave Double Side
Eduardo Da Costa Custodio Santos
MT5 için Weis Wave Bouble Yan Göstergesi, araç setinin bir parçasıdır (Wyckoff Academy Wave Market) MT5 için Weis Wave Bouble yan Göstergesi, David Weis tarafından oluşturulan halihazırda kurulmuş Weis Wave'e dayalı olarak oluşturulmuştur. Weis Wave Çift Taraflı göstergesi, piyasayı olduğu gibi dalgalar halinde okur 1900 yılında R. Wyckoff tarafından. Çaba x sonuç, neden ve sonuç ve arz ve talebi belirlemeye yardımcı olur. Diferansiyeli, sıfır ekseninin altında kullanılabilmesi ve daha da iyileş
True Weis Wave
Atila Goncalves Firmino
A version based on David Waves' description in his book 'Trade About to Happen' of his adaptation of the Wyckoff wave chart. The indicator directionally accumulates volume, adding to each brick or candle close, with color indication for up and down. it can be used it with tick or real volume, it also changes color when the accumulated value of the previous wave is exceeded, being the trade signal. Yellow color is used for doji candlestick, it will continue with accumulation without zero the sum
This indicator is an extended implementation of Weis waves. It builds Weis waves on absolute volumes (which is the classical approach) or delta of volumes (unique feature) using different methods of wave formation and visualization. It works with real volumes, if available, or with tick volumes otherwise, but also provides an option to use so called "true volume surrogates", as an artificial substitution for missing real volumes (for example, for Forex symbols), which was introduced in correspo
Functional in the Forex market. Functional in the B3 market - Bolsa Brasil Balcão. Motivation The technical indicator of Fibonacci retraction for many is essential and the basis for all forecasts of market movements. The name of the tool comes from the Italian mathematician Leonardo de Pisa (13th century). This FULL version will work in Meta Trader 5 on any type of account. This FULL version will work in Meta Trader 5 on any type of account. To test on the DEMO account, download the free ver
Optimized Trend Tracker OTT is an indicator that provides traders to find an existing trend or in another words to ser which side of the current trend we are on. We are under the effect of the uptrend in cases where the prices are above OTT , under the influence of a downward trend, when prices are below OTT it is possible to say that we are. The first parameter in the OTT indicator set by the two parameters is the period/length. OTT will be much sensitive to trend movements if it is sma
The Penta-O is a 6-point retracement harmonacci pattern which usually precedes big market movements. Penta-O patterns can expand and repaint quite a bit. To make things easier this indicator implements a twist: it waits for a donchian breakout in the right direction before signaling the trade. The end result is an otherwise repainting indicator with a very reliable trading signal. The donchian breakout period is entered as an input. [ Installation Guide | Update Guide | Troubleshooting | FAQ | A
Anchored VWAP with Alert MT5
Trade The Volume Waves Single Member P.C.
5 (1)
What is the Volume Weighted Average Price (VWAP)? The volume weighted average price (VWAP) is a trading benchmark used by traders that gives the average price an instrument has traded at throughout the day, based on both volume and price.  It is important because it provides traders with insight into both the trend and value of the instrument. What is the Difference between VWAP and AVWAP? While VWAP is having as starting point the beggining of the day,week,month etc. in the AVWAP you can pla
Special offer : ALL TOOLS , just $35 each! New tools   will be   $30   for the   first week   or the   first 3 purchases !  Trading Tools Channel on MQL5 : Join my MQL5 channel to update the latest news from me Trendlines with Breaks Scanner , traderların kritik trendleri tanımlamasına ve gerçek zamanlı olarak kırılmaları tespit etmesine yardımcı olmak için tasarlanmış son teknoloji bir ticaret aracıdır. Pivot noktalarına dayalı olarak otomatik üretilen trend çizgileri sayesinde, bu gösterge tr
Wapv Price and volume
Eduardo Da Costa Custodio Santos
MT5 için WAPV Fiyat ve Hacim Göstergesi, (Wyckoff Academy Wave Market) ve (Wyckoff Academy Fiyat ve Hacim) araç setinin bir parçasıdır. MT5 için WAPV Fiyat ve Hacim Göstergesi, grafikteki hacim hareketini sezgisel bir şekilde görselleştirmeyi kolaylaştırmak için oluşturuldu. Bununla, piyasanın profesyonel bir ilgisinin olmadığı en yüksek hacim anlarını ve anları gözlemleyebilirsiniz. Piyasanın "akıllı para" hareketiyle değil, ataletle hareket ettiği anları belirleyin. Kullanıcı tarafından değişt
Precision trading: leverage wolfe waves for accurate signals Wolfe Waves are naturally occurring trading patterns present in all financial markets and represent a fight towards an equilibrium price. These patterns can develop over short and long-term time frames and are one of the most reliable predictive reversal patterns in existence, normally preceding strong and long price movements. [ Installation Guide | Update Guide | Troubleshooting | FAQ | All Products ] Clear trading signals Amazingly
up down v6 for mt5 is no repaint all timeframe and all pairs indicator. red histogram cros trigger that is up point,and put a red point on histogram. and blue histogram cros trigger that is deep point.and put blue point on histogram. this indicator need to sometimes zoom out .for thise pres + button. if newly comes signal is too high makes before invisible.red and blue points are there.to see the signals. indicator is no repaint and can use all time frame and all pairs. only need minimum 500 bar
This is Gekko's Cutomized Cutomized Average Directional Index (ADX), a customized version of the famous ADX indicator. Use the regular ADX and take advantage two entry signals calculations and different ways of being alerted whenever there is potential entry or exit point. Inputs Period: Period for the ADX calculation; PlotSignalType: How will the indicator calculate entry (swing) signals: 1- ShowSwingsOnTrendLevel : Show Signals for Trend Confirmation Swings; 2- ShowSwingsOnTrendLevelDirection
Unlock the power of Fibonacci with our advanced indicator! This tool precisely plots Fibonacci levels based on the previous day's high and low, identifying the next day's key support and resistance levels. Perfect for day trading and swing trading, it has consistently generated weekly profits for me. Elevate your trading strategy and seize profitable opportunities with ease. NOTE: In the Input section make sure the draw labels are set to "True" so you can see each levels.
Description The indicator uses market profile theory to show the most relevant trading zones, on a daily basis. The zones to be shown are LVN (low volume nodes) and POC (point of control). An LVN zone is one which represents price areas with the least time or volume throughout the day. Typically, these areas indicate a supply or demand initiative, and in the future, they can turn into important breakout or retracement zones. A POC zone is one which represents price areas with the most time or vo
Mini Indice Composition
Thalles Nascimento De Carvalho
Mini Índice Composition: A Revolução na Análise do Mini Índice! O Mini Índice Composition é um indicador inovador que monitora em tempo real as principais ações que compõem o mini índice, trazendo uma visão quantitativa poderosa sobre o fluxo de ordens do mercado! Como Funciona? Diferente de outros indicadores que utilizam apenas dados históricos, o Mini Índice Composition faz uma leitura ao vivo das ordens que entram e saem das ações, pesando o impacto direto no mini índice. Com
Volume Waves
Paulo Henrique Faquineli Garcia
One of the best tools for analyzing volume, Weis Wave was devised by David Weis to facilitate reading the directional flow. For the disciples of the Wyckoff method, this means an evolution, facilitating a predictive reading of the market, always looking for Accumulation and Distribution zones for traded assets. For better understanding, in this indicator we try to cover every reading of EFFORT (traded volume) versus RESULT (price change). Thus, you can apply the indicator on the chart twice to
The indicator is the advanced form of the MetaTrader 4 standard Fibonacci tool. It is unique and very reasonable for serious Fibonacci traders. Key Features Drawing of Fibonacci retracement and expansion levels in a few seconds by using hotkeys. Auto adjusting of retracement levels once the market makes new highs/lows. Ability to edit/remove any retracement & expansion levels on chart. Auto snap to exact high and low of bars while plotting on chart. Getting very clear charts even though many ret
ACB Breakout Arrows MT5
KEENBASE SOFTWARE SOLUTIONS
5 (1)
The ACB Breakout Arrows indicator provides a crucial entry signal in the market by detecting a special breakout pattern. The indicator constantly scans the chart for a settling momentum in one direction and provide the accurate entry signal right before the major move. Get multi-symbol and multi-timeframe scanner from here - Scanner for ACB Breakout Arrows MT 5 Key features Stoploss   and Take Profit levels are provided by the indicator. Comes with a MTF Scanner dashboard which tracks the brea
Was: $249  Now: $149   Market Profile defines a number of day types that can help the trader to determine market behaviour. A key feature is the Value Area, representing the range of price action where 70% of trading took place. Understanding the Value Area can give traders valuable insight into market direction and establish the higher odds trade. It is an excellent addition to any system you may be using. Inspired by Jim Dalton’s book “Mind Over Markets”, this indicator is designed to suit the
Developed by Smart Trader - Smart Reversion Pattern is an indicator capable of identifying reversal patterns , both bullish reversals and bearish reversals. It is designed to provide fast, real-time awareness of patterns. We also thought about the interface part, creating a clean and pleasant look to identify formation patterns on the chart. Note: If any pattern you need is not listed, just contact us and request inclusion - we usually respond within a few hours. Bearish Reversal Patterns
Hello My Dear Friend, im introduce about Binary Option Premium V8 it work, all currency pair 1 minute time frame, 1-5 minute expire 100% non repaint, no delay signal Alright. This indicator works on MT5 and is very easy to use. When you receive a signal from it, you wait for that candle with the signal to close and you enter your trade at the beginning of the next new candle. A red arrow means sell and a green arrow means buy. for easy identification of trade signal. Are you okay with that?  W
The Market Structure Analyzer is a powerful tool designed for traders who follow market structure and smart money concepts. This comprehensive indicator provides a suite of features to assist in identifying key market levels, potential entry points, and areas of liquidity. Here's what it offers: 1. Swing High/Low Detection : Accurately identifies and marks swing highs and lows, providing a clear view of market structure. 2. Dynamic Supply and Demand Zones: Draws precise supply and demand zone
Features 3 types of waves: bullish, bearish and unknown. The unknown tower comes when prices move in opposite the direction of the current tower. Label that shows the percentage remaining for the next tower. Allows you set the type of volume that will be accumulated in the towers, either real or tick volumes. Thus, the indicator works in any market, for example: stocks, futures, forex, commodities, etc. Allows you to set the required score for the tower exchange. Allows you to set the font size
Bu ürünün alıcıları ayrıca şunları da satın alıyor
Trend Screener Pro MT5
STE S.S.COMPANY
4.85 (82)
Trend Göstergesi, Trend Alım Satım ve Filtreleme için Çığır Açan Benzersiz Çözüm, Tüm Önemli Trend Özellikleriyle Tek Bir Araç İçinde Yerleştirildi! Forex, emtialar, kripto para birimleri, endeksler ve hisse senetleri gibi tüm sembollerde/araçlarda kullanılabilen %100 yeniden boyamayan çoklu zaman çerçevesi ve Çoklu para birimi göstergesidir. Trend Screener, grafikte noktalarla ok trend sinyalleri sağlayan etkili bir trend trend göstergesidir. Trend analizörü göstergesinde bulunan özellikler: 1.
Divergence Bomber
Ihor Otkydach
5 (4)
Bu göstergeyi satın alan herkese aşağıdaki ekstra içerikler ücretsiz olarak sunulmaktadır: Her işlemi otomatik olarak yöneten, Stop Loss ve Take Profit seviyelerini ayarlayan ve işlemleri strateji kurallarına göre kapatan özel yardımcı araç: "Bomber Utility" Göstergenin farklı varlıklar üzerinde kullanılmasına yönelik ayar dosyaları (set dosyaları) Bomber Utility için 3 farklı modda kullanım sunan ayar dosyaları: "Minimum Risk", "Dengeli Risk" ve "Bekle-Gör Stratejisi" Bu ticaret stratejisini hı
Algo Pumping
Ihor Otkydach
5 (11)
PUMPING STATION – Kişisel “her şey dahil” stratejiniz Karşınızda PUMPING STATION — forex dünyasında işlem yapma şeklinizi heyecan verici ve etkili bir sürece dönüştürecek devrim niteliğinde bir gösterge. Bu sadece bir yardımcı değil, güçlü algoritmalarla donatılmış tam teşekküllü bir ticaret sistemidir ve daha istikrarlı işlem yapmanıza yardımcı olur. Bu ürünü satın aldığınızda ŞUNLARI ÜCRETSİZ olarak alırsınız: Özel ayar dosyaları: Otomatik kurulum ve maksimum performans için. Adım adım video e
Golden Trend Indicator MT5
Noha Mohamed Fathy Younes Badr
4.89 (18)
Golden Trend indicator  is The best indicator for predicting trend movement this indicator never lags and never repaints and never back paints    and give  arrow buy and sell    before the candle appear  and it will help you and  will make your trading decisions clearer its work on all currencies and  gold and crypto and all time frame This unique  indicator uses very secret algorithms to catch the  trends, so you can trade using this indicator and see the trend clear on charts  manual guide and
TPSproTREND PrO MT5
Roman Podpora
4.72 (18)
VERSION MT4        —        ИНСТРУКЦИЯ RUS           —        INSTRUCTIONS  ENG Ana işlevler: VERME OLMADAN doğru giriş sinyalleri! Bir sinyal belirirse, alakalı kalır! Bu, bir sinyal sağlayıp daha sonra onu değiştirebilen ve mevduatta fon kaybına yol açabilen yeniden çekme göstergelerinden önemli bir farktır. Artık pazara daha büyük bir olasılık ve doğrulukla girebilirsiniz. Ayrıca, ok göründükten sonra hedefe ulaşılıncaya kadar (kar al) veya bir geri dönüş sinyali görünene kadar mumları renkle
RelicusRoad Pro MT5
Relicus LLC
4.79 (19)
Şimdi 147 $ (birkaç güncellemeden sonra 499 $ 'a yükseliyor) - Sınırsız Hesaplar (PC'ler veya Mac'ler) RelicusRoad Kullanım Kılavuzu + Eğitim Videoları + Özel Discord Grubuna Erişim + VIP Durumu PİYASAYA BAKMAK İÇİN YENİ BİR YOL RelicusRoad, forex, vadeli işlemler, kripto para birimleri, hisse senetleri ve endeksler için dünyanın en güçlü ticaret göstergesidir ve yatırımcılara kârlı kalmaları için ihtiyaç duydukları tüm bilgileri ve araçları sağlar. Başlangıç ​​seviyesinden ileri seviyeye ka
Support And Resistance Screener, MetaTrader için tek bir gösterge içinde birden fazla araç sağlayan tek bir Düzey göstergesindedir. Kullanılabilir araçlar şunlardır: 1. Piyasa Yapısı Eleme Aracı. 2. Geri Çekilme Bölgesi Boğa. 3. Geri Çekilme Bölgesi Ayı. 4. Günlük Pivot Noktaları 5. haftalık Pivot Noktaları 6. aylık Pivot Puanları 7. Harmonik Modele ve hacme dayalı Güçlü Destek ve Direnç. 8. Banka Seviyesi Bölgeleri. SINIRLI SÜRELİ TEKLİF : YG Destek ve Direnç Göstergesi sadece 50 $ ve ömür boyu
Gold Stuff mt5
Vasiliy Strukov
4.93 (179)
Gold Stuff mt5, özellikle altın için tasarlanmış bir trend göstergesidir ve herhangi bir finansal enstrümanda da kullanılabilir. Gösterge yeniden çizilmez ve gecikmez. Önerilen zaman dilimi H1. Ayarları ve kişisel bir bonusu almak için satın alma işleminden hemen sonra benimle iletişime geçin!  Güçlü Destek ve Trend Tarayıcı göstergemizin ücretsiz bir kopyasını pm'den alabilirsiniz. Ben!   AYARLAR Ok Çiz - açık kapalı. grafik üzerinde oklar çizmek. Uyarılar - sesli uyarılar kapalı. E-posta b
Matrix Arrow Indicator MT5
Juvenille Emperor Limited
5 (13)
Matrix Arrow Indicator MT5 ,   forex ,   emtialar ,   kripto   para birimleri ,   endeksler ,   hisse senetleri   gibi tüm sembollerde/araçlarda kullanılabilen   %100 yeniden boyamayan   çoklu zaman çerçevesi göstergesini izleyen benzersiz bir 10'u 1 arada trenddir.  Matrix Arrow Indicator MT5 , mevcut eğilimi erken aşamalarında belirleyecek ve aşağıdakiler gibi 10'a kadar standart göstergeden bilgi ve veri toplayacaktır: Ortalama Yönlü Hareket Endeksi (ADX) Emtia Kanal Endeksi (CCI) Klasik Hei
MonetTrend — Премиум-индикатор для торговли по тренду (M30, H1, H4) MonetTrend — это мощный и визуально понятный трендовый индикатор, созданный для торговли на таймфреймах M30, H1 и H4. Он идеально подходит для работы с волатильными инструментами, такими как: • Золото (XAUUSD) • Криптовалюты (BTCUSD) • Валютные пары (EURUSD, USDJPY и др.) Ключевые особенности MonetTrend: • Автоматическое отображение Take Profit 1 (TP1) и Stop Loss (SL): После появления сигнала индикатор сразу показывает: • TP
FX Power MT5 NG
Daniel Stein
5 (15)
FX Power: Daha Akıllı Ticaret Kararları için Para Birimlerinin Gücünü Analiz Edin Genel Bakış FX Power , her piyasa koşulunda başlıca para birimlerinin ve altının gerçek gücünü anlamak için vazgeçilmez bir araçtır. Güçlü para birimlerini alıp zayıf olanları satarak, FX Power ticaret kararlarınızı basitleştirir ve yüksek olasılıklı fırsatları ortaya çıkarır. İster trendlere sadık kalın ister Delta'nın aşırı değerlerini kullanarak tersine dönüşleri öngörün, bu araç ticaret tarzınıza mükemmel bir
FX Volume MT5
Daniel Stein
4.82 (17)
FX Volume: Bir Broker’ın Perspektifinden Gerçek Piyasa Duyarlılığını Deneyimleyin Kısa Özet Trading yaklaşımınızı bir adım öteye taşımak ister misiniz? FX Volume , perakende traderlar ile brokerların nasıl konumlandığını gerçek zamanlı olarak sunar—COT gibi gecikmeli raporlardan çok daha önce. İster istikrarlı kazançları hedefliyor olun, ister piyasada daha güçlü bir avantaj arayın, FX Volume önemli dengesizlikleri belirlemenize, kırılmaları (breakout) doğrulamanıza ve risk yönetiminizi iyileş
TPSpro RFI Levels MT5
Roman Podpora
4.55 (20)
Geri dönüş bölgeleri / Tepe hacimleri / Önemli bir oyuncunun aktif bölgeleri =       TS TPSPROSİSTEMİ TALİMATLAR RUS       /       TALİMATLAR       ENG       /           Sürüm MT4        Bu göstergenin her alıcısı ayrıca ÜCRETSİZ şunları elde eder: RFI SIGNALS servisinden işlem sinyallerine 6 ay erişim - TPSproSYSTEM algoritmasına göre hazır giriş noktaları. Düzenli olarak güncellenen eğitim materyalleri - stratejiye dalın ve profesyonel seviyenizi yükseltin. Hafta içi 7/24 destek ve kapalı ya
Quantum TrendPulse
Bogdan Ion Puscasu
5 (13)
SuperTrend   ,   RSI   ve   Stochastic'in   gücünü tek bir kapsamlı göstergede birleştirerek işlem potansiyelinizi en üst düzeye çıkaran nihai işlem aracı olan   Quantum TrendPulse'u   tanıtıyoruz. Hassasiyet ve verimlilik arayan yatırımcılar için tasarlanan bu gösterge, piyasa trendlerini, momentum değişimlerini ve en uygun giriş ve çıkış noktalarını güvenle belirlemenize yardımcı olur. Temel Özellikler: SuperTrend Entegrasyonu:   Güncel piyasa trendlerini kolayca takip edin ve karlılık dalgası
FX Levels MT5
Daniel Stein
5 (4)
FX Levels: Tüm Piyasalar İçin Son Derece Hassas Destek ve Direnç Hızlı Bakış Döviz kurları, endeksler, hisseler veya emtialar gibi herhangi bir piyasada güvenilir destek ve direnç seviyeleri belirlemek mi istiyorsunuz? FX Levels geleneksel “Lighthouse” yöntemini ileri düzey bir dinamik yaklaşımla birleştirerek neredeyse evrensel bir doğruluk sağlar. Gerçek broker deneyimimize ve otomatik günlük güncellemeler ile gerçek zamanlı güncellemelerin birleşimine dayalı olarak, FX Levels size dönüş nok
*** Entry In The Zone and SMC Multi Timeframe , Smart Money Concept (SMC) temeline dayalı gerçek zamanlı bir piyasa analiz aracıdır. Bu araç, çoklu zaman dilimi yapı tespiti (Multi-Timeframe Structure Detection) ile tersine dönüş sinyallerini entegre eder ve önemli dönüş bölgelerini (POI) otomatik olarak belirler. Böylece yatırımcıların daha güvenle ve sistematik bir şekilde işlem planlaması ve karar vermesi mümkün olur. *** Özellikler: - Otomatik piyasa yapısı algılama (BOS CHoCH, mBOS mCHoCH)
MetaBands M5
Vahidreza Heidar Gholami
4.5 (2)
MetaBands uses powerful and unique algorithms to draw channels and detect trends so that it can provide traders with potential points for entering and exiting trades. It’s a channel indicator plus a powerful trend indicator. It includes different types of channels which can be merged to create new channels simply by using the input parameters. MetaBands uses all types of alerts to notify users about market events. Features Supports most of the channel algorithms Powerful trend detection algorith
MONEYTRON – ТВОЙ ЛИЧНЫЙ СИГНАЛ НА УСПЕХ! XAUUSD | AUDUSD | USDJPY | BTCUSD Поддержка таймфреймов: M5, M15, M30, H1 Почему трейдеры выбирают Moneytron? 82% успешных сделок — это не просто цифры, это результат продуманной логики, точного алгоритма и настоящей силы анализа. Автоматические сигналы на вход — не нужно гадать: когда покупать, когда продавать. 3 уровня Take Profit — ты сам выбираешь свой уровень прибыли: безопасный, уверенный или максимум. Четкий Stop Loss — контролируешь риск
Atomic Analyst MT5
Issam Kassas
4.32 (19)
Öncelikle belirtmek gerekir ki bu Ticaret Göstergesi Yeniden Çizim Yapmaz, Gecikmez ve Gecikme Göstermez, bu da hem manuel hem de robot ticareti için ideal hale getirir. Kullanıcı kılavuzu: ayarlar, girişler ve strateji. Atom Analisti, Piyasada Daha İyi Bir Avantaj Bulmak İçin Fiyatın Gücünü ve Momentumunu Kullanan PA Fiyat Hareketi Göstergesidir. Gürültüleri ve Yanlış Sinyalleri Kaldırmaya ve Ticaret Potansiyelini Artırmaya Yardımcı Olan Gelişmiş Filtrelerle Donatılmıştır. Birden fazla katmanl
Öncelikle, bu Ticaret Aracının Non-Repainting, Non-Redrawing ve Non-Lagging Gösterge olduğunu vurgulamakta fayda var, bu da onu profesyonel ticaret için ideal hale getiriyor. Çevrimiçi kurs, kullanıcı kılavuzu ve demo. Akıllı Fiyat Hareketi Kavramları Göstergesi, hem yeni hem de deneyimli tüccarlar için çok güçlü bir araçtır. İleri ticaret fikirlerini, Inner Circle Trader Analizi ve Smart Money Concepts Ticaret Stratejileri gibi 20'den fazla kullanışlı göstergeyi bir araya getirerek bir araya
CBT Quantum Maverick Yüksek Verimli İkili Opsiyon Ticaret Sistemi CBT Quantum Maverick, hassasiyet, basitlik ve disiplinli ticaret arayan yatırımcılar için tasarlanmış yüksek performanslı bir ikili opsiyon ticaret sistemidir. Özelleştirme gerekmez—bu sistem, ilk kullanımda etkili sonuçlar için optimize edilmiştir. Sinyalleri kolayca anlamak için biraz pratik yapmak yeterlidir. Ana Özellikler: Hassas Sinyaller: Yeni mum bazlı ticaret sinyalleri—mevcut mumdan sonra gelecek mum hedeflenir ve sık
Bu gösterge paneli, seçilen semboller için mevcut en son   harmonik kalıpları   gösterir, böylece zamandan tasarruf edersiniz ve daha verimli olursunuz /   MT4 sürümü . Ücretsiz Gösterge:   Basic Harmonic Pattern Gösterge sütunları Symbol :   seçilen semboller görünecektir Trend:   yükseliş veya düşüş Pattern :   desen türü (gartley, kelebek, yarasa, yengeç, köpekbalığı, cypher veya ABCD) Entry :   giriş fiyatı SL:   zararı durdur fiyatı TP1:   1. kar alma fiyatı TP2:   2. kar alma fiyatı TP
IX Power MT5
Daniel Stein
4.86 (7)
IX Power: Endeksler, Emtialar, Kripto Paralar ve Forex Piyasaları için İçgörüler Genel Bakış IX Power , endeksler, emtialar, kripto paralar ve forex sembollerinin gücünü analiz etmek için tasarlanmış çok yönlü bir araçtır. FX Power , tüm kullanılabilir döviz çiftlerinin verilerini kullanarak döviz çiftleri için maksimum doğruluk sağlarken, IX Power yalnızca temel sembolün piyasa verilerine odaklanır. Bu, IX Power 'ı forex dışındaki piyasalar için ideal ve daha basit forex analizleri için güven
FX Dynamic: Özelleştirilebilir ATR Analiziyle Volatilite ve Trendleri Takip Edin Genel Bakış FX Dynamic , ortalama gerçek aralık (ATR) hesaplamalarını kullanarak günlük ve gün içi volatilite hakkında rakipsiz bilgiler sağlayan güçlü bir araçtır. 80%, 100%, 130% gibi net volatilite eşikleri ayarlayarak, piyasa olağan hareketlerinin ötesine geçtiğinde hızlı şekilde uyarı alabilir ve potansiyel kazanç fırsatlarını süratle tespit edebilirsiniz. FX Dynamic , brokerınızın zaman dilimine uyum sağlaya
Öncelikle, bu Ticaret Göstergesi'nin yeniden çizilme, yeniden gösterim yapmama ve gecikme olmama gibi özelliklere sahip olduğunu vurgulamak önemlidir, bu da hem manuel hem de algoritmik ticaret için mükemmel hale getirir. Kullanıcı kılavuzu, ön ayarlar ve çevrimiçi destek dahildir. AI Trend Pro Max, doğruluk, güç ve sadelik arayan tüccarlar için tasarlanmış sofistike, hepsi bir arada bir ticaret sistemidir. Önceki göstergelerle yapılan yıllarca süren geliştirmelere dayanarak, şimdiye kadar geliş
Trend Forecaster
Alexey Minkov
5 (6)
The Trend Forecaster indicator utilizes a unique proprietary algorithm to determine entry points for a breakout trading strategy. The indicator identifies price clusters, analyzes price movement near levels, and provides a signal when the price breaks through a level. The Trend Forecaster indicator is suitable for all financial assets, including currencies (Forex), metals, stocks, indices, and cryptocurrencies. You can also adjust the indicator to work on any time frames, although it is recommen
Auto Order Block with break of structure based on ICT and Smart Money Concepts (SMC) Futures Break of Structure ( BoS )             Order block ( OB )            Higher time frame Order block / Point of Interest ( POI )    shown on current chart           Fair value Gap ( FVG ) / Imbalance   -  MTF      ( Multi Time Frame )    HH/LL/HL/LH  -  MTF      ( Multi Time Frame )  Choch  MTF      ( Multi Time Frame )  Volume Imbalance     ,  MTF          vIMB Gap’s Power of 3 Equal High / Low’s  
Easy Buy Sell is a market indicator for opening and closing positions. It becomes easy to track market entries with alerts. It indicates trend reversal points when a price reaches extreme values ​​and the most favorable time to enter the market. it is as effective as a Fibonacci to find a level but it uses different tools such as an algorithm based on ATR indicators and Stochastic Oscillator. You can modify these two parameters as you wish to adapt the settings to the desired period. It cannot
Special offer : ALL TOOLS , just $35 each! New tools   will be   $30   for the   first week   or the   first 3 purchases !  Trading Tools Channel on MQL5 : Join my MQL5 channel to update the latest news from me ICT’nin Inversion Fair Value Gap (IFVG) konseptinin gücünü Inversion Fair Value Gaps Indicator ile keşfedin! Bu son teknoloji araç, Fair Value Gaps (FVG) analizini bir adım öteye taşıyarak ters çevrilmiş FVG bölgelerini tanımlar ve gösterir — fiyat düzeltmesinden sonra oluşan önemli dest
Blahtech Supply Demand MT5
Blahtech Limited
4.54 (13)
Was: $299  Now: $149  Supply Demand uses previous price action to identify potential imbalances between buyers and sellers. The key is to identify the better odds zones, not just the untouched ones. Blahtech Supply Demand indicator delivers functionality previously unavailable on any trading platform. This 4-in-1 indicator not only highlights the higher probability zones using a multi-criteria strength engine, but also combines it with multi-timeframe trend analysis, previously confirmed swings
Yazarın diğer ürünleri
Visual Heatmap Book Analyzer
Alexandre Moraes De Souza Lima
Visual Heatmap Book Analyser This indicator monitors the market liquidity and generates colors based on order patterns, quantities, and renewal activities in the book. This allows you to visualize the order flow and identify areas of high and low liquidity and activity. The indicator uses machine learning techniques to analyze the order behavior in the book, enabling it to detect patterns and trends in orders, allowing you to make informed decisions about your trading operations. The color pale
MediasCoiote
Alexandre Moraes De Souza Lima
5 (1)
As médias coiote automatizam a leitura de analise de médias rápidas e lentas no saldo do volume e preço. Quando as médias estão em modo compra, a coloração do candle fica azul. Quando as médias estão em modo venda, a coloração do candle fica magenta. Quando a coloração fica verde ou vermelho, temos a tomada das médias no volume mas não no preço, quando isso ocorre é um sinal de atenção. A concepção do indicador é ser utilizado para operações em saída de consolidações na direção da tendencia do
FREE
CoioteCandlePVA
Alexandre Moraes De Souza Lima
5 (1)
Candle com coloração de Volume Price Analysis  (VPA) segundo as definições da Anna Coulling, é possível configurar períodos de  climax e rising, fator de extreme e fator de rising. Pode-se usar volume real ou volume de ticks. O VPA considera a variação de preço por volume do período, indicando se um movimento está recebendo ignição, está em seu climax ou se já não existe mais interesse.
FREE
CoioteChart
Alexandre Moraes De Souza Lima
O Indicador CoioteChart foi construído pra facilitar desde a leitura de contexto de mercado até a micro estrutura do candle, facilitando ajustes operacionais e tomadas e decisão com alta eficácia. Possui um controle para habilitar e desabilitar a visualização das pocs, vwap, zonas de máxima e mínima negociação, pode ser utilizado data sources de tempos gráficos para cálculos ou utilizado os ticks de agressão do time and trades, funciona com volume real e volume de ticks. As colorações são atrib
CoioteDeltaCandle
Alexandre Moraes De Souza Lima
O indicador precisa do times and trades (time and salles) para seu correto funcionamento. O Volume é composto por ordens à mercado compradoras e vendedoras que agrediram o book de ofertas, o Delta é a diferença das ordens a mercado compradoras e vendedoras. O CoioteDeltaCandle monitora o time and trades e à partir dos dados de agressão forma candles temporais em 4 formatos diferentes, possível selecionar à partir de configurações. São elas: Modo com acumulação. Modo com pavio. Modo inverter.
Coiote Volume Candle
Alexandre Moraes De Souza Lima
Candle de Volume Coiote O Candle de Volume  Coiote é um indicador que mede a variação do volume no tempo, seu corpo é pela variação do volume anterior pelo volume atual, sua direção pelo fechamento do preço. 1. identificado um topo no indicador Candle de Volume  Coiote (marcado o fechamento do preço). 2. identificado um fundo no indicador Candle de Volume Coiote (marcado o fechamento do preço). 3. fundo 3 igual fundo 2 no indicador Candle de Volume Coiote, preço no 3 é diferente de fundo 2. P
FREE
BopCoiote
Alexandre Moraes De Souza Lima
5 (1)
O Indicador BOPCoiote é uma releitura do indicador Balance of Power proposto por Igor Livshin em Agosto de 2001, publicado na Stocks and Commodities Magazine. Uma média móvel de 14 períodos é recomendada para gráficos diários. Embora o número de períodos possa variar dependendo da natureza do mercado e dos prazos. O nível em que ele agrupa seus fundos e topos é considerado uma das propriedades mais importantes do indicador BOP. Durante as tendências de alta, suas máximas frequentemente tocam os
Divergence Wave
Alexandre Moraes De Souza Lima
Ondas de Divergência. Antes do mercado tomar um sentido e se manter em tendencia, existem sinais que podem ser lidos, nos permitindo assim entender o "lado mas forte", e realizar trades de maior probabilidade de acerto com risco reduzido, esses movimentos são persistentes e contínuos, proporcionando excelente rentabilidade. Ondas de Divergência é um histograma que acumula a divergência de  entre preço e volume a cada tick, permitindo assim encontrar pontos de absorção, áreas de acumulo e distrib
CoioteTarget
Alexandre Moraes De Souza Lima
Projeção de alvos harmônicos com dois cliques, os alvos possuem melhor qualidade quando ancorados em candles climáticos, seja de ignição ou exaustão ou em pivôs de alto volume. Funciona com qualquer ativo (volume real e volume tick), em qualquer tempo gráfico, ações, indicies, futuros, forex, criptomoedas, commodities, energia, mineiro e qualquer outro. As projeções devem respeitar os princípios de confluência e simetria, portanto não devem ser utilizados unicamente como critério de decisão, seu
CoioteTradeDetector
Alexandre Moraes De Souza Lima
O CoioteTradeDetector monitora o time and trades (time and salles), é possível criar filtros de alerta gráficos (plotagem de linha com qtd) com variações de agressões pré-definidas. É possível monitorar grandes lotes, ordens diretas e alta frequência de trades. Para perfeito funcionamento do produto é preciso ter os dados de agressão da corretora (acesso completo ao times and trades).
CoioteAverageSpreed
Alexandre Moraes De Souza Lima
O indicador CoioteAverageSpreed é uma releitura do indicador AverageSpreed. Ele mostra a relação de esforço x resultado entre o volume e a volatilidade do preço. Com o volume heatmap é possível identificar visualmente se o preço foi deslocado com uma quantidade maior de volume e se o deslocamento do preço apresentou maior resultado ou não. É possível identificar momentos de ignição e exaustão do movimento, além de injeções de fluxo para dar continuidade a um movimento.
Coiote Book Balance
Alexandre Moraes De Souza Lima
Coiote Book Balance é um indicador que monitora o livro de ofertas e indica de maneira simplificada o níveis de renovação de ordens agrupados no timeframe gáfico, mostrando quanto o maior lado renovou e a diferença dessas renovações. Além disso, é possível visualizar em quais preços estão as maiores ordens da cada lado, o preço teórico dessa liquidez e a quantidade de lotes em tempo real. Para correto funcionamento do indicador é preciso que o livro de ofertas seja aberto antes da inclusão do in
OrderFlowMomentun
Alexandre Moraes De Souza Lima
order flow indicator that monitors price formation effectively identifying market direction. As it is an extremely fast indicator, it should be used in support and resistance, static and dynamic regions, the OrderFlowWay will predictively indicate the veracity of breakouts that have not happened yet, showing whether there is action by big players in the traded price. Operations must be carried out after crossing the lines, preferably close to the zero axis of the indicator.
CoioteOscilator
Alexandre Moraes De Souza Lima
CoioteOscilator é um rastreador de tendência e padrões de estruturas gráficas. O Indicador é composto de 3 elementos. oscilador principal lento: histograma com nível de 0 até 50 e 4 cores, 2 compradoras, de 0 até 30 e acima de 30 e duas vendedoras, de 0 até 30 e acima de 30.   oscilador principal  rápido: linha magenta com nível de -50 até 50. gatilho:  linha amarela com nível de -50 até 50. O  oscilador principal lento  é um rastreador de tendência primaria. O  oscilador   principal  rápido é u
Filtrele:
İnceleme yok
İncelemeye yanıt
Sürüm 2.0 2020.11.24
add auto suporte e resistência.