Sup Trend
- Göstergeler
- Vitalii Zakharuk
- Sürüm: 1.1
- Etkinleştirmeler: 5
The algorithm of the Sup Trend indicator is to determine the dominant direction of price movement by
algorithmic analysis of price values for a certain period of time. When calculating this indicator, logorithmic gains are first calculated at the closing price, which allows you to filter out the trend, seasonality and other inclusions that spoil the picture of volatility, then the standard deviation is plotted based on the data obtained. The algorithm takes into account the measurement of prices, and this method also focuses on the measurement of each of the price drops - which gives more detailed information.
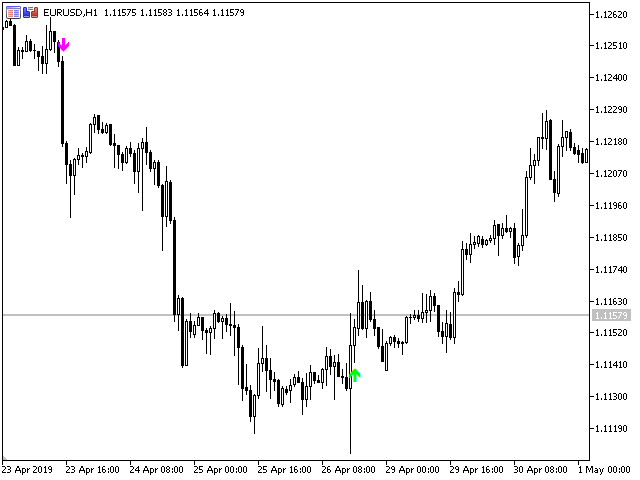
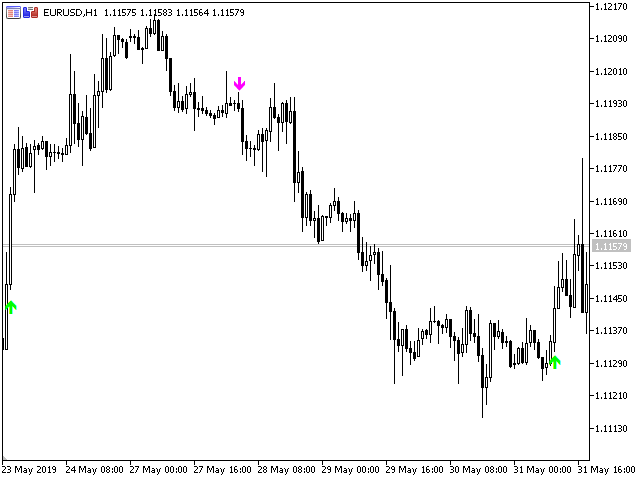
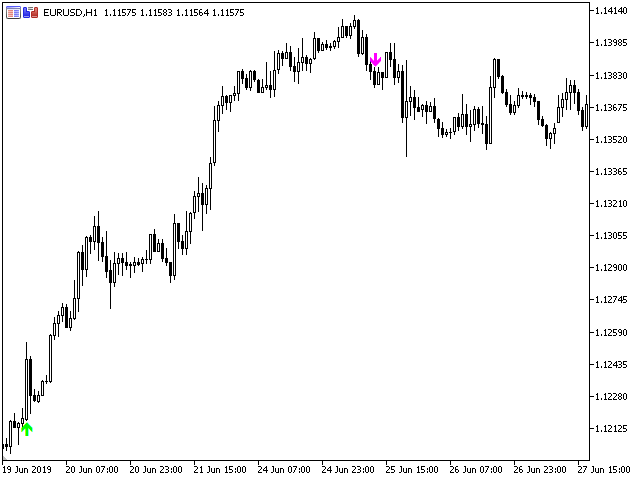
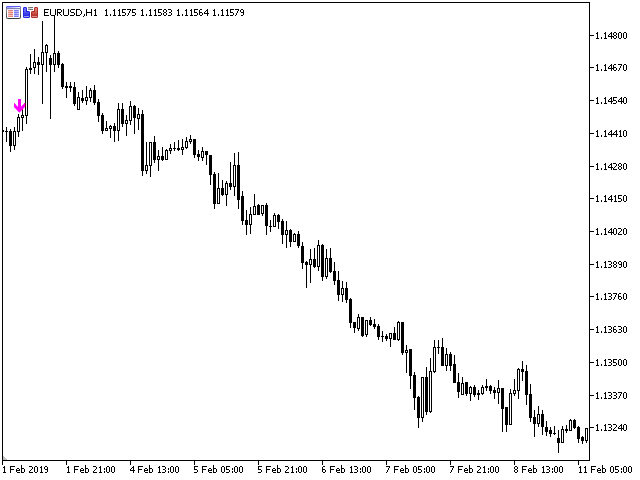
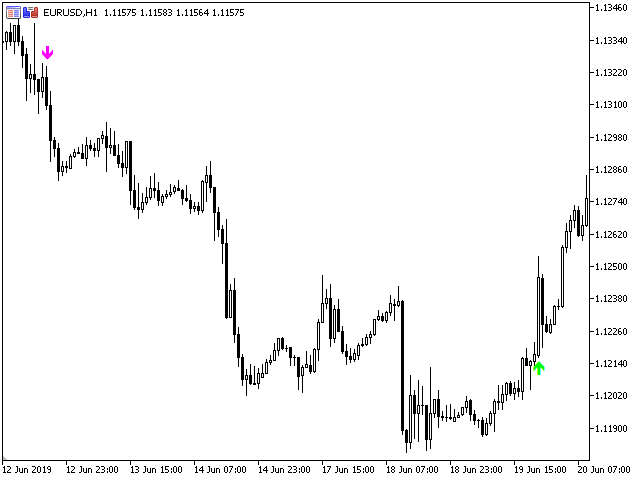
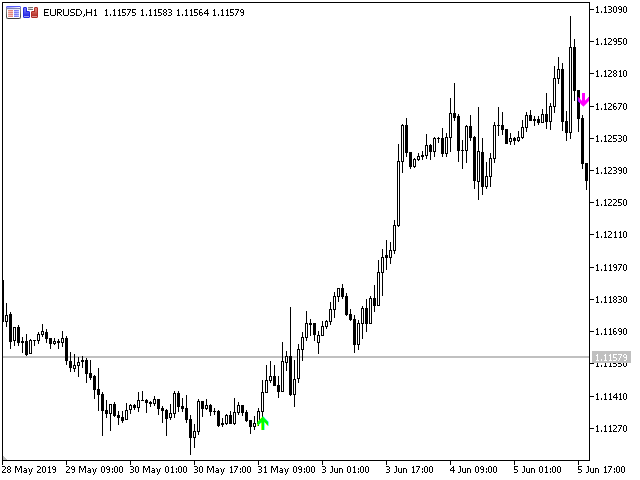
This indicator gives you a guide to action based on the price trend movement it has identified. The indicator plots a price movement chart and displays the trend in the form of arrows. The indicator signals the trader about the possibility of an imminent trend reversal or a price correction and its return to the trend corridor. It is very easy to use the Sup Trend indicator as the easiest way is to look at the chart and act according to the indications of the colored arrows. First of all, you need to remember that it is best to use several indicators at once to reduce your risks and only in this way you will be able to get a more accurate picture of the market.
Sup Trend indicator parameters:
- Length - The number of bars to calculate the correction point.
- Trend - The number of bars to calculate the global trend.
