Volume HeatMap DEMO
- Göstergeler
- Hawllysson Gardel Queiroz Almeida
- Sürüm: 1.3
- Güncellendi: 16 Kasım 2020
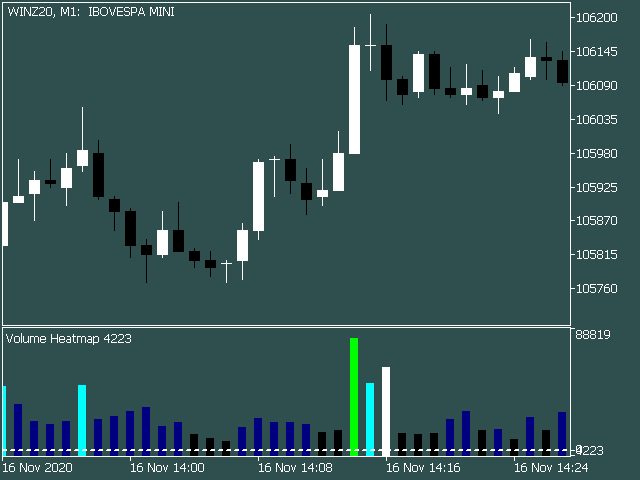
The Volume Heatmap indicator visually shows the INTENSITY of the volume taking into account the concept of standard deviation.
Purpose of the Indicator:
High volumes are common where there is a strong consensus that prices will increase. An increase in volume often occurs at the beginning of a new upward trend in the price of an asset. Some technical analysts do not rely on trend confirmations without a significant increase in volume. Low volumes usually occur when an asset is heading for a downward trend. They are characterized by indefinite expectations that occur in periods of consolidation. In this way, you can have the exact idea of the intensity of the current volume compared to past volumes and act according to your strategy, having even more confidence in your trades.
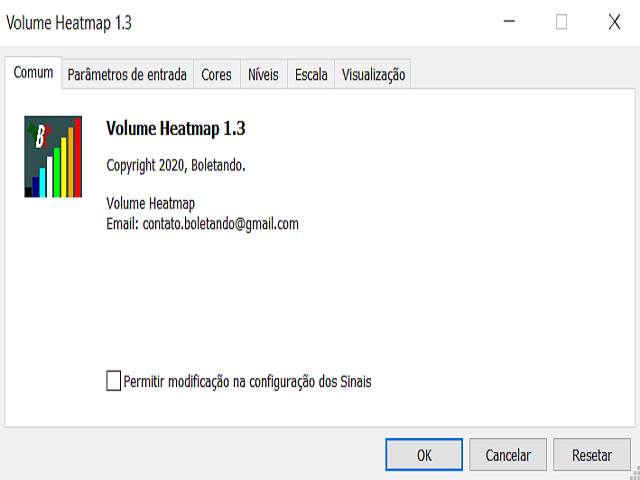
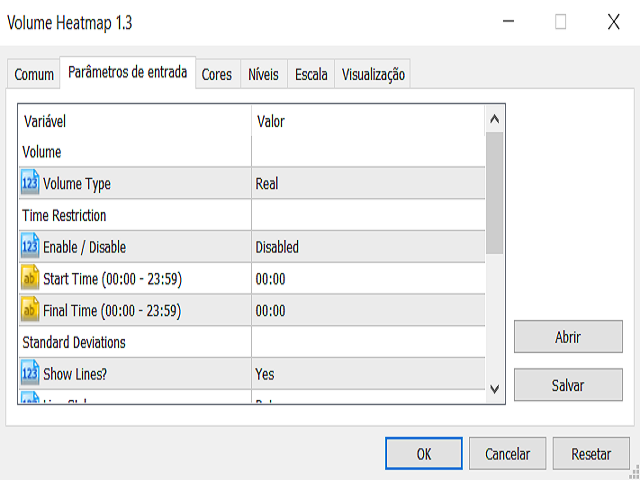
Settings:
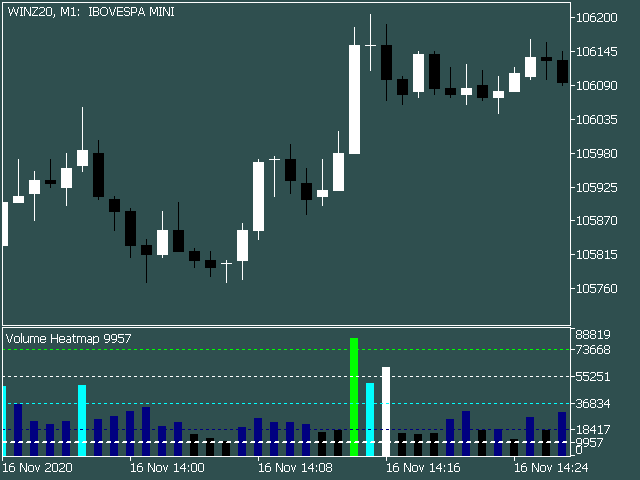
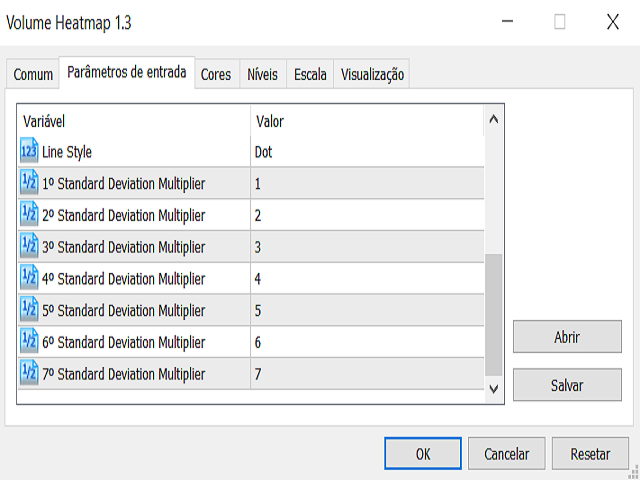
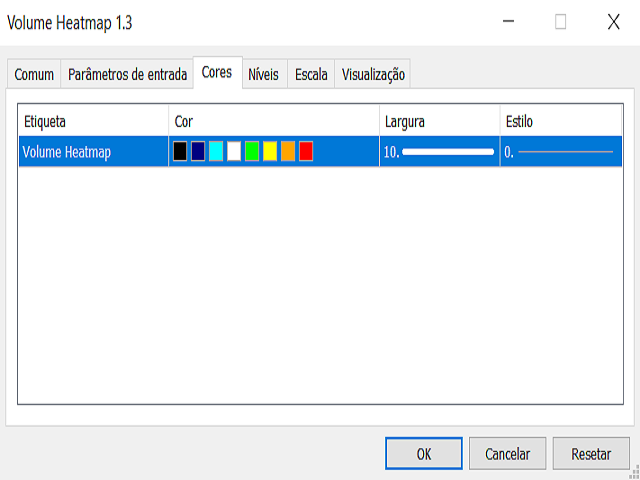
- Possibility to adjust the intensity ranges using the standard deviation multipliers.
- Possibility of limiting the operation of the indicator only for calculations in a time range, this feature makes it possible to exclude volumes from the beginning and end of the auction through the time restriction.
- Choose between calculation with tick volume or actual volume.
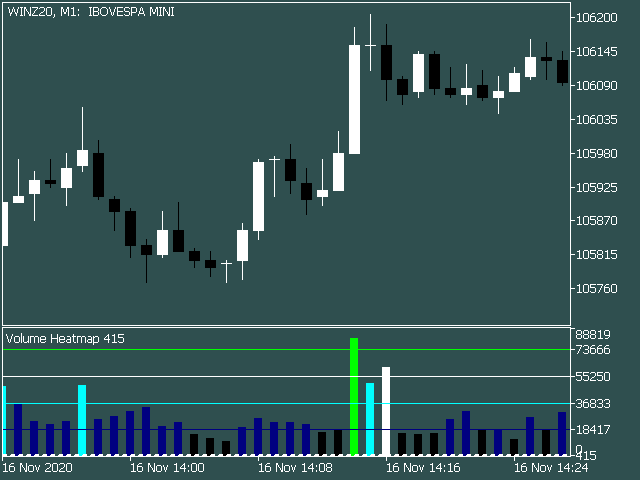
- Possibility to show or hide the lines of standard deviations.
- Possibility to choose the line type of the standard deviations (dotted, dashed, continuous, etc.).
EA integration:
- Buffer 0 - Volume
- Buffer 1 - Volume Color (0-7)
- Buffer 2 - Standard Deviation
ALERTS:
- If the time restriction is ON, the volume buffer will have a ZERO VALUE for volume bars that have been restricted by the time.
- The indicator does NOT work for brokerages that do not provide volume information.
- The indicator is compatible with EA (Robot).
- USE the DEMO version to check the functionality of the indicator BEFORE purchasing the PRO version.
- This DEMO version has ALL of its features FULLY enabled. The only limitation is that the indicator works only in DEMO ACCOUNT.
Have you tested the Volume Heatmap DEMO?
Get the PRO version: https://www.mql5.com/en/market/product/57801