• Genel bakış
  • İncelemeler (4)
  • Yorumlar
  • Yenilikler

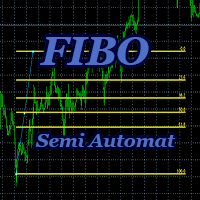
UPD1 Fibo Levels

5

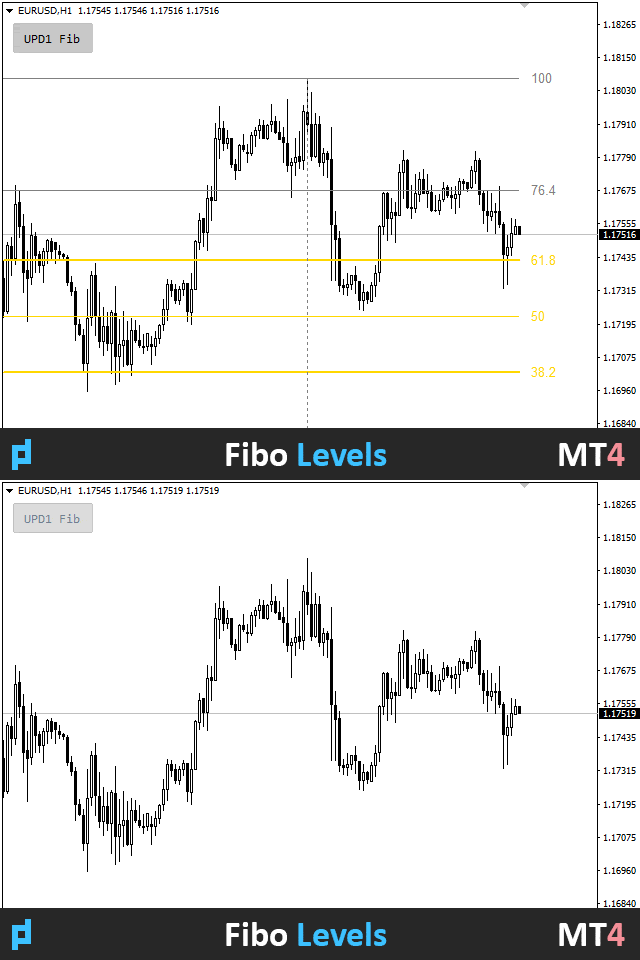
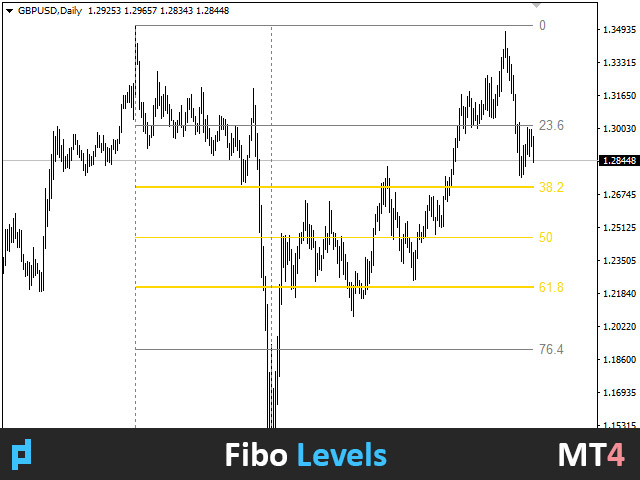
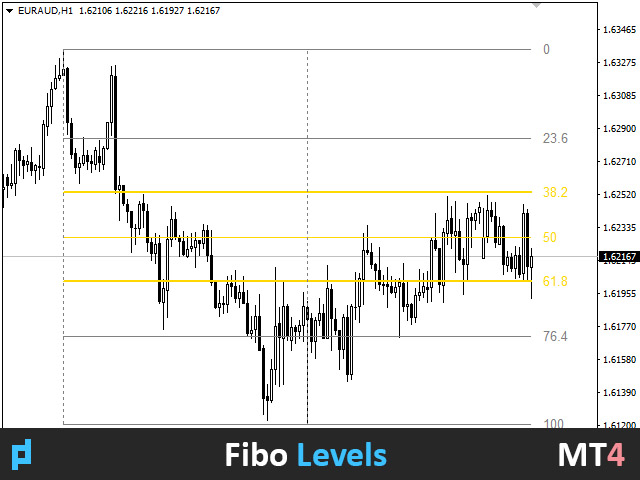
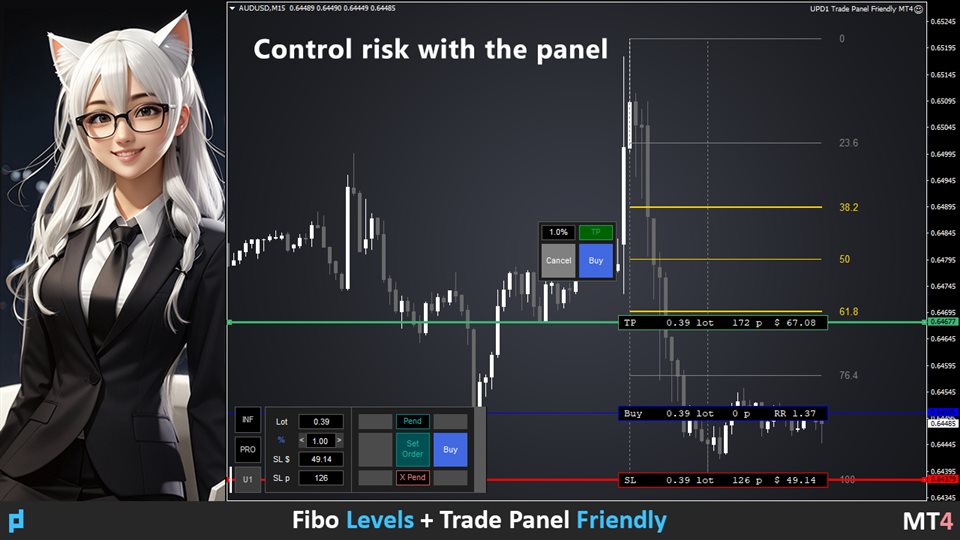
Gösterge, belirtilen mum sayısını analiz eder ve maksimum-minimuma dayalı Fibonacci seviyeleri oluşturur.

Seviyeler yeniden inşa edildiğinden, aralığın sağ tarafıyla ilgileniyoruz. Fiyat seviyelere manyetiktir ve bir dokunuşa tepki verir.

Bir düzeltmeden sonra bir trend giriş noktası bulmak için bu aracı kullanın.

Sol tarafta seviyelerin mükemmel bir şekilde yükseldiğini görürsek, hareketin sonunu en uç noktada bulduğumuzu varsayabiliriz.

Tüm çizgiler tamponlar veya nesneler (seçiminiz) aracılığıyla çizilir.


Girdi parametreleri.


Bars Count - hesaplama aralığı.


Visual Button - düğme ekranı (açık/kapalı).

Corner - düğme bağlama açısı.

X indent - piksel cinsinden yatay girinti.

Y indent - piksel cinsinden dikey girinti.


    Label Visual - seviye etiketini görüntüler.

    Label Font Size - yazı tipi boyutu.

    Label Shift Bars - yazıyı girintiler.

    Label Tooltip - seviyenin üzerindeki imlecin altında yazıyı görüntüler.


    Draw Lines -  tamponlar veya nesnelerle çizgiler çizin.

    Box Visual - kutu görselini etkinleştirir/devre dışı bırakır.

    Box Width - kutu çizgilerinin kalınlığı.

    Box Style - kutu çizgilerinin stili.


    Levels Color - çizgilerin rengi.

    Levels Width - çizgilerin kalınlığı.

    Levels Style - çizgilerin stili.


      Alert - uyarıyı etkinleştirir/devre dışı bırakır.

      Alert Work Time - Uyarı Çalışma Zamanı 00:00-23:59 (düzenlenebilir).

      Alert Pop Up -  açılır pencere.

      Alert Push -  uygulamada uyarı.

      Alert Email -  postaya bildirim.

      Alert Sound -  sesi etkinleştirin veya devre dışı bırakın.

      Alert Sound Name - ses dosyası.


      Line ID - nesne adının ön eki.


      İncelemeler 4
      jonclark365
      207
      jonclark365 2023.01.22 14:20 
       

      Very good!! Thanks for sharing.

      Önerilen ürünler
      Basic Fibonacci Calculation Indicator  shows Trend, Stoploss, Profit 1,2,3, will show you your daily Highs and your Daily Lows , it will also show you where it expects the price to move to.  best time frame is H1 or higher .  For  a better system that also includes my Non-repaint Indicator please check out my paid Fibo Indicator  https://www.mql5.com/en/market/product/82323
      FREE
      Fibonacci SR Indicator This indicator creates support and resistance lines. This indicator is based on Fibonacci Retracement and Extension levels. It will consider many combinations of the Fibonacci levels and draw support/resistance lines based on these. This indicator uses tops and bottoms drawn by the ZigZag indicator in its calculations. The ZigZag can also be drawn on the chart, if necessary. The indicator considers many combinations of past reversal points and Fibonacci ratio levels, and
      FREE
      BeST_ Classic Pivot Points is an MT4 Indicator that is based on the widely known and definitely classic Pivot Point of a market prices activity. A pivot point is calculated as an average of significant prices (high,low,close) from the performance of a market in the prior trading period. If the market in the following period trades above the pivot point it is usually evaluated as a bullish sentiment, whereas trading below the pivot point is seen as bearish. A pivot point and the associated suppo
      FREE
      Description: The indicator measures, through the zigzag indicator, the levels of trend or correction. It shows in the chart the levels of each low or high detected. KEY LINKS:   How to Install  –  Frequent Questions  -  All Products  How is this indicator useful? This indicator determines, depending on Zigzag parameter if a trend is beginning, developing, or ending This indicator determines the direction of the trend Components Levels as positive or negative numbers, depending on the direction
      FREE
      Free automatic Fibonacci is an indicator that automatically plots a Fibonacci retracement based on the number of bars you select on the BarsToScan setting in the indicator. The Fibonacci is automatically updated in real time as new highest and lowest values appears amongst the selected bars. You can select which level values to be displayed in the indicator settings. You can also select the color of the levels thus enabling the trader to be able to attach the indicator several times with differe
      FREE
      Fibonacci Retracement object is an object that has been provided by metatrader 4 platform. But  Fibonacci Retracement  object doesn't automated adjust the chart. You have to put and manage it manually to the chart. Because of that, this indicator was created. If you like using filbonacci retracement indicator, highly recommended to use Automated Fibonacci Retracement Indicator if you want to get better result in here: https://www.mql5.com/en/market/product/95515 LT Automated Fibonacci Retrace
      This indicators automatically draws the Support and resistances levels for you once you've dropped it on a chart.  It reduces the hustle of drawing and redrawing these levels every time you analysis prices on a chart. With it, all you have to do is dropped it on a chart, adjust the settings to your liking and let the indicator do the rest.  But wait, it gets better; the indicator is absolutely free!  Get the new and improved version here:  https://youtu.be/rTxbPOBu3nY Parameters Time-frame  -> T
      FREE
      MultiFiboDynamicMT4 is a powerful, professional indicator for estimating the most important support and resistance levels. The main advantage is that it plots the Fibonacci levels at all timeframes simultaneously, which allows the trader to see the full picture of the possible price movement of the trading instrument! Advantages of the indicator The indicator is perfect for scalping and trading binary options. Suitable for beginners and experienced traders. Works on all timeframes. Works on an
      FREE
      This indicator filters the Zigzag indicator to calculate the main support and resistance levels. Variables minimum gap between peaks : is the distance (GAP) between the peaks of the Zigzag peaks sensitivity : Minimum number of nearby peaks look back: it means that it has to test the last 50 peaks in the Zigzag object name perfix: a prefix for level’s line name on chart
      FREE
      This indicators automatically draws the   support and resistances   levels (key levels) for you once you've dropped it on a chart. It reduces the hustle of drawing and redrawing these levels every time you analyse prices on a chart. With it, all you have to do is drop it on a chart, adjust the settings to your liking and let the indicator do the rest. But wait, it gets better; the indicator is absolutely free! For more information:  https://youtu.be/rTxbPOBu3nY For more free stuff visit:  https
      FREE
      Trend Yakalayıcı: Alarm İndikatörü ile Trend Yakalayıcı Stratejisi, piyasa trendlerini ve potansiyel giriş ve çıkış noktalarını belirlemede yardımcı olan çok yönlü bir teknik analiz aracıdır. Piyasa koşullarına uyum sağlayarak trend yönünün net görsel temsili için dinamik bir Trend Yakalayıcı Stratejisi sunar. Tüccarlar tercihlerine ve risk toleranslarına göre parametreleri özelleştirebilirler. Gösterge, trendleri tanımlamaya yardımcı olur, potansiyel ters dönüşleri sinyaller, trailing stop m
      FREE
      The   Pivot Point indicator   automatically calculates and displays the pivot point line and support and resistance levels. Pivot can be calculated according to the Classic, Floor, Fibonacci, Woodie, Camarilla or DeMark formula. It is also possible to select the period for calculating the indicator. A trader can choose from daily, weekly, monthly, or user-defined periods. Types of pivots Classic Floor Fibonacci Woodie Camarilla DeMark Main features The indicator shows the current and histor
      FREE
      Koala Fibo Base Time
      Ashkan Hazegh Nikrou
      3 (1)
      Welcome to Koala Fibo Base Time Welcome to Koala Fibo Time Zone Welcome to Koala Fibo Time Extention Welcome to Missed Tool For Meta Trade! Simple Introduction : Fibonacci Time Zones are vertical lines based on the Fibonacci Sequence. These lines extend along the X axis (date axis) as a mechanism to forecast reversals based on elapsed time. A major low or high is often chosen as the starting point. Distances start relatively small and grow as the Fibonacci Sequence extends. Chartists can exten
      FREE
      The SFT Fibo Smart Pivot indicator is a powerful trading tool based on the Fibonacci Golden Ratio, designed to identify key support and resistance levels in the forex market. This indicator has the ability to pinpoint significant price levels that can serve as entry and exit points for trades. It enables traders to analyze the market more effectively and make well-informed decisions. The indicator uses the Fibonacci Golden Ratio to accurately determine support and resistance levels. These levels
      FREE
      This indicator is stand alone version from  MP Pivot Levels  (All in one) containing Woodie Pivots. Woodie’s pivot points are made up of multiple key levels, calculated from past price points, in order to frame trades in a simplistic manner. The key levels include the ‘pivot’ itself, and multiple support and resistance levels (usually up to three each). Traders use these levels as a guide for future price movements when setting up trades. The pivot : (Previous high + previous low + 2 x previou
      FREE
      Necessary for traders: tools and indicators Waves automatically calculate indicators, channel trend trading Perfect trend-wave automatic calculation channel calculation , MT4 Perfect trend-wave automatic calculation channel calculation , MT5 Local Trading copying Easy And Fast Copy , MT4 Easy And Fast Copy , MT5 Local Trading copying For DEMO Easy And Fast Copy , MT4 DEMO Easy And Fast Copy , MT5 DEMO The homeopathic indicator is also called the CCI indicator. The CCI indicator was propos
      FREE
      CandlePips
      Yawo Julio K Kavege Atileh
      This indicator works on this way: Trader should provided the n period "Number of Candle" ( the default period is 6) Then the indicator  will calculate the number of pips in the last n period  (not the current candle) And that is display on the chart With that the should confirmed his up trend or down trend analyse according to the number of pips in the last  n candles( bullish or bearish) he has provided
      FREE
      Trend Line Channel
      David Muriithi
      4.14 (14)
      This indicators automatically draws the Trend Channels for you once you've dropped it on a chart.  It reduces the hustle of drawing and redrawing these levels every time you analysis prices on a chart. With it, all you have to do is dropped it on a chart, adjust the settings to your liking and let the indicator do the rest.  Get an alternative version of this indicator here:   https://youtu.be/lt7Wn_bfjPE For more free stuff visit:  https://abctrading.xyz Parameters 1) Which trend do you want
      FREE
      Trend arrow Indicator
      NGUYEN NGHIEM DUY
      3.33 (9)
      Trend arrow Indicator is an arrow Indicator used as an assistant tool for your trading strategy. The indicator analyzes the standard deviation of bar close for a given period and generates a buy or sell signals if the deviation increases. It good to combo with Martingale EA to follow Trend and Sellect Buy Only/Sell Only for EA work Semi-Automatic. You can use this  Indicator with any EAs in my Products.
      FREE
      Peak Trough Analysis is the great tool to detect peaks and troughs in your chart. Peak Trough Analysis tool can use three different peaks and troughs detection algorithm. The three algorithm include the orignal Fractals Indicator by Bill Williams, the Modified Fractals indicator and ZigZag indicator. You can use this peak and trough analysis tool to detect the price pattern made up from Equilibrium Fractal-Wave process. For further usage, there are good guide line on how to use this peak trough
      FREE
      Follow The Line
      Oliver Gideon Amofa Appiah
      4.07 (14)
      FOLLOW THE LINE GET THE FULL VERSION HERE: https://www.mql5.com/en/market/product/36024 This indicator obeys the popular maxim that: "THE TREND IS YOUR FRIEND" It paints a GREEN line for BUY and also paints a RED line for SELL.  It gives alarms and alerts of all kinds. IT DOES NOT REPAINT and can be used for all currency pairs and timeframes. Yes, as easy and simple as that. Even a newbie can use it to make great and reliable trades. NB: For best results, get my other premium indicators for more
      FREE
      Bu gösterge size aşağıdaki seviyeleri çizecektir: Günlük açık hat: aşağıda ayı piyasası var, yukarıda ise yükseliş var. Ortalama günlük aralık yüksek ve düşük Asya piyasası yüksek ve düşük Dünün en yüksek ve en düşük seviyeleri Bu seviyeler herkesin dikkat etmesi gereken güçlü destek ve direnç seviyeleridir. Başlamak için zamanını kullanmadıysanız! Fiyat bu seviyelere yaklaşırken dikkat etmeniz gerekiyor! Kolaylaşan ticaretin tadını çıkarın!
      FREE
      Double top and bottom indicator is a pattern scanning indicator which scans the tops and bottoms using zig zag pattern. When it find price bouncing back from the same point twice after a long trend then it generate arrow signals whenever the last resistance points is broken for double bottom and last support price broken for double top. Unlike other top bottom scanner it does not give only 1 signal. it alerts user when ever the last support /resistance is broker from double top/bottom pattern un
      FREE
      Auto Fibo Retracement MT4
      Nguyen Tuan Son
      3.67 (3)
      Just another Auto Fibonacci Retracement indicator . However, this is the most Flexible & Reliable one you can find for FREE. If you use this indicator and you like it, please leave a review/comment. If you are looking for a more advanced Fibo indicator, check this  Free  Trend-Based Fibo indicator . ### FEATURES ### Auto-calculate up to 7 Fibonacci levels on your customized frame. Adjust levels as your need. Use   High/Low price or  Open/Close price to calculate. Freeze the levels and don't re
      FREE
      Download the free version   here. Divergence Divergence refers to when the price of a currency pair moves in one direction while the trend indicator is moving in the opposite direction. With divergence, there can be positive and negative signals. Divergences in Forex trading are quite common signals of technical analysis. These are basic early Forex signals indicating the trend reversal and filter false signals. Application of this indicator It is usually not easy to detect divergences by the t
      FREE
      KTrade Fibo
      Kaijun Wang
      4 (1)
      Necessary for traders: tools and indicators Waves automatically calculate indicators, channel trend trading Perfect trend-wave automatic calculation channel calculation , MT4 Perfect trend-wave automatic calculation channel calculation , MT5 Local Trading copying Easy And Fast Copy , MT4 Easy And Fast Copy , MT5 Local Trading copying For DEMO Easy And Fast Copy , MT4 DEMO Easy And Fast Copy , MT5 DEMO Fibo: from KTrade 1. Automatically calculate and analyze the band. -> Get the desired band 2.
      FREE
      Advisor-assistant for those who like trading on Fibonacci levels. Automatically finds manually plotted Fibonacci Lines on the chart, and opens an order when the levels are broken. The Expert Advisor has 4 customizable levels and the ability to turn them off as unnecessary. Parameters:   Lot - order volume (lot);   Requote - price slippage;   Magic - individual number for all EA orders, works only with own orders;   Name Fibo - set initial name of Fibonacci lines;       Level parameters are id
      FREE
      Double Price Channel   Price channel indicator for a certain number of bars specified in the settings. Indicator lines represent dynamic support or resistance levels. The upper limit is the price maximum for a certain number of periods, the lower one is the minimum. Unlike moving averages, which are based on close prices, the indicator is not “distracted” by small fluctuations. It will be recalculated only if the boundaries change. If the latter happens, then it is worth seriously thinking abou
      FREE
      Fibonacci retracement is really one of the most reliable technical analysis tools used by traders. The main problem with using these levels in trading is that you need to wait until the end of the impulse movement to calculate the retracement levels, making difficult to take a position for limited retracement (0.236 or 0.382). Fibo Dynamic solves this problem. Once the impulse movement is identified the retracement levels are automatically updated allowing very dynamic trading in trends with onl
      FREE
      Wise Men Indicator demo
      Bohdan Kasyanenko
      3 (2)
      The indicator displays signals according to the strategy of Bill Williams on the chart. Demo version of the indicator has the same features as the paid, except that it can work only on a demo account . Signal "First Wise Man" is formed when there is a divergent bar with angulation.  Bullish divergent bar - with lower minimum and closing price in the upper half. Bearish divergent bar - higher maximum and the closing price at the bottom half. Angulation is formed when all three lines of Alligat
      FREE
      Bu ürünün alıcıları ayrıca şunları da satın alıyor
      Gann Made Easy
      Oleg Rodin
      4.83 (92)
      Gann Made Easy , bay teorisini kullanarak ticaretin en iyi ilkelerine dayanan, profesyonel ve kullanımı kolay bir Forex ticaret sistemidir. WD Gann. Gösterge, Zararı Durdur ve Kâr Al Seviyeleri dahil olmak üzere doğru SATIN AL ve SAT sinyalleri sağlar. PUSH bildirimlerini kullanarak hareket halindeyken bile işlem yapabilirsiniz. Lütfen satın aldıktan sonra benimle iletişime geçin! Alım satım ipuçlarımı ve harika bonus göstergelerini ücretsiz olarak sizinle paylaşacağım! Muhtemelen Gann ticaret y
      Bull versus Bear
      Mohamed Hassan
      4.55 (11)
      Official Release price of $65 for the first 97 /100   copies ( 3  copies left). Next price is $120 !  Send us a message after your purchase to receive more information on how to get your  BONUS  for FREE  that works in great combination with Bull vs Bear ! Bull versus Bear is an easy-to-use Forex indicator that gives traders clear and accurate signals based on clear trend retests . Forget about lagging indicators or staring at charts for hours because  Bull vs Bear provides real-time entrie
      - Real price is 80$ - 40% Discount ( It is 49$ now ) Contact me for instruction, add group and any questions! Related Products:  Bitcoin Expert , Gold Expert Introduction The breakout and retest strategy is traded support and resistance levels. it involves price breaking through a previous level.  The break and retest strategy is designed to help traders do two main things, the first is to avoid false breakouts. Many false breakouts start with a candlestick that breaks out of a level but ends w
      Golden Trend Indicator
      Noha Mohamed Fathy Younes Badr
      5 (1)
      Golden Trend indicator  is The best indicator for predicting trend movement this indicator never lags and never repaints and never back paints    and give  arrow buy and sell    before the candle appear  and it will help you and  will make your trading decisions clearer its work on all currencies and  gold and crypto and all time frame This unique  indicator uses very secret algorithms to catch the  trends, so you can trade using this indicator and see the trend clear on charts  manual guide and
      FX Power MT4 NG
      Daniel Stein
      5 (14)
      FX Power NG'nin Tüm Gücünün Kilidini Açın: Nihai Para Birimi Güç Ölçer FX Power, sekiz yılı aşkın süredir dünya çapındaki yatırımcıları güvenilir ve hassas döviz gücü analizleriyle güçlendirmektedir. Şimdi, FX Power NG bu güvenilir aracı bir sonraki seviyeye taşıyarak, ticaretinize benzersiz doğruluk, özelleştirme ve içgörüler getiren gelişmiş özellikler sunuyor. FX Power NG'yi Ciddi Yatırımcılar İçin Olmazsa Olmaz Kılan Nedir? FX Power NG, orijinal FX Power'da sevdiğiniz her şeyi temel ekle
      FX Volume
      Daniel Stein
      4.58 (33)
      FX Hacmi ile Forex'te Gerçek Bir Avantaj Elde Edin: Nihai Hacim Göstergesi FX Volume, gerçek piyasa duyarlılığını içeriden bir bakış açısıyla ortaya koyan ilk ve tek hacim göstergesidir. FX Volume, kurumsal piyasa katılımcılarının ve brokerlerin nasıl konumlandıklarına dair benzersiz bilgiler sağlayarak, genellikle büyük oyuncular için ayrılmış öngörü ile ticaret yapmanıza olanak tanır. COT raporlarının gecikmelerine elveda deyin - FX Volume size bu önemli bilgileri anında grafiğinizde sunarak
      Trend Screener
      STE S.S.COMPANY
      4.81 (89)
      Trend Göstergesi, Trend Alım Satım ve Filtreleme için Çığır Açan Benzersiz Çözüm, Tüm Önemli Trend Özellikleriyle Tek Bir Araç İçinde Yerleştirildi! Forex, emtialar, kripto para birimleri, endeksler ve hisse senetleri gibi tüm sembollerde/araçlarda kullanılabilen %100 yeniden boyamayan çoklu zaman çerçevesi ve Çoklu para birimi göstergesidir. SINIRLI SÜRELİ TEKLİF: Destek ve Direnç Tarama Göstergesi sadece 50$ ve ömür boyu mevcuttur. (Orijinal fiyat 250$) (teklif uzatıldı) Trend Screener, grafik
      TPSproTREND PrO
      Roman Podpora
      4.79 (19)
      TPSpro TREND PRO,   piyasayı otomatik olarak analiz eden, trend ve değişimlerinin her biri hakkında bilgi sağlayan, ayrıca yeniden çizmeden işlemlere girme sinyalleri veren bir trend göstergesidir! Gösterge her mumu ayrı ayrı analiz ederek kullanır. farklı dürtülere atıfta bulunur - yukarı veya aşağı dürtü. Para birimleri, kripto paralar, metaller, hisse senetleri ve endeksler için işlemlere tam giriş noktaları! Sürüm MT5                   GÖSTERGENİN TAM AÇIKLAMASI       Bunu -   RFI SEVİYELER
      Trend Punch
      Mohamed Hassan
      4.95 (21)
      This indicator is unstoppable when combined with our other indicator called  Support & Resistance . After purchase, send us a message and you will get it   for  FREE as a BONUS! Introducing Trend Punch , the revolutionary forex trend indicator that will transform the way you trade! Trend Punch is uniquely designed to provide precise buy and sell arrows during strong market trends, making your trading decisions clearer and more confident. Whether you're trading major currency pairs or exotic sym
      MetaBands M4
      Vahidreza Heidar Gholami
      5 (3)
      MetaBands uses powerful and unique algorithms to draw channels and detect trends so that it can provide traders with potential points for entering and exiting trades. It’s a channel indicator plus a powerful trend indicator. It includes different types of channels which can be merged to create new channels simply by using the input parameters. MetaBands uses all types of alerts to notify users about market events. Features Supports most of the channel algorithms Powerful trend detection algorith
      Atomic Analyst
      Issam Kassas
      5 (2)
      Öncelikle belirtmek gerekir ki bu Ticaret Göstergesi Yeniden Çizim Yapmaz, Gecikmez ve Gecikme Göstermez, bu da hem manuel hem de robot ticareti için ideal hale getirir. Kullanıcı kılavuzu: ayarlar, girişler ve strateji. Atom Analisti, Piyasada Daha İyi Bir Avantaj Bulmak İçin Fiyatın Gücünü ve Momentumunu Kullanan PA Fiyat Hareketi Göstergesidir. Gürültüleri ve Yanlış Sinyalleri Kaldırmaya ve Ticaret Potansiyelini Artırmaya Yardımcı Olan Gelişmiş Filtrelerle Donatılmıştır. Birden fazla katma
      Quantum Breakout Indicator PRO
      Bogdan Ion Puscasu
      4.96 (26)
      Tanıtım       Quantum Breakout PRO   , Breakout Bölgeleri ile ticaret yapma şeklinizi değiştiren çığır açan MQL5 Göstergesi! 13 yılı aşkın ticaret deneyimine sahip deneyimli tüccarlardan oluşan bir ekip tarafından geliştirilen   Quantum Breakout PRO   , yenilikçi ve dinamik koparma bölgesi stratejisiyle ticaret yolculuğunuzu yeni zirvelere taşımak için tasarlanmıştır. Kuantum Breakout Göstergesi, size 5 kar hedefi bölgesi ile kırılma bölgelerinde sinyal okları ve kırılma kutusuna dayalı ol
      TrendMaestro
      Stefano Frisetti
      5 (3)
      note: this indicator is for METATRADER4, if you want the version for METATRADER5 this is the link:  https://www.mql5.com/it/market/product/108106 TRENDMAESTRO ver 2.4 TRENDMAESTRO recognizes a new TREND in the bud, he never makes mistakes. The certainty of identifying a new TREND is priceless. DESCRIPTION TRENDMAESTRO identifies a new TREND in the bud, this indicator examines the volatility, volumes and momentum to identify the moment in which there is an explosion of one or more of these data a
      Gold Stuff
      Vasiliy Strukov
      4.87 (243)
      Gold Stuff, özellikle altın için tasarlanmış bir trend göstergesidir ve herhangi bir finansal enstrümanda da kullanılabilir. Gösterge yeniden çizilmez ve gecikmez. Önerilen zaman dilimi H1. Bu göstergede tam otomatik Uzman Danışman EA Gold Stuff çalışır. Profilimde bulabilirsiniz. Ayarları ve kişisel bir bonusu almak için satın alma işleminden hemen sonra benimle iletişime geçin!  Güçlü Destek ve Trend Tarayıcı göstergemizin ücretsiz bir kopyasını pm'den alabilirsiniz. Ben! AYARLAR Ok Ç
      Black dragon indicator
      Ramil Minniakhmetov
      4.86 (115)
      Trend algılama göstergesi, herhangi bir stratejiyi tamamlayacak ve bağımsız bir araç olarak da kullanılabilir. ÖNEMLİ! Talimatları ve bonusu almak için satın aldıktan hemen sonra benimle iletişime geçin! Göstergeyle çalışmak için öneriler, yorum #5'ten indirebilirsiniz. Avantajlar Kullanımı kolay, tabloyu gereksiz bilgilerle doldurmaz; Herhangi bir strateji için filtre olarak kullanabilme; Hem kar elde etmek hem de zararları durdurmak için kullanılabilen yerleşik dinamik destek ve diren
      Dynamic Forex28 Navigator
      Bernhard Schweigert
      5 (2)
      Dynamic Forex28 Navigator - Yeni Nesil Forex Ticaret Aracı. ŞU ANDA %49 İNDİRİM. Dynamic Forex28 Navigator, uzun zamandır popüler olan göstergelerimizin evrimidir ve üçünün gücünü tek bir göstergede birleştirir: Gelişmiş Döviz Gücü28 Göstergesi (695 inceleme) + Gelişmiş Döviz İMPULS ve UYARI (520 inceleme) + CS28 Kombo Sinyalleri (Bonus). Gösterge hakkında ayrıntılar https://www.mql5.com/en/blogs/post/758844 Yeni Nesil Güç Göstergesi Ne Sunuyor?  Orijinallerde sevdiğiniz her şey, şimdi ye
      Scalper Inside PRO
      Alexey Minkov
      4.73 (56)
      An exclusive indicator that utilizes an innovative algorithm to swiftly and accurately determine the market trend. The indicator automatically calculates opening, closing, and profit levels, providing detailed trading statistics. With these features, you can choose the most appropriate trading instrument for the current market conditions. Additionally, you can easily integrate your own arrow indicators into Scalper Inside Pro to quickly evaluate their statistics and profitability. Scalper Inside
      Scalper Vault
      Oleg Rodin
      5 (27)
      Scalper Vault , başarılı bir scalping için ihtiyacınız olan her şeyi size sağlayan profesyonel bir scalping sistemidir. Bu gösterge, forex ve ikili opsiyon tüccarları tarafından kullanılabilecek eksiksiz bir ticaret sistemidir. Önerilen zaman çerçevesi M5'tir. Sistem size trend yönünde doğru ok sinyalleri sağlar. Ayrıca size üst ve alt sinyaller ve Gann piyasa seviyeleri sağlar. Göstergeler, PUSH bildirimleri dahil her türlü uyarıyı sağlar. Göstergeyi satın aldıktan sonra lütfen benimle iletişim
      Şu anda %20 İNDİRİMLİ! Herhangi bir Acemi veya Uzman Tüccar için En İyi Çözüm! Bu gösterge paneli yazılımı 28 döviz çifti üzerinde çalışıyor. Ana göstergelerimizden 2'sine (Gelişmiş Para Birimi Gücü 28 ve Gelişmiş Para Birimi Dürtüsü) dayanmaktadır. Tüm Forex piyasasına harika bir genel bakış sağlar. Gelişmiş Para Birimi Gücü değerlerini, para birimi hareket hızını ve tüm (9) zaman dilimlerinde 28 Forex çifti için sinyalleri gösterir. Trendleri ve / veya scalping fırsatlarını belirlemek içi
      Satın aldıktan sonra yorum bırakın, bonus olarak 4 yüksek kaliteli gösterge alın. Chart Patterns All-in-One göstergesi, traderların teknik analizde yaygın olarak kullanılan çeşitli grafik desenlerini görselleştirmelerine yardımcı olur. Bu gösterge, potansiyel piyasa hareketlerini belirlemeye yardımcı olur ancak kârlılığı garanti etmez. Satın almadan önce göstergeyi demo modunda test etmeniz önerilir. Mevcut Teklif : "Chart Patterns All in One" göstergesinde %50 indirim. Dahil Edilen Desenler : 1
      TakePropips Donchian Trend Pro
      Eric John Pajarillaga Aldana
      4.44 (16)
      TakePropips Donchian Trend Pro   (MT4), Donchian Kanalı'nı kullanarak trendin yönünü otomatik olarak tespit eden ve size ticarete giriş ve çıkış sinyalleri sağlayan güçlü ve etkili bir araçtır! Bu çok işlevli gösterge, bir trend tarayıcı, ticaret sinyalleri, istatistiksel panel, tarayıcı, ticaret oturumları ve uyarı geçmişi panosu içerir. Size ticaret sinyalleri sağlamak ve çizelgeleri analiz ederek saatlerce tasarruf etmenizi sağlamak için tasarlanmıştır! Kullanım kılavuzunu ve kurulum kılavuzu
      FX Seviyelerini Keşfedin: Ticarette Başarı için Nihai Destek ve Direnç Göstergeniz FX Levels bir destek ve direnç göstergesinden daha fazlasıdır; döviz çiftleri, endeksler, hisse senetleri veya emtialar olsun, tüm ticaret sembollerinde hassasiyet, güvenilirlik ve sorunsuz işlevsellik isteyen ciddi tüccarlar için oyunun kurallarını değiştirir. Kanıtlanmış Lighthouse yöntemi üzerine inşa edilen ve dinamik, gerçek zamanlı uyarlanabilirlik ile geliştirilen FX Levels, hassas kar hedefleri belirleme
      TPSpro RFI Levels
      Roman Podpora
      4.82 (22)
      TALİMATLAR         RUS   -        ENG       Bir gösterge ile kullanılması   önerilir       -       TPSpro   TREND PRO -   Sürüm MT4         Ticarette önemli bir unsur, bir ticaret aracını satın alma veya satma kararlarının alındığı bölgeler veya seviyelerdir. Büyük oyuncuların piyasadaki varlıklarını gizleme girişimlerine rağmen, kaçınılmaz olarak izler bırakırlar. Bizim görevimiz bu izleri nasıl tanımlayacağımızı ve doğru şekilde nasıl yorumlayacağımızı öğrenmekti. Ana işlevler:: Satıcılar ve
      Connect Indicator
      Sukunthakan Ngernbamrung
      Connect Indicator is a tool used for connecting indicators between the MQL market and MT4. The connected indicators are made by our group and can be used for other applications, such as sending messages to the Line application or Telegram application. If you have any questions, please don't hesitate to ask us to receive support. Function and indicator buffer Buffer one is the high price of the previous candle. Buffer two is the high price of the previous candle. Usage To connect indicators to fu
      Stratos Pali
      Michela Russo
      5 (1)
      Stratos Pali Indicator   is a revolutionary tool designed to enhance your trading strategy by accurately identifying market trends. This sophisticated indicator uses a unique algorithm to generate a complete histogram, which records when the trend is Long or Short. When a trend reversal occurs, an arrow appears, indicating the new direction of the trend. Important Information Revealed Leave a review and contact me via mql5 message to receive My Top 5 set files for Stratos Pali at no cost! D
      Entry Arrow Alerts: Finds market entry opportunities then notifies you via mobile or desktop alerts The key features include: Conservative mode . One entry signal per direction. Ideal for the patient trader looking to capture longer term moves. Aggressive mode . Multiple possible entry signals per direction. Ideal for the active trader looking to capture multiple moves within the same trend. Trigger Line . Price entry line helps cut down on false signals. Display Window . Allows you to instantly
      Fiyat tersine döndükçe ve geri çekildikçe piyasa yapısından elde edilen kâr değişir. Piyasa yapısını tersine çevirme uyarısı göstergesi, bir trendin veya fiyat hareketinin ne zaman tükenmeye yaklaştığını ve tersine dönmeye hazır olduğunu tanımlar. Genellikle bir geri dönüş veya büyük bir geri çekilme meydana gelmek üzereyken meydana gelen piyasa yapısındaki değişiklikler konusunda sizi uyarır. Gösterge, olası bir tükenme noktasının yakınında her yeni yüksek veya düşük oluştuğunda, başlangıçta
      Advanced Supply Demand
      Bernhard Schweigert
      4.91 (295)
      CURRENTLY 26% OFF !! Best Solution for any Newbie or Expert Trader! This indicator is a unique, high quality and affordable trading tool because we have incorporated a number of proprietary features and a new formula. With this update, you will be able to show double timeframe zones. You will not only be able to show a higher TF but to show both, the chart TF, PLUS the higher TF: SHOWING NESTED ZONES. All Supply Demand traders will love it. :) Important Information Revealed Maximize the potenti
      Supply and Demand Dashboard PRO
      Bernhard Schweigert
      4.8 (20)
      Şu anda %20 İNDİRİMLİ! Bu gösterge paneli, birden fazla sembol ve 9 zaman dilimine kadar çalışan çok güçlü bir yazılım parçasıdır. Ana göstergemize dayanmaktadır (En iyi yorumlar: Advanced Supply Demand ).     Gösterge paneli harika bir genel bakış sağlar. Gösterir:    Bölge mukavemet derecesi dahil filtrelenmiş Arz ve Talep değerleri, Bölgelere/ve bölgeler içindeki pip mesafeleri, İç içe geçmiş bölgeleri vurgular, Tüm (9) zaman dilimlerinde seçilen semboller için 4 çeşit uyarı verir. Kişis
      Graf Mason
      Alexandr Lapin
      5 (5)
      Graf Mason is a tool that will make you a professional analyst! The method of determining wave movements using inclined channels qualitatively conveys the schematics of the movement of any instrument, showing not only possible reversals in the market, but also the goals of further movements!Destroys the myth that the market is alive , clearly showing the schematics of movements from one range to another! A professional tool, suitable for the medium term with the definition of the current trend!
      Yazarın diğer ürünleri
      Bu göstergenin amacı, tüm zaman dilimlerinde Murray seviyelerini bulmak ve bunları güçlü Murray seviyelerine (+2, +1, 8, 4, 0, -1, -2) dayalı sinyal seviyelerini içeren birleşik seviyeler halinde birleştirmektir. Zaman dilimi ne kadar küçük olursa, birleşik seviyeyi hemen görme şansınız o kadar artar. Renkli olarak vurgulanacaktır. İmleci herhangi bir sayının üzerine getirirseniz, seviyenin hangi zaman dilimine ait olduğuna dair bir araç ipucu görünecektir. Ancak her zaman en solda geçerli zaman
      İçine Çeken şamdan desenini gösteren bir gösterge. Ayarlarda, yutkunma türünü (gövde, gölge ve kombinasyon) belirtebilirsiniz. Eğilime (2 hareketli ortalama) ve tersine (RSI ve Bollinger Bantları) göre filtrelemek mümkündür. Bu çok popüler bir fiyat hareket modelidir. Çok para birimli gösterge tablosu mevcuttur. Bununla birlikte, grafikler arasında kolayca geçiş yapabilirsiniz. Ticaret Kalıpları: Trendlere göre tekrar test. Yanlış koparma. Sipariş Bloğu. Başka. EURUSD, GBPUSD, XAUUSD, ... M
      UPD1 Volume BOX
      Vitaliy Kuznetsov
      5 (14)
      Gösterge, belirtilen alandaki (BOX) yatay hacim profilini ve maksimum hacmi (POC) görüntüler. Ürün Özellikleri. 1. Keneleri veya sadece fiyatı kullanabilirsiniz. 2. Uyarlanabilir ızgara aralığı (M1-MN). 3. Kutu boyutuna bağlı olarak uyarlanabilir yüksek hacimli (medyan) arama adımı. 4. Kutu çizgileri ve düğmeler için otomatik bukalemun rengi. 5. Çoklu kutular, oluşturulması ve silinmesi kolay. 6. %70 hacim alanı (ayarlardan etkinleştirilir). 7. Maksimum yatay hacim çizgisine (POC) dokunmak içi
      Siparişlerin önceden ayarlanmış ve MT4 terminali için otomatik lot hesaplamasına sahip bir ticaret paneli. Dikkat, Ticaret Paneli strateji test cihazında çalışmaz (yalnızca takip eden durdurma testi). Kılavuz, Açıklama, Hafif Demo İndir. Başarılı tüccarlar, öz disiplin ve yetkin yönetim ile ayırt edilirler. Sabit bir lot kullanırsanız, o zaman risk altındasınız demektir. Sonuçta, farklı zaman dilimlerinde farklı mesafeler vardır ve karsız bir işlem birkaç kar marjını kapatabilir. Otomatik lot ku
      Bu göstergenin amacı, tüm zaman dilimlerinde Murray seviyelerini bulmak ve bunları güçlü Murray seviyelerine (+2, +1, 8, 4, 0, -1, -2) dayalı sinyal seviyelerini içeren birleşik seviyeler halinde birleştirmektir. Zaman dilimi ne kadar küçük olursa, birleşik seviyeyi hemen görme şansınız o kadar artar. Renkli olarak vurgulanacaktır. İmleci herhangi bir sayının üzerine getirirseniz, seviyenin hangi zaman dilimine ait olduğuna dair bir araç ipucu görünecektir. Ancak her zaman en solda geçerli zaman
      UPD1 Volume Cluster
      Vitaliy Kuznetsov
      4.77 (13)
      Algoritma, göstergeye UPD1 Trend Direction dayalı düşük oynaklık bölgelerini bulur ve göstergeye UPD1 Volume Box dayalı maksimum yatay hacim oluşturur. Kural olarak, birikimden çıkarken güçlü bir eğilim hareketi meydana gelir. Fiyat birikimden ayrıldıysa, maksimum yatay hacmini (POC) test edebilir. Akıllı uyarılar ayarlarda mevcuttur. Giriş parametreleri. Temel ayarlar. Bars Count – Göstergenin çalışacağı tarih çubuklarının sayısı. Timeframe Flat - Flat'in arandığı ve kümenin oluşturulduğu
      FREE
      UPD1 Trend Direction
      Vitaliy Kuznetsov
      4.75 (8)
      Bu gösterge, düz ve trend yerlerini göstermek için kullanılır. Tasarım osilatöre dayanmaktadır. Hem normal grafiklerde hem de ikili opsiyonlarda işlem yapmak için ek bir filtre olarak kullanılır. Düz noktalar, Smart Money kavramına uygun olarak ticaret yapmak için göstergede UPD1 Volume Cluster kullanılır. Yerleşik bir uyarı, en yüksek aşırı alım / aşırı satım yerlerini işaret eder. Giriş parametreleri. Temel ayarlar. Bars Count - Göstergenin görüntüleneceği çubuk sayısını belirtin. Period
      FREE
      Gösterge, üç dönemlik bir semafor ve ekstremumdan 123 ters dönüş formasyonu oluşturur. Sinyal ikinci mumun açılışında gelir. Bu formasyon farklı şekillerde alınıp satılabilir (test noktası 3, kırılma ve diğerleri). Kanaldan çıkış veya trend çizgisinin kırılması, bir giriş noktası bulmak için ana tetikleyicidir. Simgeler Fibonacci seviyelerine göre renklendirilmiştir. Sarı simgeler, sinyalin güçlendirildiği bir seviyenin test edildiğini gösterir. Çoklu para birimi kontrol panelini kullanarak 123
      UPD1 Profile Levels
      Vitaliy Kuznetsov
      5 (5)
      Gösterge, belirtilen sayıda çubuk için çalışma histogramında maksimum ve minimum fiyat hacminin (piyasa profili) seviyelerini bulur.   Kompozit profil. Histogramın yüksekliği tamamen otomatiktir ve herhangi bir enstrümana ve zaman dilimine uyarlanabilir. Yazarın algoritması kullanılır ve bilinen analogları tekrarlamaz. İki histogramın yüksekliği yaklaşık olarak mumun ortalama yüksekliğine eşittir. Akıllı uyarı (akıllı uyarı), hacim seviyesine ilişkin fiyatı bildirmenize yardımcı olur. Konsept
      UPD1 Volume Footer
      Vitaliy Kuznetsov
      4.9 (10)
      Gösterge dikey hacmi gösterir. Ayarlarda, yüksek ve aşırı olanı belirlemek için 2 faktör ve düşük hacmi belirlemek için 1 faktör vardır. Göstergede de benzer bir algoritma kullanılır UDP1 Volume Pixel . Belirtilen hacim tespit edildiğinde histogram uygun renkte boyanır. Çubuk grafiğin genişliği ölçeğe bağlı olarak otomatik olarak seçilir. Kural olarak, fiyat maksimum ve minimum hacme tepki verir. Ancak onay sinyallerinin kullanılması gerekir. Giriş parametreleri. Temel ayarlar. Bars Count -
      FREE
      Gösterge, seçilen zaman diliminde maksimum yatay hacmi görüntüler. Göstergeye dayanmaktadır UPD1 Volume Box . Çizgiler bağlanabilir veya ayrılabilir. Ayarlarda akıllı dokunuş uyarısını etkinleştirebilirsiniz. Böyle bir gösterge, piyasa profilini ve Akıllı Para kavramını kullanarak ticaret yapanlara faydalı olacaktır. Giriş parametreleri. Temel ayarlar. Bars Count - TF POC'NİN çizileceği çubuk sayısını belirtir. Data Source - kenelerin kullanılacağı zaman aralığı. Vertical Step - yoğunluğu v
      FREE
      Gösterge, üç dönemlik bir semafor ve ekstremumdan 123 ters dönüş formasyonu oluşturur. Sinyal ikinci mumun açılışında gelir. Bu formasyon farklı şekillerde alınıp satılabilir (test noktası 3, kırılma ve diğerleri). Kanaldan çıkış veya trend çizgisinin kırılması, bir giriş noktası bulmak için ana tetikleyicidir. Simgeler Fibonacci seviyelerine göre renklendirilmiştir. Sarı simgeler, sinyalin güçlendirildiği bir seviyenin test edildiğini gösterir. Çoklu para birimi kontrol panelini kullanarak 123
      UPD1 Watermark MT4
      Vitaliy Kuznetsov
      5 (1)
      Gösterge, grafikteki herhangi bir metni ve herhangi bir görüntüyü görüntüler ve ayrıca makrolar tarafından istenen bilgileri de görüntüleyebilir. Üç metin bloğu ve görüntüler için bir blok vardır. Yazı tipi seçimi, boyutu, rengi, girintisi ve konumlandırması mevcuttur. Ekran görüntülerinizi markalamak veya gerekli bilgileri bir grafik üzerinde görüntülemek istiyorsanız, UPD1 Watermark çok kullanışlı bir araç olacaktır. Ayar açıklaması. Metin ayarları (3 blok). Text 1, 2, 3 – metin ve veya m
      FREE
      Gösterge, dürtü mumlarını arar ve bunları grafikte görüntüler. Bir gölge filtresi içerir. Ayrıca Bollinger Bantlarının koparma seviyelerini de bulur. Ayarlarda çoklu para birimi gösterge tablosunu etkinleştirebilirsiniz. Uyarı, mevcut grafik veya tüm liste arasında seçim yapar. Blog-Link -  Retest and Fake Breakout with UPD1 Ticaret modelleri: Trend yeniden testi. Yanlış Kopuş. Diğerleri. EURUSD, GBPUSD, XAUUSD, ... M15, M30, H1. Giriş parametreleri. Temel. Bars Count - göstergenin üzer
      Gösterge, grafikte yuvarlak seviyeleri gösterir. Bunlara psikolojik, banka veya ana oyuncu seviyeleri de denir. Bu seviyelerde boğalar ve ayılar arasında gerçek bir mücadele vardır, birçok emir birikir ve bu da oynaklığın artmasına neden olur. Gösterge, herhangi bir enstrümana ve zaman dilimine otomatik olarak ayarlanır. 80 seviyesi kırılır ve ardından test edilirse, satın alın. 20 seviyesi kırılır ve ardından test edilirse, satış yapın. Hedef 00'dır. Dikkat! Güçlü destek ve direnç seviyeleri n
      FREE
      UPD1 Rsi Dots Dashboard
      Vitaliy Kuznetsov
      5 (1)
      Gösterge, grafikteki terminal RSI osilatörüne dayalı sinyalleri gösterir. Tekrarlanan sinyalleri filtrelemek mümkündür. Burada osilatör bir ters sinyal aramak için kullanılır. Salıncak stratejilerinde ve seviyelerden alım satımda bir giriş noktası olarak önerilir. Çok para birimli gösterge tablosu mevcuttur. Bununla birlikte, grafikler arasında kolayca geçiş yapabilirsiniz. Ürün tartışmalarında, panoyu yerleştirebileceğiniz bir algoritma önerebilirsiniz. Giriş parametreleri. Ana Ayarlar
      FREE
      UPD1 Impulse Level
      Vitaliy Kuznetsov
      5 (7)
      Gösterge grafikte nabız dalgalarını bulur. Fraktal kanalın bozulmasını analiz eder ve dürtü seviyeleri oluşturur.  Buna ek olarak, yanlış arızaların ve likiditenin yakalandığı iddia edilen yerleri bulur. Ayarlardan çoklu para birimi dashboard'u etkinleştirebilir ve herhangi bir araç ve zaman dilimini seçebilirsiniz. Uyarı Geçerli program veya tüm liste arasında seçim yapın. Ayrı nabız ve yanlış arıza sinyalleri vardır. Blog-Link -  Retest and Fake Breakout with UPD1 . Ticaret kalıpları: + T
      UPD1 Impulse Channel
      Vitaliy Kuznetsov
      5 (8)
      Trend ticareti için çizilmeyen bir kanal. ATR tarafından oluşturulmuştur ve zıt bir volatilite sınırına sahiptir. Gösterge, dürtü seviyeleri ve yanlış kırılmalar stratejisinde kendini kanıtlamıştır. Giriş noktası, gösterge çizgisine yapılan düzeltmede aranmalı ve kar alma karşı sınırda ayarlanmalıdır. Blog-Link -   Retest and Fake Breakout with UPD1 . Giriş parametreleri. Bars Count   - görüntülenecek geçmiş. ATR   - hesaplama için dönem. Coefficient   - dinamik fiyat kanalının yüksekliğin
      FREE
      UPD1 X00 Levels
      Vitaliy Kuznetsov
      5 (8)
      Gösterge, grafikte yuvarlak seviyeleri gösterir. Bunlara psikolojik, banka veya ana oyuncu seviyeleri de denir. Bu seviyelerde boğalar ve ayılar arasında gerçek bir mücadele vardır, birçok emir birikir ve bu da oynaklığın artmasına neden olur. Gösterge, herhangi bir enstrümana ve zaman dilimine otomatik olarak ayarlanır. 80 seviyesi kırılır ve ardından test edilirse, satın alın. 20 seviyesi kırılır ve ardından test edilirse, satış yapın. Hedef 00'dır. Dikkat! Güçlü destek ve direnç seviyeleri n
      FREE
      UPD1 Pin Bar Dashboard
      Vitaliy Kuznetsov
      5 (2)
      Gösterge, Pin Çubuğunun mum desenini görüntüler. Oran ayarları sayesinde gölge, beden ve boyut oranını kolayca ayarlayabilirsiniz. Eğilime (2 hareketli ortalama) ve tersine (RSI ve Bollinger bantları) göre filtreleme yapılabilir. Bu, fiyat eyleminin en popüler modelidir. Çoklu para birimi dashboard varlığında. Bununla beraber, grafikler arasında kolayca geçiş yapabilirsiniz. Ticaret kalıpları: Trendlere göre yeniden değerlendirme. Yanlış arıza. Diğer. EURUSD, GBPUSD, XAUUSD, ... M15, M30, H
      Gösterge, ikinci mum çubuğu ilk mum çubuğunun içinde olduğunda, yani sınırlarının ötesine geçmediğinde grafikte bir sinyal gösterir. Bu mum çubuğu formasyonuna İç Çubuk denir. Bu formasyon Pin Bar veya Takeover kadar popüler değildir, ancak bazen bazı tüccarlar tarafından kullanılır. Eğilime (2 hareketli ortalama) ve tersine çevirmeye (RSI ve Bollinger Bantları) göre filtreleme imkanı vardır. Çoklu para birimi paneli mevcuttur. Yardımı ile grafikler arasında kolayca geçiş yapabilirsiniz. Tica
      UPD1 Murrey Math Levels
      Vitaliy Kuznetsov
      5 (6)
      Matematiksel Murray seviyeleri Gann'ın gözlemlerine ve fiyat kareselliği teorisine dayanmaktadır. Gunn'a göre fiyat 1/8 aralıklarla hareket eder. Bu 1/8, belirli bir grafik için kendi özelliklerine sahip farklı direnç ve destek seviyeleri elde etmemizi sağlar. -2 veya +2 seviyeleri kırıldığında veya volatilite azaldığında, yeniden inşa edilirler. Hangi dönemin görüntüleneceğini seçebilirsiniz (mevcut veya tüm geçmiş). Tüm çizgiler tamponlar aracılığıyla çizilir. Blog-Link -   Murrey Math Tradin
      FREE
      UPD1 D Levels
      Vitaliy Kuznetsov
      5 (1)
      Seviye göstergesi bir önceki günün verilerine dayanır. Matematiksel formül giriş ve çıkış seviyelerini belirler.  Ticaret önerileri. Seviyeler, volatilite göründüğünde Avrupa seansının başında işlem görür. Yetersiz volatilite durumunda, çıkmak için kar almanın yarısını kullanın. Fiyat yarı karla tersine dönerse, tersine döndüğünde de yarı kar alma seviyesinde bir hedef arayın. Fiyat giriş seviyesinden sıçradıysa, ters yönde fiyat ikinci alım karına ulaşabilir. Her zaman bir kopuşa girmemeli
      FREE
      UPD1 Profile Levels MT5
      Vitaliy Kuznetsov
      5 (3)
      Gösterge, belirtilen sayıda çubuk için çalışma histogramında maksimum ve minimum fiyat hacminin (piyasa profili) seviyelerini bulur.   Kompozit profil. Histogramın yüksekliği tamamen otomatiktir ve herhangi bir enstrümana ve zaman dilimine uyarlanabilir. Yazarın algoritması kullanılır ve bilinen analogları tekrarlamaz. İki histogramın yüksekliği yaklaşık olarak mumun ortalama yüksekliğine eşittir. Akıllı uyarı (akıllı uyarı), hacim seviyesine ilişkin fiyatı bildirmenize yardımcı olur. Konsept
      Ortalama Gerçek Aralık ( ATR ), belirli sayıda gün boyunca piyasa oynaklığının bir ölçüsüdür. Fiyat aralığın sonuna ulaştığında büyük bir devam hareketi beklememelisiniz. Piyasanın yakıtının bittiği kabul edilir. Fiyat sınıra ulaşmadıysa, hala bir hareket marjı vardır. Gösterge formülü, Yüksek-Düşük seviyelerini hem toplu olarak hem de ayrı ayrı hesaplamanıza olanak tanır. Bu seviyeleri destek/direnç ve hedef olarak da kullanabilirsiniz. Giriş parametreleri. Start Day -   günün başlangıcını
      FREE
      UPD1 Pivot Levels
      Vitaliy Kuznetsov
      5 (1)
      Gösterge, grafik üzerinde bir önceki güne göre hesaplanan klasik pivot seviyelerini gösterir. Formülün hangi saatten itibaren hesaplanacağını seçebilirsiniz. Tersine çevirmek için düz bir piyasada işlem yapın. Trend olan bir piyasada bunları hedef olarak kullanın. Başarılı ticaret için stratejilerinizle birleştirin. Seviyeler tamponlar kullanılarak oluşturulur ve mevcut tüm teklif geçmişinde görüntülenir. Giriş parametreleri. Start Hour - günün başlangıcının hangi saatten itibaren dikkate a
      FREE
      Gösterge grafikte "Raylar" formasyonunu görüntüler. Bu formasyon, aynı gövdelere ve küçük gölgelere sahip iki çok yönlü mumdan oluşur. Mevcut zaman diliminde desen "Raylar" ise, x2 zaman diliminde bir Pin Bar (Doji) gibi görünecektir. Bu gösterge, kolayca değiştirebileceğiniz mantıksal olarak basit ayarlarla deseni otomatik olarak en verimli şekilde bulmak için oluşturulmuştur. Trend (2 hareketli ortalama) ve tersine çevirme (RSI ve Bollinger Bantları) ile filtreleme seçeneği vardır. Çoklu para
      UPD1 Volume Pixel
      Vitaliy Kuznetsov
      5 (3)
      Gösterge, verilen katsayılara göre düşük, yüksek, aşırı hacim bulur ve bunları belirtilen renklerle boyar. Metatrader terminalindeki standart hacim çizim işlevinin yerini alır. Mumlar ayrıca hacim renginde boyanabilir. Aşırı hacimli mumlarda maksimum yatay hacim (küme/POC) belirlenir. Konumuna bağlı olarak (itme, nötr, durdurma) kümenin de kendi rengi vardır. Küme gölgede ise ve mum aşırı hacme sahipse, o zaman oku tersine çeviririz. Uyarıyı ayarlardan etkinleştirebilirsiniz. Ayrıca, göstergede
      Gösterge, oynaklığa bağlı olarak grafikte büyük gölgeleri otomatik olarak arar ve görüntüler. Gölgeler ayrıca dalga boyu ile filtrelenir. Algoritma, fraktalın dökümünü belirtilen aralıktaki gölgeyle analiz eder ve seviyeyi görüntüler. Ayarlardan çoklu para birimi dashboard'u etkinleştirebilirsiniz. Uyarı, mevcut program veya tüm dashboard sayfası arasında seçilir. Büyük gölgelere ve fraktal seviyeyi geçenlere yönelik sinyaller ayrı ayrı açılabilir. Blog-Link -   Retest and Fake Breakout with UP
      Filtrele:
      xlxAxlx
      1362
      xlxAxlx 2024.08.10 05:34 
       

      Kullanıcı incelemeye herhangi bir yorum bırakmadı

      Vitaliy Kuznetsov
      35657
      Geliştiriciden yanıt Vitaliy Kuznetsov 2024.08.10 11:44
      Thanks for the feedback
      RvdHo
      226
      RvdHo 2023.10.10 05:07 
       

      Kullanıcı incelemeye herhangi bir yorum bırakmadı

      Vitaliy Kuznetsov
      35657
      Geliştiriciden yanıt Vitaliy Kuznetsov 2023.10.10 08:29
      Thanks for the feedback
      jonclark365
      207
      jonclark365 2023.01.22 14:20 
       

      Very good!! Thanks for sharing.

      Vitaliy Kuznetsov
      35657
      Geliştiriciden yanıt Vitaliy Kuznetsov 2023.01.22 14:48
      Thanks for the feedback
      tr4ppist
      97
      tr4ppist 2021.03.12 22:23 
       

      Kullanıcı incelemeye herhangi bir yorum bırakmadı

      Vitaliy Kuznetsov
      35657
      Geliştiriciden yanıt Vitaliy Kuznetsov 2023.01.22 14:47
      Thanks for the feedback
      İncelemeye yanıt
      Sürüm 1.50 2023.12.12
      improved the structure of alerts
      compiled a new build
      Sürüm 1.45 2023.09.05
      New build
      Sürüm 1.43 2020.10.28
      small bug in the description
      Sürüm 1.42 2020.10.08
      Add Button Mode On/Off (Default Off)