PolarizedFractalEfficiency
- Göstergeler
- Sergio D. Rocha
- Sürüm: 1.25
- Güncellendi: 22 Kasım 2021
- Etkinleştirmeler: 5
The Polarized Fractal Efficiency (PFE) was introduced by Hans Hannula in 1994. The indicator was intended to quantify the efficiency of price movement and how trendy or choppy the recent past price action has been.
This is calculated by contrasting the price traveled in the window of study against the total accumulation of movements during the same period of time.
For example: If in 10 days, an active raised from 50 to 100, by increasing it's value 5 points or dollars each session, the efficiency of the rise is greater than if the very same distance is traveled by, rising 10 on the first session, losing 7 on the following day, then, gaining 30, falling 20 the next day, recovering 30 then after retracing 15 and so forth. (10+7+30+20+30+15...etc).
According to Hans Hannula, PFE readings above zero indicates that the trend has been up. The higher the PFE the more efficient the upward movement. Conversely, PFE reading below zero indicate the price trend has been down, and the lower the PFE the more efficient the downward movement.
Readings near zero indicate price congestion, choppy, trend less, meaning inefficient movement.
PFE has low sensitivity to the size of the movements but remarks how direct the price movement is.
The base parameters are 10 for the length and 5 for the smoothing. The indicator can change the smoothing procedure (simple, exponential, smoothed and linear weighted) exponential is the original preference.
As any oscillator it can generate signals with the trend of the oscillator by it self, the cross with it's moving average, divergences, etc.
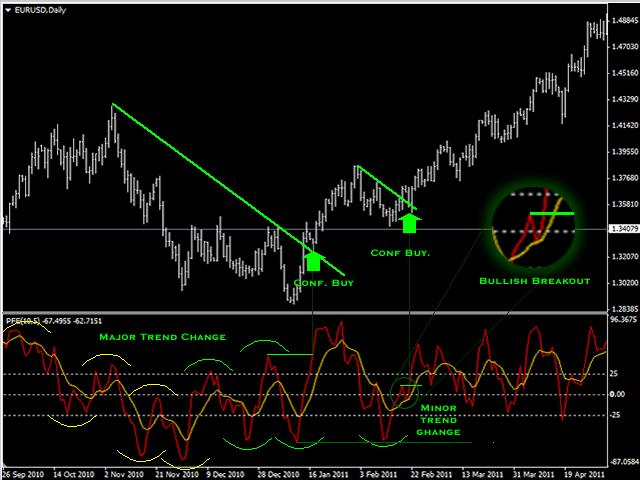
For example if the PFE change it's trend while its above zero (better if near 100) this favors the decline. Conversely if the PFE change it's trend while is below zero (better if near -100) this is considered good for price to rise.
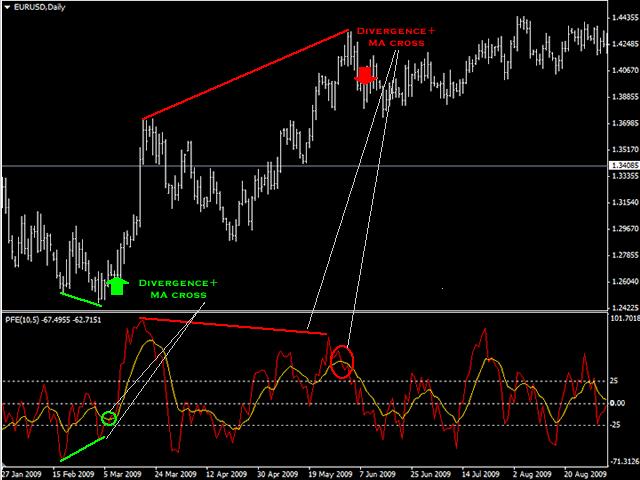
Other example is, when the PFE cross it's moving average from up to down, while is above the zero, and after showing divergence, this could be a good time to look for sells, or if the PFE cross it's moving average from down to up, while is below the zero and after show divergence, this could be a good time to think about buys.
See the screenshots for visual reference.
