• Genel bakış
  • İncelemeler (1)
  • Yorumlar
  • Yenilikler

VolumeTick

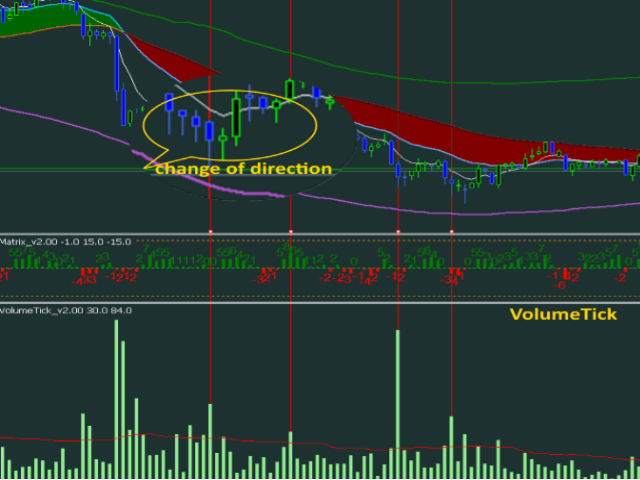
Indicator VolumeTick

https://youtu.be/tmHZKdMCMGo

made for rapid identification of possible reversal points, when the conditions of consolidation and bi-directional trading traders, the number of volumes in the market increases sharply, which shows the interest of the participants to change the direction of movement of the tool market and counts the number of ticks on each bar, made in the form of an oscillator. This way we can foresee stopping trading or trading in the other direction, or add volume when a confirmed move is made in our direction. It can be used on any timeframe and will be a good addition for any proven trading system.


https://youtu.be/UG2ZZEH9B_U

contacts for communication 777basil@mail.ru we will prepare an expert, an indicator for your task.


Önerilen ürünler
Value Chart Candlesticks
Flavio Javier Jarabeck
4.73 (11)
The idea of a Value Chart indicator was presented in the very good book I read back in 2020 , " Dynamic Trading Indicators: Winning with Value Charts and Price Action Profile ", from the authors Mark Helweg and David Stendahl. The idea is simple and the result is pure genius: Present candlestick Price analysis in a detrended way! HOW TO READ THIS INDICATOR Look for Overbought and Oversold levels. Of course, you will need to test the settings a lot to find the "correct" one for your approach. It
FREE
Girassol Sunflower MT5 Indicator
Saullo De Oliveira Pacheco
4.33 (6)
This is the famous Sunflower indicator for Metatrader5. This indicator marks possible tops and bottoms on price charts. The indicator identifies tops and bottoms in the asset's price history, keep in mind that the current sunflower of the last candle repaints, as it is not possible to identify a top until the market reverses and it is also not possible to identify a bottom without the market stop falling and start rising. If you are looking for a professional programmer for Metatrader5, please
FREE
Candlestick Pattern Teller
Flavio Javier Jarabeck
5 (1)
Minions Labs' Candlestick Pattern Teller It shows on your chart the names of the famous Candlesticks Patterns formations as soon as they are created and confirmed. No repainting. That way beginners and also professional traders who have difficulties in visually identifying candlestick patterns will have their analysis in a much easier format. Did you know that in general there are 3 types of individuals: Visual, Auditory, and Kinesthetic? Don't be ashamed if you cannot easily recognize Candlesti
Owl Smart Levels MT5
Sergey Ermolov
4.07 (28)
MT4 versiyonu  |  FAQ Owl Smart Levels Indicator , Bill Williams'ın gelişmiş fraktalları , piyasanın doğru dalga yapısını oluşturan Valable ZigZag ve kesin giriş seviyelerini gösteren Fibonacci seviyeleri gibi popüler piyasa analiz araçlarını içeren tek gösterge içinde eksiksiz bir ticaret sistemidir. pazara ve kar elde edilecek yerlere. Stratejinin ayrıntılı açıklaması Gösterge ile çalışma talimatı Baykuş Yardımcısı ticaretinde Danışman Yardımcısı Kullanıcıların özel sohbeti -> Satın aldıktan
İndikatör   "Haven Key Levels PDH PDL"   trader'ların grafik üzerinde anahtar seviyeleri görselleştirmelerine yardımcı olur. Aşağıdaki seviyeleri otomatik olarak işaretler: DO (Daily Open)   — Günün açılış seviyesi. NYM (New York Midnight)   — New York gece yarısı seviyesi. PDH (Previous Day High)   — Önceki günün en yüksek seviyesi. PDL (Previous Day Low)   — Önceki günün en düşük seviyesi. WO (Weekly Open)   — Haftalık açılış seviyesi. MO (Monthly Open)   — Aylık açılış seviyesi. PWH (Previou
FREE
Gösterge   Haven FVG   , piyasaları analiz etmek için bir araçtır ve grafikte verimsizlik alanlarını (Fair Value Gaps, FVG) tanımlamanıza olanak tanır, böylece tüccarlara fiyat analizi ve ticari kararlar almak için anahtar seviyeler sağlar. Diğer ürünler ->  BURADA Ana Özellikler: Bireysel renk ayarları: Alış FVG rengi   (Bullish FVG Color). Satış FVG rengi   (Bearish FVG Color). Esnek FVG görselleştirme: FVG aramak için maksimum mum sayısı. FVG bölgelerinin belirli bir bar sayısı kadar ek uzat
FREE
This is Gekko's Cutomized Cutomized Average Directional Index (ADX), a customized version of the famous ADX indicator. Use the regular ADX and take advantage two entry signals calculations and different ways of being alerted whenever there is potential entry or exit point. Inputs Period: Period for the ADX calculation; PlotSignalType: How will the indicator calculate entry (swing) signals: 1- ShowSwingsOnTrendLevel : Show Signals for Trend Confirmation Swings; 2- ShowSwingsOnTrendLevelDirection
Follow The Line MT5
Oliver Gideon Amofa Appiah
4.52 (29)
This indicator obeys the popular maxim that: "THE TREND IS YOUR FRIEND" It paints a GREEN line for BUY and also paints a RED line for SELL. (you can change the colors). It gives alarms and alerts of all kinds. IT DOES NOT REPAINT and can be used for all currency pairs and timeframes. Yes, as easy and simple as that. Even a newbie can use it to make great and reliable trades. NB: For best results, get my other premium indicators for more powerful and reliable signals. Get them here: https://www.m
FREE
Naked Forex Kangaroo Tail Indicator Kangaroo Tail Indicator is a pattern recognition indicator for Forex, Stocks, Indices, Futures, Commodities and Cryptos. The Kangaroo Tail is a multi-bar pattern. The Kangaroo Tail pattern is very effective and is very simple to trade. The strategy that comes with the Kangaroo Tail is based on price action. The indicator does what it was designed for: displaying Kangaroo Tail patterns.   Don't expect to follow the up and down arrows and make money . Tradin
Waves Sizer
Flavio Javier Jarabeck
3.67 (6)
Wyckoff fans, enjoy! Ideally to be used with the Weis Waves indicator, but it can be easily used alone, the Waves Sizer puts the range (in resulting Price movement) done by the Price on its market swings. You can control how accurate or loose will be the swings. This tool is very helpful for visually know how much the Price has traveled in your Timeframe. This way you can confront this level of effort with the resulting Volume, etc... Weis Waves indicator: https://www.mql5.com/en/market/produc
FREE
Adjustable Consecutive Fractals  looks for 2 or more fractals in one direction and sends out a on screen alert, sound alert and push notification, for strong reversal points . Adjustable Consecutive Fractals, shows the fractals on chart along with a color changing text for buy and sell signals when one or more fractals appear on one side of price. Adjustable Consecutive Fractals is based Bill Williams Fractals . The standard Bill Williams fractals are set at a non adjustable 5 bars, BUT withe th
Tops and Bottoms Indicator
Josue De Matos Silva
4.67 (6)
Tops & Bottoms Indicator FREE   Tops abd Bottoms:   An effective indicator for your trades The tops and bottoms indicator helps you to find  ascending and descending channel formations with indications of ascending and/or descending tops and bottoms. In addition, it  show possibles  opportunities with a small yellow circle when the indicator encounters an impulse formation. This indicator provide to you  more security and speed in making entry decisions. Also test our FREE advisor indicator:  
FREE
Wapv Price and volume
Eduardo Da Costa Custodio Santos
MT5 için WAPV Fiyat ve Hacim Göstergesi, (Wyckoff Academy Wave Market) ve (Wyckoff Academy Fiyat ve Hacim) araç setinin bir parçasıdır. MT5 için WAPV Fiyat ve Hacim Göstergesi, grafikteki hacim hareketini sezgisel bir şekilde görselleştirmeyi kolaylaştırmak için oluşturuldu. Bununla, piyasanın profesyonel bir ilgisinin olmadığı en yüksek hacim anlarını ve anları gözlemleyebilirsiniz. Piyasanın "akıllı para" hareketiyle değil, ataletle hareket ettiği anları belirleyin. Kullanıcı tarafından değişt
Do you use volume in your reading of the market? Certainly many traders use it, and do not imagine operating without it. The Color Histogram Volume Set indicator allows the user to choose the value that he considers interesting to monitor. When you pass this you will have visual confirmation and if you want you will also have the audible alert that is given by the indicator. Of course, there are other ways to try to find a high volume, such as assessing whether the volume is above av
The Volume Spread Analysis indicator is based on the original Volume Spread Analysis method. It was designed for quick and easy recognition of VSA patterns. Even though this indicator looks very simple, it is the most sophisticated tool we've ever made. It is a really powerful analytical tool that generates very reliable trading signals. Because it is very user-friendly and understandable, it is suitable for every type of trader, regardless of his experience. What is VSA? VSA - Volume Spread A
True Day
Aurthur Musendame
5 (1)
True Days is a tool designed specifically for the trader who wants to catch intraday volatility in price charts.  True day makes it easier for the trader to avoid trading in the dead zone - a period in time where markets are considered dead or non volatile. The trader can concentrate on finding opportunities only during periods of profound market movements. By default the indicator gives you a true day starting at 02:00 to 19:00 hours GMT+2. You can adjust according to your Time Zone. By deafult
FREE
Are you tired of drawing trendlines every time you're analyzing charts? Or perhaps you would like more consistency in your technical analysis. Then this is for you. This indicator will draw trend lines automatically when dropped on a chart. How it works Works similar to standard deviation channel found on mt4 and mt5. It has 2 parameters: 1. Starting Bar 2. Number of bars for calculation The   starting bar   is the bar which drawing of the trend lines will begin, while the   number of bars for c
FREE
Weis Waves
Flavio Javier Jarabeck
2.83 (18)
The original author is David Weis, an expert in the Wyckoff Method. The Weis Wave is a modern adaptation of the 1930's Wyckoff Method, another expert in Tape Reading techniques and Chart Analysis. Weis Waves takes market volume and stacks it into waves according to price conditions giving the trader valuable insights about the market conditions. If you want to learn more about this subject you can find tons of videos in YouTube. Just look for "The Wickoff Method", "Weis Wave" and "Volume Spread
FREE
RSI back arrows
Smaylle Rafael Coelho Mariano
The   RSI Back Arrows   indicator is a powerful tool designed for traders who rely on the Relative Strength Index (RSI) to identify potential market reversals. This indicator specifically highlights when the RSI has exited the   oversold   or   overbought   zones, providing clear visual signals to inform trading decisions. Key Features: Visual Cues : The indicator marks arrows on the chart when the RSI crosses back into a neutral zone, making it easy to spot potential entry and exit points. Over
FREE
Introducing the Consecutive Green/Red Candle Alert Indicator for MT5 - Your Trend Spotting Companion! Are you ready to take your trading to the next level? We present the Consecutive Green/Red Candle Alert Indicator, a powerful tool designed to help you spot trends and potential reversals with ease. Whether you're a new trader looking for clarity in the market or an experienced pro seeking additional confirmation, this indicator is your trusted companion. Key Features of the Consecutive Green
FREE
STRICTLY FOR BOOM INDEX ONLY!!!!! Here I bring the Maximum Trend Arrows OT1.0 MT5 indicator. This indicator is made up of a combination of different trend indicators for entries and exits, for entries an orange arrow will paint on the chart below the current market and a red flag for closing of trades and it produces buy arrows only. When the orange arrow appears, it will appear along with it's sound to notify you. The 1H timeframe is recommended, don't use it anywhere else than on the 1H timefr
This indicator uses the metaquotes ZigZag indicator as base to plot fibonacci extension and fibonacci retracement based in the Elliot waves. A fibonacci retracement will be plotted on every wave draw by the ZigZag. A fibonacci extension will be plotted only after the 2nd wave. Both fibonacci will be updated over the same wave tendency. Supporting until 9 consecutive elliot waves. Parameters: Depth: How much the algorithm will iterate to find the lowest and highest candles Deviation: Amount of
Donchian Channel DC is the indicator of Donchian Channels, that plots maximum and minimum values of a specific period, besides mean value line. It´s possible to configure simple period for analysis and the indicator will plot all three values. You can trade with this indicator as trend or reversal, according to each strategy. Do not let to test others indicators as soon as others expert advisors.
Donchian Pro
Paulo Henrique Faquineli Garcia
5 (3)
The Donchian Channel Channels are among the most popular tools of technical analysis, as they visually convey to the analyst the limits within which most price movement tends to occur. Channel users know that valuable information can be obtained at any time, whether prices are in the central region of a band or close to one of the border lines. One of the best known techniques to explore these concepts is Bollinger Bands. However, John Bollinger was not the only one to research the application
FREE
Segmented Volume MT5
Eduardo Da Costa Custodio Santos
MT5 Segmentli Hacim göstergesi , fiyat ve hacim analizi, VSA, VPA, Wyckoff Metodu ve Akıllı Para Sistemini kullanarak işlem yapanlara kolaylık sağlamak için oluşturulmuştur. Bölümlere ayrılmış hacim, herhangi bir Piyasada (Kripto, CFD, Forex, Vadeli İşlemler, Hisse Senetleri...) ve herhangi bir Grafik zamanında çalışır. Yorumunuzun ne kadar kolay olduğunu görün: #Yeşil: Hacim piyasa ortalamasının çok üzerinde #Koyu pembe: Ortalama hacimden daha büyük #Mavi: Pozitif normal hacim #Kırmızı: Negatif
Volumes Direction MT5
William Oswaldo Mayorga Urduy
HACİM YÖNÜ MT5 Normalde, mevcut ses seviyesi öncekinden daha yüksek olduğunda ses seviyesi göstergesi varsayılan bir renk değişikliğine sahiptir, bu önemlidir ancak çok kullanışlı değildir. Bu nedenle, bu gösterge, normal hacme ek olarak, mum yükseliş veya düşüş olduğunda, onları farklı bir renge boyar, varsayılan olarak yükseliş için mavi ve düşüş için kırmızıdır, ancak bu renkler özelleştirilebilir. Tüccar tadı. Ticaretinizi geliştirmenize yardımcı olacak diğer göstergelerime göz atmayı
Naked Forex Kangaroo Tail Pro Indicator Kangaroo Tail Pro Indicator is a pattern recognition indicator for Forex, Stocks, Indices, Futures, Commodities and Cryptos. The Kangaroo Tail is a multi-bar pattern. The Kangaroo Tail pattern is very effective and is very simple to trade. The strategy that comes with the Kangaroo Tail is based on price action. The indicator does what it was designed for: displaying Kangaroo Tail patterns.     Don't expect to follow the up and down arrows and make mone
Gösterge, tarihsel olanlarla karşılaştırılabilecek güncel teklifler oluşturur ve bu temelde bir fiyat hareketi tahmini yapar. Gösterge, istenen tarihe hızlı navigasyon için bir metin alanına sahiptir. Seçenekler: Sembol - göstergenin göstereceği sembolün seçimi; SymbolPeriod - göstergenin veri alacağı dönemin seçimi; GöstergeRenk - gösterge rengi; Ters - doğru tırnakları tersine çevirir, yanlış - orijinal görünüm; Sonraki, tarihi girebileceğiniz ve 'enter' tuşuna basarak hemen atlayab
High Low Open Close
Alexandre Borela
4.98 (42)
Bu projeyi seviyorsanız, 5 yıldız incelemesi bırakın. Bu gösterge açık, yüksek, düşük ve belirtilen fiyatlar için çizer Dönem ve belirli bir zaman bölgesi için ayarlanabilir. Bunlar birçok kurumsal ve profesyonel tarafından görünen önemli seviyelerdir. tüccarlar ve daha fazla olabileceği yerleri bilmeniz için yararlı olabilir Aktif. Mevcut dönemler şunlardır: Önceki gün. Önceki Hafta. Önceki Ay. Previous Quarter. Önceki yıl. Veya: Mevcut gün. Hafta. Şimdi Ay. Şimdiki Mahallesi. Bugün yıl.
FREE
Volume Delta Candle
Muhammad Muzaffar Hussan
Volume Delta Candles: A Comprehensive Tool for In-Depth Trading Analysis Unlock a seamless way to interpret trading experience within each candle. With Volume Delta Candles, there's no need for additional volume indicators—everything you need is built in. This advanced tool utilizes lower timeframes or live market data to present the percentage of buying versus selling volume within each candle as an intuitive color-coded bar. Before diving in, ensure you’re familiar with Volume and Volume Delta
Bu ürünün alıcıları ayrıca şunları da satın alıyor
Trend Screener Pro MT5
STE S.S.COMPANY
4.85 (78)
Trend Göstergesi, Trend Alım Satım ve Filtreleme için Çığır Açan Benzersiz Çözüm, Tüm Önemli Trend Özellikleriyle Tek Bir Araç İçinde Yerleştirildi! Forex, emtialar, kripto para birimleri, endeksler ve hisse senetleri gibi tüm sembollerde/araçlarda kullanılabilen %100 yeniden boyamayan çoklu zaman çerçevesi ve Çoklu para birimi göstergesidir. Trend Screener, grafikte noktalarla ok trend sinyalleri sağlayan etkili bir trend trend göstergesidir. Trend analizörü göstergesinde bulunan özellikler: 1.
Golden Trend Indicator MT5
Noha Mohamed Fathy Younes Badr
4.88 (16)
Golden Trend indicator  is The best indicator for predicting trend movement this indicator never lags and never repaints and never back paints    and give  arrow buy and sell    before the candle appear  and it will help you and  will make your trading decisions clearer its work on all currencies and  gold and crypto and all time frame This unique  indicator uses very secret algorithms to catch the  trends, so you can trade using this indicator and see the trend clear on charts  manual guide and
FX Power MT5 NG
Daniel Stein
5 (11)
FX Power: Daha Akıllı Ticaret Kararları için Para Birimlerinin Gücünü Analiz Edin Genel Bakış FX Power , her piyasa koşulunda başlıca para birimlerinin ve altının gerçek gücünü anlamak için vazgeçilmez bir araçtır. Güçlü para birimlerini alıp zayıf olanları satarak, FX Power ticaret kararlarınızı basitleştirir ve yüksek olasılıklı fırsatları ortaya çıkarır. İster trendlere sadık kalın ister Delta'nın aşırı değerlerini kullanarak tersine dönüşleri öngörün, bu araç ticaret tarzınıza mükemmel bir
FX Levels MT5
Daniel Stein
5 (3)
FX Levels: Tüm Piyasalar İçin Son Derece Hassas Destek ve Direnç Hızlı Bakış Döviz kurları, endeksler, hisseler veya emtialar gibi herhangi bir piyasada güvenilir destek ve direnç seviyeleri belirlemek mi istiyorsunuz? FX Levels geleneksel “Lighthouse” yöntemini ileri düzey bir dinamik yaklaşımla birleştirerek neredeyse evrensel bir doğruluk sağlar. Gerçek broker deneyimimize ve otomatik günlük güncellemeler ile gerçek zamanlı güncellemelerin birleşimine dayalı olarak, FX Levels size dönüş nok
FX Volume MT5
Daniel Stein
4.82 (17)
FX Volume: Bir Broker’ın Perspektifinden Gerçek Piyasa Duyarlılığını Deneyimleyin Kısa Özet Trading yaklaşımınızı bir adım öteye taşımak ister misiniz? FX Volume , perakende traderlar ile brokerların nasıl konumlandığını gerçek zamanlı olarak sunar—COT gibi gecikmeli raporlardan çok daha önce. İster istikrarlı kazançları hedefliyor olun, ister piyasada daha güçlü bir avantaj arayın, FX Volume önemli dengesizlikleri belirlemenize, kırılmaları (breakout) doğrulamanıza ve risk yönetiminizi iyileş
TPSproTREND PrO MT5
Roman Podpora
4.71 (17)
TPSpro TREND PRO  - is a trend indicator that automatically analyzes the market and provides information about the trend and each of its changes, as well as giving signals for entering trades without redrawing! The indicator uses each candle, analyzing them separately. referring to different impulses - up or down impulse. Exact entry points into transactions for currencies, crypto, metals, stocks, indices!  ИНСТРУКЦИЯ RUS         INSTRUCTIONS  ENG       R ecommended to use with an indicator   -
PUMPING STATION – Forex'te Kâr Pompanız! Size PUMPING STATION 'ı sunuyoruz — ticaretinizi bir kâr makinesine dönüştürecek devrim niteliğinde bir Forex göstergesi! Bu gösterge sadece bir yardımcı değil, aynı zamanda güçlü algoritmalarıyla size düzenli kazanç sağlamaya yardımcı olacak tam teşekküllü bir ticaret sistemidir. Bu ürünü satın aldığınızda, ek olarak ÜCRETSİZ olarak şunları alacaksınız: Otomatik ayarlama ve maksimum sonuç için özel ayar dosyaları. PUMPING STATION stratejisiyle nasıl tic
TPSpro RFI Levels MT5
Roman Podpora
4.53 (19)
TALİMATLAR         RUS   -        ENG       Bir gösterge ile kullanılması   önerilir       -       TPSpro   TREND PRO -   Sürüm MT4         Ticarette önemli bir unsur, bir ticaret aracını satın alma veya satma kararlarının alındığı bölgeler veya seviyelerdir. Büyük oyuncuların piyasadaki varlıklarını gizleme girişimlerine rağmen, kaçınılmaz olarak izler bırakırlar. Bizim görevimiz bu izleri nasıl tanımlayacağımızı ve doğru şekilde nasıl yorumlayacağımızı öğrenmekti. Ana işlevler:: Satıcılar ve
IX Power MT5
Daniel Stein
4.86 (7)
IX Power: Endeksler, Emtialar, Kripto Paralar ve Forex Piyasaları için İçgörüler Genel Bakış IX Power , endeksler, emtialar, kripto paralar ve forex sembollerinin gücünü analiz etmek için tasarlanmış çok yönlü bir araçtır. FX Power , tüm kullanılabilir döviz çiftlerinin verilerini kullanarak döviz çiftleri için maksimum doğruluk sağlarken, IX Power yalnızca temel sembolün piyasa verilerine odaklanır. Bu, IX Power 'ı forex dışındaki piyasalar için ideal ve daha basit forex analizleri için güven
Matrix Arrow Indicator MT5
Juvenille Emperor Limited
5 (13)
Matrix Arrow Indicator MT5 ,   forex ,   emtialar ,   kripto   para birimleri ,   endeksler ,   hisse senetleri   gibi tüm sembollerde/araçlarda kullanılabilen   %100 yeniden boyamayan   çoklu zaman çerçevesi göstergesini izleyen benzersiz bir 10'u 1 arada trenddir.  Matrix Arrow Indicator MT5 , mevcut eğilimi erken aşamalarında belirleyecek ve aşağıdakiler gibi 10'a kadar standart göstergeden bilgi ve veri toplayacaktır: Ortalama Yönlü Hareket Endeksi (ADX) Emtia Kanal Endeksi (CCI) Klasik Hei
This indicator is based on the mathematics of the great trader W.D. Ganna. With its help, you can easily find strong levels by analyzing swings to find the optimal entry point. The indicator works on all instruments and all timeframes. The indicator is fully manual and has control buttons. All you need to do is press the NEW button, a segment will appear, which you can place on any movement, swing or even 1 candle that you want to analyze. By placing the segment, press the OK button. A grid (th
Support And Resistance Screener, MetaTrader için tek bir gösterge içinde birden fazla araç sağlayan tek bir Düzey göstergesindedir. Kullanılabilir araçlar şunlardır: 1. Piyasa Yapısı Eleme Aracı. 2. Geri Çekilme Bölgesi Boğa. 3. Geri Çekilme Bölgesi Ayı. 4. Günlük Pivot Noktaları 5. haftalık Pivot Noktaları 6. aylık Pivot Puanları 7. Harmonik Modele ve hacme dayalı Güçlü Destek ve Direnç. 8. Banka Seviyesi Bölgeleri. SINIRLI SÜRELİ TEKLİF : YG Destek ve Direnç Göstergesi sadece 50 $ ve ömür boyu
Bu gösterge paneli, seçilen semboller için mevcut en son   harmonik kalıpları   gösterir, böylece zamandan tasarruf edersiniz ve daha verimli olursunuz /   MT4 sürümü . Ücretsiz Gösterge:   Basic Harmonic Pattern Gösterge sütunları Symbol :   seçilen semboller görünecektir Trend:   yükseliş veya düşüş Pattern :   desen türü (gartley, kelebek, yarasa, yengeç, köpekbalığı, cypher veya ABCD) Entry :   giriş fiyatı SL:   zararı durdur fiyatı TP1:   1. kar alma fiyatı TP2:   2. kar alma fiyatı TP
Top indicator for MT5   providing accurate signals to enter a trade without repainting! It can be applied to any financial assets:   forex, cryptocurrencies, metals, stocks, indices .  Watch  the video  (6:22) with an example of processing only one signal that paid off the indicator! MT4 version is here It will provide pretty accurate trading signals and tell you when it's best to open a trade and close it. Most traders improve their trading results during the first trading week with the help of
Gold Stuff mt5
Vasiliy Strukov
4.92 (173)
Gold Stuff mt5, özellikle altın için tasarlanmış bir trend göstergesidir ve herhangi bir finansal enstrümanda da kullanılabilir. Gösterge yeniden çizilmez ve gecikmez. Önerilen zaman dilimi H1. Ayarları ve kişisel bir bonusu almak için satın alma işleminden hemen sonra benimle iletişime geçin!  Güçlü Destek ve Trend Tarayıcı göstergemizin ücretsiz bir kopyasını pm'den alabilirsiniz. Ben!   AYARLAR Ok Çiz - açık kapalı. grafik üzerinde oklar çizmek. Uyarılar - sesli uyarılar kapalı. E-posta b
This indicator identifies and displays zones, as it were areas of strength, where the price will unfold. The indicator can work on any chart, any instrument, at any timeframe. The indicator has two modes. The indicator is equipped with a control panel with buttons for convenience and split into two modes. Manual mode: To work with manual mode, you need to press the NEW button, a segment will appear. This segment is stretched over the movement and the LVL button is pressed. The level is displayed
Gold Trend 5
Sergei Linskii
3.5 (2)
Altın Trend - bu iyi bir hisse senedi teknik göstergesidir. Gösterge algoritması, bir varlığın fiyat hareketini analiz eder ve oynaklığı ve potansiyel giriş bölgelerini yansıtır. En iyi gösterge sinyalleri: - SATIŞ için = kırmızı histogram + kırmızı KISA işaretçi + aynı yönde sarı sinyal oku. - AL için = mavi histogram + mavi UZUN işaretçi + aynı yönde aqua sinyal oku. Göstergenin faydaları: 1. Gösterge yüksek doğrulukta sinyaller üretir. 2. Onaylanmış bir ok sinyali yalnızca trend değişt
FX Dynamic: Özelleştirilebilir ATR Analiziyle Volatilite ve Trendleri Takip Edin Genel Bakış FX Dynamic , ortalama gerçek aralık (ATR) hesaplamalarını kullanarak günlük ve gün içi volatilite hakkında rakipsiz bilgiler sağlayan güçlü bir araçtır. 80%, 100%, 130% gibi net volatilite eşikleri ayarlayarak, piyasa olağan hareketlerinin ötesine geçtiğinde hızlı şekilde uyarı alabilir ve potansiyel kazanç fırsatlarını süratle tespit edebilirsiniz. FX Dynamic , brokerınızın zaman dilimine uyum sağlaya
Öncelikle, bu Ticaret Aracının Non-Repainting, Non-Redrawing ve Non-Lagging Gösterge olduğunu vurgulamakta fayda var, bu da onu profesyonel ticaret için ideal hale getiriyor. Çevrimiçi kurs, kullanıcı kılavuzu ve demo. Akıllı Fiyat Hareketi Kavramları Göstergesi, hem yeni hem de deneyimli tüccarlar için çok güçlü bir araçtır. İleri ticaret fikirlerini, Inner Circle Trader Analizi ve Smart Money Concepts Ticaret Stratejileri gibi 20'den fazla kullanışlı göstergeyi bir araya getirerek bir araya
Atomic Analyst MT5
Issam Kassas
4.32 (19)
Öncelikle belirtmek gerekir ki bu Ticaret Göstergesi Yeniden Çizim Yapmaz, Gecikmez ve Gecikme Göstermez, bu da hem manuel hem de robot ticareti için ideal hale getirir. Kullanıcı kılavuzu: ayarlar, girişler ve strateji. Atom Analisti, Piyasada Daha İyi Bir Avantaj Bulmak İçin Fiyatın Gücünü ve Momentumunu Kullanan PA Fiyat Hareketi Göstergesidir. Gürültüleri ve Yanlış Sinyalleri Kaldırmaya ve Ticaret Potansiyelini Artırmaya Yardımcı Olan Gelişmiş Filtrelerle Donatılmıştır. Birden fazla katmanl
Trend Line Map Pro MT5
STE S.S.COMPANY
4.09 (11)
Trend Line Map indicator is an addons for   Trend Screener Indicator . It's working as a scanner for all signals generated by Trend screener ( Trend Line Signals ) . It's a Trend Line Scanner based on Trend Screener Indicator.  If you don't have Trend Screener Pro Indicator,   the Trend Line Map Pro will not work.     LIMITED TIME OFFER : Trend Line Map Indicator is available for only 50 $ and lifetime. ( Original price 125$ ) By accessing to our MQL5 Blog,  you can find all our premium indicat
PZ Trend Trading MT5
PZ TRADING SLU
3.8 (5)
Capture every opportunity: your go-to indicator for profitable trend trading Trend Trading is an indicator designed to profit as much as possible from trends taking place in the market, by timing pullbacks and breakouts. It finds trading opportunities by analyzing what the price is doing during established trends. [ Installation Guide | Update Guide | Troubleshooting | FAQ | All Products ] Trade financial markets with confidence and efficiency Profit from established trends without getting whip
Easy Breakout MT5
Mohamed Hassan
5 (3)
After your purchase, feel free to contact me for more details on how to receive a bonus indicator called VFI, which pairs perfectly with Easy Breakout for enhanced confluence!     Easy Breakout MT5   is a powerful price action trading system built on one of the most popular and widely trusted strategies among traders: the   Breakout strategy ! This indicator delivers crystal-clear Buy and Sell signals based on breakouts from key support and resistance zones. Unlike typical breakout indicators
Quantum TrendPulse
Bogdan Ion Puscasu
5 (13)
SuperTrend   ,   RSI   ve   Stochastic'in   gücünü tek bir kapsamlı göstergede birleştirerek işlem potansiyelinizi en üst düzeye çıkaran nihai işlem aracı olan   Quantum TrendPulse'u   tanıtıyoruz. Hassasiyet ve verimlilik arayan yatırımcılar için tasarlanan bu gösterge, piyasa trendlerini, momentum değişimlerini ve en uygun giriş ve çıkış noktalarını güvenle belirlemenize yardımcı olur. Temel Özellikler: SuperTrend Entegrasyonu:   Güncel piyasa trendlerini kolayca takip edin ve karlılık dalgası
MetaForecast M5
Vahidreza Heidar Gholami
5 (3)
MetaForecast, fiyat verilerindeki harmonileri kullanarak herhangi bir piyasanın geleceğini tahmin eder ve görselleştirir. Piyasa her zaman tahmin edilemezken, fiyatlarda bir desen varsa, MetaForecast geleceği mümkün olduğunca doğru bir şekilde tahmin edebilir. Benzer ürünlere göre, MetaForecast piyasa eğilimlerini analiz ederek daha kesin sonuçlar üretebilir. Giriş Parametreleri Past size (Geçmiş boyut) MetaForecast'ın gelecekteki tahminler oluşturmak için kullandığı çubuk sayısını belirtir. Mo
RelicusRoad Pro MT5
Relicus LLC
4.78 (18)
Şimdi 147 $ (birkaç güncellemeden sonra 499 $ 'a yükseliyor) - Sınırsız Hesaplar (PC'ler veya Mac'ler) RelicusRoad Kullanım Kılavuzu + Eğitim Videoları + Özel Discord Grubuna Erişim + VIP Durumu PİYASAYA BAKMAK İÇİN YENİ BİR YOL RelicusRoad, forex, vadeli işlemler, kripto para birimleri, hisse senetleri ve endeksler için dünyanın en güçlü ticaret göstergesidir ve yatırımcılara kârlı kalmaları için ihtiyaç duydukları tüm bilgileri ve araçları sağlar. Başlangıç ​​seviyesinden ileri seviyeye ka
Timeframes Trend Scanner is a trend analyzer or trend screener indicator that helps you know the trend in all timeframes of symbol you're watching. This indicator provides clear & detailed analysis results on a beautiful dashboard, let you able to use this result right away without need to do any additional analysis. Please note that this indicator doesn't work with Strategy Tester. Sorry for that! How it works Step 1: Calculate values of 23 selected & trusted technical indicators (Oscillator &
EXCLUSIVE! JUST  10 COPIES  AVAILABLE!   BONUS AUX VIP Club 2024 : Include EA CAP, CEP, LDH, PSC307 & AO4C to enhance the performance of this tool to its maximum potential  Click Here to Download Files   ( for users only ) FREE Trading Education Available Daily via Zoom --- For More Info or Instant Message Click link ---  https://t.me/abcdwave Transform your trading with the "Five Magic Bullets" Indicator, tailored for traders who embrace the power of Elliott Wave Chaos Theory.
Bill Williams Advanced
Siarhei Vashchylka
5 (9)
Bill Williams Advanced is designed for automatic chart analysis using Bill Williams' "Profitunity" system. The indicator analyzes four timeframes at once. Manual (Be sure to read before purchasing) Advantages 1. Automatically analyzes the chart using the "Profitunity" system of Bill Williams. The found signals are placed in a table in the corner of the screen. 2. Equipped with a trend filter based on the Alligator indicator. Most of the system signals are recommended to be used only according t
- Lifetime update free -   Real price is 80$   - 25% Discount ( It is 59$ now ) Contact me for instruction, any questions! Related Product:  Gold Trade Expert MT5 - Non-repaint - I just sell my products in Elif Kaya Profile, any other websites are stolen old versions, So no any new updates or support. Introduction The breakout and retest strategy is traded support and resistance levels. it involves price breaking through a previous level.  The break and retest strategy is designed to help trade
Yazarın diğer ürünleri
ExtremeTMALine
Vasilii Luchnikov
4.83 (6)
Hız için biraz değişti. ilgilenen yeni bir danışman için test ediciler gereklidir, bana e-posta ile yazın 777basil@mail.ru Gösterge, geçmişteki fiyat değişikliklerine göre hesaplanır ve matematiksel olarak hesaplanır, veriler her tekrar alındığında yeniden hesaplanır. Farklı zaman dilimlerinde kullanılabilir. Göstergenin sınırlarından% 70 oranında fiyat hareketi veya konsolidasyon yönünde bir değişiklik var. Bu şekilde, tekneyi trendde ve kanalın ortasında sınırlarından ticaret yapabilirsini
FREE
Mtrx2tompson
Vasilii Luchnikov
The indicator is based on indicators built-in standard indicators, the indicator take into account the current indicators 30 indicators and give a signal to buy or sell, the General trend of all trends of other indicators. In the input parameters, you can configure special parameters for each indicator. the indicator is executed in the form of an oscillator and shows the General trend and the preponderance of all indicators in one or the other direction. https://youtu.be/UG2ZZEH9B_U
FREE
The DuettoFXTompson indicator is designed to work with two instruments that have a high level of correlation. the indicator can be used for pair trading on currencies, stocks, and other financial instruments. The indicator shows the moment when the instruments diverge and the sum of the two instruments (yellow line). additionally, the parameter of the Average MA value is calculated. Recommended timeframe for M5 operation. Contacts for communication 777basil@mail.ru we will prepare an expert, an
FREE
hello. The indicator shows the levels of change in the spread per unit of time when its values are higher. Practice shows that the change in volumes is associated with the warning and advance of speculative activity, especially at key moments: Fed news, oil news, speeches by leaders of the IDR countries.   We are very happy to present new developments. Thanks. 
FREE
Ind2tompson
Vasilii Luchnikov
The 2indtompson indicator is an indicator for comparing two instruments for determining volumes, for balancing in pair trading or arbitrage trading, prepared from an analog version for the MT4 terminal. So if you need to compare how much two instruments will weigh and you don't know how to do it, then put an indicator on the chart and it will automatically calculate the volumes needed for balancing. Additionally, the indicator shows the state of the instruments relative to each other - Divergenc
FREE
MaxlotTomson
Vasilii Luchnikov
5 (2)
Good afternoon. Today we offer the maxlottomson indicator to determine the maximum volume that you can put up for purchase or sale, if you look at your deposit level. This indicator is convenient to use for News trading, when you need to determine the entry point on a high-speed movement and calculate the risk level as a percentage of the deposit, the maxlottomson indicator shows the maximum value of the LOT volume for your deposit that you can use for trading.
FREE
Добрый день. Сегодня добавили вспомогательный индикатор тренда DveMashkiTompson, идея взята из аналога МТ4 и перенесена на МТ5, используется совместно с индикаторами Тренда ТМА и МА, рисует красные и зеленые области в зависимости от направления рынка. Тренд вверх -зеленые области, тренд вниз -красные.Области основываются на пересечении индикатора МА, таким образом данный индикатор дает информацию графического содержания для более быстрой оценки ситуации и принятия решения.
FREE
Привет. Сегодня представляем индикатор корреляции -  SynchroWindowTomson. Индикатор в одном окне показывает движение нескольких инструментов, по отношению друг к другу, удобно определять направление и изменение, особенно когда вы работаете с целым портфелем разных инструментов и нужно определить какой из них тянет результат назад и движется в другую сторону. Так же видны точки разворота спреда.
FREE
Hi. PortfolioHedgingStopOrderOneSymbol-trend EA for opening orders from mid-channel on the third wave Elliot, is working on the breakdown of the level from a custom indicator TMA channel width with fixed S / L and T / P. this EA is designed to determine the best entry point into the market after the correction. if you have confirmation of a strong trend movement, but if you are a novice and still doubt the correctness of your actions, it is always better to wait for the correction to finish and
Hello. CatchCandleLimitOrderOneSymbol-flat expert Advisor, for opening orders from the channel borders to the center, works on pullbacks from the support and resistance levels, from the custom channel width indicator TMA, with a fixed S/L and T / P. The EA is designed to trade off the levels when a particular trend movement, and is no doubt the continuation of the trend, the Levels are shifted automatically with the price based on the channel boundaries and the extreme price deviation for a bet
https://youtu.be/Ze9zPpYtIrI GridCatchCandleLimitOrderOneSymbol is a Grid flat expert Advisor for opening orders from the channel borders to the center. it works on pullbacks from the support and resistance levels, from the custom TMA channel width indicator, with fixed S/L and T / P. The EA is designed to trade off the levels when a particular trend movement, and is no doubt the continuation of the trend, the Levels are shifted automatically with the price based on the channel boundaries and
The CatchPositionByStopOrder trading expert is designed to work on a trending market when the direction of trading is known, you can trade both SELLSTOP and BUYSTOP orders, and you can trust the expert himself to choose the direction. Sets pending STOP orders and moves them behind the price to determine the most effective entry point. The recommended timeframe for trading is M5/M15/H1. In the expert Advisor, you can work with fixed S/l and T/p, as well as with the help of a trawl. if T / p=0, t
Good afternoon. Today we present a new indicator PointIntoChannelTOMSON https://youtu.be/dmgtVwX3nvg https://youtu.be/Wr7N2WEY8lA -this indicator is calculated from the channel to the level of price deviation in the direction of buying and selling, the green and red window of indicators, respectively. The higher the deviation level, the greater the probability of a reversal. The indicator readings are recalculated with each new bar and it is recommended to use it only as an auxiliary one Con
UturnAnalysis
Vasilii Luchnikov
Good afternoon. UturnAnalysis - to check the quality of the indicator WE HAVE LAUNCHED A TRIAL VERSION free distribution of signals about reversals based on this indicator for the futures and stock markets of the MICEX write to tech support, me 777basil@mail.ru , or in the comments your email address and we will send you the account details where the alerts are sent, for free. https://youtu.be/q228LvLec-Y we put it on several tools at once https://youtu.be/Wr7N2WEY8lA will save you time at t
Filtrele:
Aleksandr Tamonin
4107
Aleksandr Tamonin 2021.01.23 20:30 
 

Kullanıcı incelemeye herhangi bir yorum bırakmadı

İncelemeye yanıt
Sürüm 3.1 2021.06.07
скорректировали скорость обработки информации и отладили синхронизацию
Sürüm 2.2 2021.02.20
Добрый день. Добавили в описательную часть адреса для обратной связи с технической поддержкой для оперативного устранения сбоев.Спасибо.
Sürüm 2.1 2020.10.02
Добавили адрес тех.поддержки. Один мод по вашему техническому заданию бесплатно.
Support: likinvest_sup@mail.ru