• Genel bakış
  • İncelemeler (6)
  • Yorumlar
  • Yenilikler

ExtremeTMALine

4.8
Hız için biraz değişti. ilgilenen yeni bir danışman için test ediciler gereklidir, bana e-posta ile yazın 777basil@mail.ru


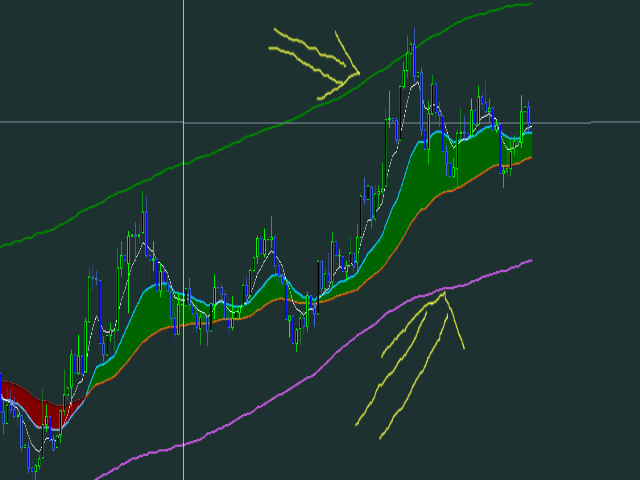
Gösterge, geçmişteki fiyat değişikliklerine göre hesaplanır ve matematiksel olarak hesaplanır, veriler her tekrar alındığında yeniden hesaplanır. Farklı zaman dilimlerinde kullanılabilir. Göstergenin sınırlarından% 70 oranında fiyat hareketi veya konsolidasyon yönünde bir değişiklik var. Bu şekilde, tekneyi trendde ve kanalın ortasında sınırlarından ticaret yapabilirsiniz. Direnç / destek seviyelerini belirlemek için trend ticaretinde kullanmak daha iyidir. videoda, göstergenin nasıl çalıştığını görebilirsiniz:


İletişim için iletişim 777basil@mail.ru göreviniz için bir uzman, bir gösterge hazırlayacağız.
İncelemeler 6
BSantiago72
70
BSantiago72 2022.11.18 13:07 
 

this is a wonderful indicator! Backtest, adjust and see for yourself. Thanks LiK’e INVEST!

13qwerty
55
13qwerty 2022.02.07 14:42 
 

Может и плагиат, но для использования гораздо лучше оригинального ВВ. Если бы можно было на графике установить индюк для страших ТФ, то цены бы не было. В сочетании с метром и уровнями полноценная безубыточная стратегия. Автору спасибо!

Luke Perrett
3386
Luke Perrett 2021.02.25 13:38 
 

Author is very helpful and considerable.

Önerilen ürünler
The indicator plots a curve of the difference between the values ​​of two trading instruments (currency pairs). The purpose of the indicator is to observe the processes of divergence and convergence of the values ​​of two trading instruments. The results obtained can be used for trading strategies of statistical arbitrage, pair trading, correlation, and others. Trading strategy The indicator is attached to the chart of any trading instrument. In the input parameters, the names of trading i
FREE
A professional tool for trading - the divergence indicator between the WPR and the price, which allows you to receive a signal about a trend reversal in a timely manner or catch price pullback movements (depending on the settings). The indicator settings allow you to adjust the strength of the divergence due to the angle of the WPR peaks and the percentage change in price, which makes it possible to fine-tune the signal strength. The indicator code is optimized and is tested very quickly as par
FREE
Curver Arrows
Francis Dube
4 (9)
This indicator is a straight port of a well known MetaTrader 4 indicator that is freely available on the Internet. It does not redraw at all. It implements a type of breakout strategy. The arrows indicate market direction. Use the indicator on M15 charts and higher. The indicator draws two bands near price action and generates signals when the price closes below the lower band and also above the upper band. The indicator uses periodic highs and lows to calculate upper and lower threshold bands.
FREE
Divergence Force Diverjans Göstergesi Açıklama Divergence Force , bir varlığın fiyatı ile MACD (Hareketli Ortalama Yakınsama Iraksama) arasındaki uyumsuzlukları belirlemek için tasarlanmış bir göstergedir. Bu gösterge, fiyat ve MACD'nin zirve ve dip noktalarına otomatik olarak trend çizgileri çizer ve potansiyel ticaret fırsatlarını vurgular. Temel Özellikler Otomatik Uyumsuzluk Tespiti : Gösterge, fiyat ve MACD arasındaki boğa ve ayı uyumsuzluklarını otomatik olarak tespit eder. Trend Çizgisi T
FREE
Just another   Auto Fibonacci Retracement indicator . However, this is the most   Flexible   &   Reliable   one you can find for FREE. If you use this indicator and you like it, please leave a review/comment. If you are looking for a more advanced Fibo indicator, check this Free  Trend-Based Fibo indicator . ### FEATURES ### Auto-calculate up to 7 Fibonacci levels on your customized frame. Adjust levels as your need. Use High/Low price or  Open/Close price to calculate. Freeze the levels and don
FREE
SDivergence
Mobin Zarekar
1 (1)
SDivergence Göstergesi, MACD ve Stokastik (şimdilik) için düzenli sapmaları ve gizli sapmaları hesaplar ve gösterir. Bu göstergenin yararı, çoklu giriş değişkenleridir. Bu girişleri kullanarak, stratejinize daha uyarlanabilir RD ve HD'ler elde etmek için değişiklik yapabilirsiniz. Rehber : 1- Önce istediğiniz osilatörü (MACD veya Stokastik veya Her İkisi) grafiğe koyun. 2- SDivergence göstergesini çalıştırın ve SDivergence giriş penceresine daha önce koyduğunuz osilatörün karşılık gelen a
FREE
Original MACD
Kirill Paskhin
5 (4)
Moving Average Convergence/Divergence — схождение/расхождение скользящих средних — технический индикатор, разработанный Джеральдом Аппелем (Gerald Appel), используемый в техническом анализе для проверки силы и направления тренда, а также определения разворотных точек. Встроенный в MetaTrader 5 индикатор MACD не соответствует задумке автора (Gerald Appel): -линия MACD графически изображена в виде гистограммы, однако гистограммой отражается разница между линией MACD и сигнальной линией;  -сигнал
FREE
PZ The Zone MT5
PZ TRADING SLU
5 (1)
This indicator displays buy or sell signals according to Bill Williams' definition of the Trading Zone. [ Installation Guide | Update Guide | Troubleshooting | FAQ | All Products ] Easy to use and understand Avoid trading flat markets Deterministic indicator with clear rules The indicator is non-repainting It implements alerts of all kinds It has straightforward trading implications. A blue arrow is a buy signal A red arrow is a sell signal According to Bill Williams trading in the zone helps t
FREE
Divergence RSI Trader is based on divergences in the chart and indicator (RSI Level 14). Divergence RSI Trader's strategy to find lows and highs on the chart and RSI indicator, analyze them and then open positions. EA was tested in the EURUSD H1 in the strategy tester and adjusted to this currency by default. EA has also been tested with other settings at GBPUSD M5 for 10 years and completed with good results. Because this is a free version, there will be no more tests and only updates. Please
FREE
MACD divergence indicator finds divergences between price chart and MACD indicator and informs you with alerts (popup, mobile notification or email) . Its main use is to find trend reversals in the chart. Always use the divergence indicators with other technical assets like support resistance zones, candlestick patterns and price action to have a higher possibility to find trend reversals. Three confirmation type for MACD divergences: MACD line cross zero level Price returns to previous H/L Crea
FREE
Trend Yakalayıcı: Alarm İndikatörü ile Trend Yakalayıcı Stratejisi, piyasa trendlerini ve potansiyel giriş ve çıkış noktalarını belirlemede yardımcı olan çok yönlü bir teknik analiz aracıdır. Piyasa koşullarına uyum sağlayarak trend yönünün net görsel temsili için dinamik bir Trend Yakalayıcı Stratejisi sunar. Tüccarlar tercihlerine ve risk toleranslarına göre parametreleri özelleştirebilirler. Gösterge, trendleri tanımlamaya yardımcı olur, potansiyel ters dönüşleri sinyaller, trailing stop m
FREE
A professional tool for trading - the divergence indicator between the  MACD and the price, which allows you to receive a signal about a trend reversal in a timely manner or catch price pullback movements (depending on the settings). The indicator settings allow you to adjust the strength of the divergence due to the angle of the  MACD peaks and the percentage change in price, which makes it possible to fine-tune the signal strength. The indicator code is optimized and is tested very quickly as
FREE
Free automatic Fibonacci is an indicator that automatically plots a Fibonacci retracement based on the number of bars you select on the BarsToScan setting in the indicator. The Fibonacci is automatically updated in real time as new highest and lowest values appears amongst the selected bars. You can select which level values to be displayed in the indicator settings. You can also select the color of the levels thus enabling the trader to be able to attach the indicator several times with differe
FREE
LT Regresyon Kanalını keşfedin, Fibonacci analizi, Zarf analizi ve Fourier ekstrapolasyonunun öğelerini birleştiren güçlü bir teknik gösterge. Bu gösterge, Fibonacci analizi ile aşırı alım ve aşırı satım seviyelerini tanımlamada hassasiyeti artırırken, pazar volatilitesini değerlendirmek amacıyla tasarlanmıştır. Ayrıca pazar hareketlerini tahmin etmek için bu göstergelerin verilerini entegre ederek Fourier ekstrapolasyonunu kullanır. Çok yönlü aracımız, diğer göstergelerle bağımsız veya birlikt
FREE
This is an ordinary MACD indicator displayed in the main window according to the selected chart style, i.e. Bars, Candlesticks or Line. When you switch the chart type, the indicator display also changes. Unfortunately I could not improve the chart type switching speed. After switching, there are delays before the arrival of a new tick. The indicator parameters Fast EMA period Slow EMA period Signal SMA period Applied price
FREE
MACD indicators https://mql5.com This MACD indicator looks slightly different from the MACD indicator found in many other charting software. When the value of the signal line parameter is greater than the value of the MACD parameter, the indicator will give a buy prompt, and when the signal line parameter is less than the value of the MACD parameter, the indicator will give a sell prompt.
FREE
This indicator is an automated version of the Fibonacci retracement (Fib) indicator. Deciding the best areas to use when drawing the fib can be tricky and this  indicator was made with that in mind. When you drop it on the chart it will automatically choose the best points to draw the fib with, but in case you aren't satisfied with those regions, you can adjust it as you wish.
FREE
A professional tool for trading - the divergence indicator between the MACD and the price, which allows you to receive a signal about a trend reversal in a timely manner or catch price pullback movements (depending on the settings). The indicator settings allow you to adjust the strength of the divergence due to the angle of the MACD peaks and the percentage change in price, which makes it possible to fine-tune the signal strength. The indicator code is optimized and is tested very quickly as p
FREE
Yenilikçi bir otomatik ticaret aracı olan HydraAlchemist ile tanışın. Bu son teknoloji ürünü Uzman Danışman (EA), finansal piyasalarda gelecek vaat eden ticaret fırsatlarını belirlemek için birden fazla teknik göstergeyi ustaca birleştirir. MACD, stokastik, RSI gibi göstergelerden elde edilen sinyalleri kendi mantığımızla irdeleyerek, piyasa trendlerini ve dönüm noktalarını doğru kavrayarak karı maksimuma çıkarmayı hedefliyoruz. 'HydraAlchemist'in gerçek gücü, gerçek ticaret stratejilerine da
FREE
This EA uses the RVI Crossovers. A crossover above the signal line is a bullish indicator, while a crossover below the signal line is a bearish indicator. The Relative Vigor Index (RVI) is a momentum indicator used in technical analysis. It measures the strength of a trend by comparing a security's closing price to its trading range while smoothing the results using a simple moving average (SMA). The Relative Vigor Index is considered a leading indicator, meaning it changes before the trend
FREE
Macd Rsi
Ignacio Agustin Mene Franco
macd rsi It is a macd indicator added to the rsi to capture perfect entries in the average crossovers! As seen in the indicator, it has 2 lines, one of gold color and the other violet line, where the cross of the violet with the gold downwards is a sell signal when it crosses the violet up from the gold it is a buy signal! very good to make shorts works for forex markets and synthetic indices It is used in any temporality! Good profit! World Investor.
A professional tool for trading - the divergence indicator between the  Stochastic and the price, which allows you to receive a signal about a trend reversal in a timely manner or catch price pullback movements (depending on the settings). The indicator settings allow you to adjust the strength of the divergence due to the angle of the  Stochastic peaks and the percentage change in price, which makes it possible to fine-tune the signal strength. The indicator code is optimized and is tested ver
FREE
A professional tool for trading - the divergence indicator between the RSI and the price, which allows you to receive a signal about a trend reversal in a timely manner or catch price pullback movements (depending on the settings). The indicator settings allow you to adjust the strength of the divergence due to the angle of the RSI peaks and the percentage change in price, which makes it possible to fine-tune the signal strength. The indicator code is optimized and is tested very quickly as par
FREE
The Moving Average Convergence Divergence (MACD) işlem stratejisi, momentum ve trend yönündeki değişiklikleri belirlemek için kullanılan popüler bir teknik analiz aracıdır. MACD, 26 periyotlu üssel hareketli ortalamanın (EMA) 12 periyotlu EMA'dan çıkarılmasıyla hesaplanır. Ardından, "sinyal çizgisi" olarak adlandırılan 9 periyotlu EMA MACD'nin üzerine çizilir ve alım satım sinyalleri için bir tetikleyici olarak görev yapar. MACD, MACD hattı sinyal çizgisinin üzerindeyken boğa bölgesinde ve altın
FREE
Infinity'nin para birimlerinin gücünü ölçen bu yenilikçi gösterge, scalper'lar ve uzun vadeli ticaret yapan tüccarlar için vazgeçilmez bir yardımcıdır. Para birimlerinin Güç / zayıflık analiz sistemi uzun zamandır bilinmektedir ve dünyanın önde gelen tüccarları tarafından piyasada kullanılmaktadır. Herhangi bir arbitraj ticareti bu analiz olmadan tamamlanamaz. Göstergemiz, temel para birimlerinin birbirine göre gücünü kolayca belirler. Tüm para birimlerinde veya mevcut para birimlerinde çizgi g
FREE
OsMA DA
Vitaly Dodonov
Что такое OsMA DA?   Индикатор OsMA DA – это осциллятор, который построен на показаниях другого осциллятора – MACD. OsMA DA показывает расхождение между сигнальной линией MACD и его гистограммой. Момент пересечения гистограммы и линии – это нулевая отметка OsMA.   Если гистограмма MACD поднимается выше линии, то гистограмма самого OsMA DA поднимается выше нулевой отметки. В обратной ситуации OsMA DA демонстрирует отрицательные значения.   OsMA DA более узконаправленный индикатор, чем MACD. OsMA
FREE
The   OHLC indicator   shows the current and historical values of High, Low, Open, Close and Mid for a specific time period. It can plot the current values or the values from the previous session. The indicator's range can be calculated from a daily, weekly, monthly, or user-specified session. Levels High  of the current or previous session. Low  of the current or previous session. Open  of current or previous session. Close  of the current or previous session. Midpoint  of the current or pre
FREE
SSACD - Singular Spectrum Average Convergence/Divergence This is an analogue of the MACD indicator based on the Caterpillar-SSA ( Singular Spectrum Analysis ) method. Limited version of the SSACD Forecast indicator. Limitations include the set of parameters and their range. Specificity of the method The Caterpillar-SSA is an effective method to handle non-stationary time series with unknown internal structure. The method allows to find the previously unknown periodicities of the series and mak
FREE
Paula Bollinger Bands Strategy
Francisco Gomes Da Silva
4 (2)
Bollinger bands out/in strategy A strategy created by Joe Ross, and very useful for finding trades when the market is overloaded. Indicator You don't need to find where there are entries on the chart, this indicator shows them for you. The entrance The trade is confirmed when the price closes outside the bollinger bands on a candle and the candle after the price closes inside the bands. comment I want to improve this indicator, so you can help me sending me your reviews and comments, thanks :).
FREE
This indicator draws regular bullish and bearish divergences in real-time onto the charts. The algorithm to detect those divergences is based on my 10+ years experience of detecting divergences visually. The divergences are drawn as green and red rectangles on the charts. You can even do forward testing in the visual mode of the strategy tester. This FREE Version is restricted to EURUSD and GBPUSD. The full version without restrictions is here:  https://www.mql5.com/en/market/product/42758 Par
FREE
Bu ürünün alıcıları ayrıca şunları da satın alıyor
Öncelikle belirtmek gerekir ki bu Ticaret Göstergesi Yeniden Çizim Yapmaz, Gecikmez ve Gecikme Göstermez, bu da hem manuel hem de robot ticareti için ideal hale getirir. Kullanıcı kılavuzu: ayarlar, girişler ve strateji. Atom Analisti, Piyasada Daha İyi Bir Avantaj Bulmak İçin Fiyatın Gücünü ve Momentumunu Kullanan PA Fiyat Hareketi Göstergesidir. Gürültüleri ve Yanlış Sinyalleri Kaldırmaya ve Ticaret Potansiyelini Artırmaya Yardımcı Olan Gelişmiş Filtrelerle Donatılmıştır. Birden fazla katmanl
Öncelikle, bu Ticaret Sistemi'nin Non-Repainting, Non-Redrawing ve Non-Lagging Göstergesi olduğunu vurgulamak önemlidir, bu da hem manuel hem de robot ticareti için ideal hale getirir. Online kurs, kılavuz ve ön ayarları indir. "Smart Trend Trading System MT5", yeni ve deneyimli tüccarlar için özelleştirilmiş kapsamlı bir ticaret çözümüdür. 10'dan fazla premium göstergeyi birleştiriyor ve 7'den fazla sağlam ticaret stratejisi sunuyor, bu da çeşitli piyasa koşulları için esnek bir seçim yapar. Tr
FX Power MT5 NG
Daniel Stein
5 (5)
Sabah Brifingimiz burada mql5 ve on Telegram! FX Power MT5 NG , uzun zamandır çok popüler olan döviz gücü ölçerimiz FX Power'ın yeni neslidir. Peki bu yeni nesil güç ölçer ne sunuyor? Orijinal FX Power hakkında sevdiğiniz her şey PLUS GOLD/XAU güç analizi Daha da hassas hesaplama sonuçları Ayrı ayrı yapılandırılabilir analiz dönemleri Daha da iyi performans için özelleştirilebilir hesaplama limiti Özel çokluDaha fazlasını görmek isteyenler için örnek ayarlar Her grafikte en sevdiğiniz renkler i
Quantum Trend Sniper
Bogdan Ion Puscasu
4.91 (43)
Tanıtım       Kuantum Trend Keskin Nişancı Göstergesi   , trend tersine dönmeleri belirleme ve ticaret yapma şeklinizi değiştiren çığır açan MQL5 Göstergesi! 13 yılı aşkın ticaret tecrübesine sahip deneyimli tüccarlardan oluşan bir ekip tarafından geliştirilmiştir.       Kuantum Trend Keskin Nişancı Göstergesi       trend dönüşlerini son derece yüksek doğrulukla belirlemenin yenilikçi yolu ile ticaret yolculuğunuzu yeni zirvelere taşımak için tasarlanmıştır. ***Kuantum Trend Keskin Nişancı Gö
Reversal First Impulse levels (RFI)      INSTRUCTIONS        RUS       -       ENG              R ecommended to use with an indicator   -   TREND PRO -  Version MT4                 A key element in trading is zones or levels from which decisions to buy or sell a trading instrument are made. Despite attempts by major players to conceal their presence in the market, they inevitably leave traces. Our task was to learn how to identify these traces and interpret them correctly. Main functions:: Di
Trend Screener Pro MT5
STE S.S.COMPANY
4.88 (64)
Trend Göstergesi, Trend Alım Satım ve Filtreleme için Çığır Açan Benzersiz Çözüm, Tüm Önemli Trend Özellikleriyle Tek Bir Araç İçinde Yerleştirildi! Forex, emtialar, kripto para birimleri, endeksler ve hisse senetleri gibi tüm sembollerde/araçlarda kullanılabilen %100 yeniden boyamayan çoklu zaman çerçevesi ve Çoklu para birimi göstergesidir. Trend Screener, grafikte noktalarla ok trend sinyalleri sağlayan etkili bir trend trend göstergesidir. Trend analizörü göstergesinde bulunan özellikler: 1.
Öncelikle, bu Ticaret Aracının Non-Repainting, Non-Redrawing ve Non-Lagging Gösterge olduğunu vurgulamakta fayda var, bu da onu profesyonel ticaret için ideal hale getiriyor. Çevrimiçi kurs, kullanıcı kılavuzu ve demo. Akıllı Fiyat Hareketi Kavramları Göstergesi, hem yeni hem de deneyimli tüccarlar için çok güçlü bir araçtır. İleri ticaret fikirlerini, Inner Circle Trader Analizi ve Smart Money Concepts Ticaret Stratejileri gibi 20'den fazla kullanışlı göstergeyi bir araya getirerek bir aray
Gold Stuff mt5
Vasiliy Strukov
4.89 (178)
Gold Stuff mt5, özellikle altın için tasarlanmış bir trend göstergesidir ve herhangi bir finansal enstrümanda da kullanılabilir. Gösterge yeniden çizilmez ve gecikmez. Önerilen zaman dilimi H1. Ayarları ve kişisel bir bonusu almak için satın alma işleminden hemen sonra benimle iletişime geçin!  Güçlü Destek ve Trend Tarayıcı göstergemizin ücretsiz bir kopyasını pm'den alabilirsiniz. Ben!   AYARLAR Ok Çiz - açık kapalı. grafik üzerinde oklar çizmek. Uyarılar - sesli uyarılar kapalı. E-post
FX Volume MT5
Daniel Stein
4.94 (17)
Sabah Brifingimiz aracılığıyla ayrıntılar ve ekran görüntüleri ile günlük piyasa güncellemenizi alın burada mql5 ve on Telegram ! FX Volume, bir brokerin bakış açısından piyasa duyarlılığı hakkında GERÇEK bir fikir veren İLK ve TEK hacim göstergesidir. COT raporlarından çok daha hızlı bir şekilde, brokerlar gibi kurumsal piyasa katılımcılarının Forex piyasasında nasıl konumlandıklarına dair harika bilgiler sağlar. Bu bilgileri doğrudan grafiğinizde görmek, ticaretiniz için gerçek oyun değiştir
TPSproTREND PrO MT5
Roman Podpora
4.88 (8)
TPSpro TRENDPRO  - is a trend indicator that automatically analyzes the market and provides information about the trend and each of its changes, as well as giving signals for entering trades without redrawing! The indicator uses each candle, analyzing them separately. referring to different impulses - up or down impulse. Exact entry points into transactions for currencies, crypto, metals, stocks, indices!  -  Version MT4               DETAILED DESCRIPTION               R ecommended to use with
FxaccurateLS
Shiv Raj Kumawat
WHY IS OUR FXACCCURATE LS MT5 THE PROFITABLE ? PROTECT YOUR CAPITAL WITH RISK MANAGEMENT Gives entry, stop and target levels from time to time. It finds Trading opportunities by analyzing what the price is doing during established trends. POWERFUL INDICATOR FOR A RELIABLE STRATEGIES We have made these indicators with a lot of years of hard work. It is made at a very advanced level. Established trends provide dozens of trading opportunities, but most trend indicators completely ignore them!
The Volume by Price Indicator for MetaTrader 5 features Volume Profile and Market Profile TPO (Time Price Opportunity). Volume and TPO histogram bar and line charts. Volume Footprint charts. TPO letter and block marker collapsed and split structure charts. Session filtering and grouping. Static, dynamic and flexible range segmentation and compositing methods with relative and absolute visualizations. Graphical layering, positioning and styling options to suit the user's analytic and aesthetic n
AW Trend Predictor MT5
AW Trading Software Limited
4.78 (58)
Tek bir sistemde trend ve kırılma seviyelerinin kombinasyonu. Gelişmiş bir gösterge algoritması piyasa gürültüsünü filtreler, trendi, giriş noktalarını ve olası çıkış seviyelerini belirler. Gösterge sinyalleri, sinyal geçmişinin etkinliğini gösteren en uygun enstrümanların seçilmesine izin veren bir istatistiksel modüle kaydedilir. Gösterge Kâr Al ve Zararı Durdur işaretlerini hesaplar. Kılavuz ve talimatlar ->   BURAYA   / MT4 versiyonu ->   BURAYA Gösterge ile nasıl ticaret yapılır: Trend Pre
ICT, SMC, SMART MONEY CONCEPTS, SMART MONEY, Smart Money Concept, Support and Resistance, Trend Analysis, Price Action, Market Structure, Order Blocks, BOS/CHoCH,   Breaker Blocks ,  Momentum Shift,   Supply&Demand Zone/Order Blocks , Strong Imbalance,   HH/LL/HL/LH,    Fair Value Gap, FVG,  Premium  &   Discount   Zones, Fibonacci Retracement, OTE, Buy Side Liquidity, Sell Side Liquidity, BSL/SSL Taken, Equal Highs & Lows, MTF Dashboard, Multiple Time Frame, BigBar, HTF OB, HTF Market Structure
Quantum Heiken Ashi PRO MT5
Bogdan Ion Puscasu
4.5 (8)
Quantum Heiken Ashi PRO ile   tanışın Pazar eğilimleri hakkında net bilgiler sağlamak üzere tasarlanan Heiken Ashi mumları, gürültüyü filtreleme ve yanlış sinyalleri ortadan kaldırma yetenekleriyle ünlüdür. Kafa karıştırıcı fiyat dalgalanmalarına veda edin ve daha sorunsuz, daha güvenilir bir grafik sunumuna merhaba deyin. Quantum Heiken Ashi PRO'yu gerçekten benzersiz kılan şey, geleneksel şamdan verilerini okunması kolay renkli çubuklara dönüştüren yenilikçi formülüdür. Kırmızı ve yeşil çubukl
Easy By Sell is a market indicator for opening and closing positions. It becomes easy to track market entries with alerts. It indicates trend reversal points when a price reaches extreme values ​​and the most favorable time to enter the market. it is as effective as a Fibonacci to find a level but it uses different tools such as an algorithm based on ATR indicators and Stochastic Oscillator. You can modify these two parameters as you wish to adapt the settings to the desired period. My othe
Legacy of Gann for MT5
Pavel Zamoshnikov
5 (6)
The indicator very accurately determines the levels of the possible end of the trend and profit fixing. The method of determining levels is based on the ideas of W.D.Gann, using an algorithm developed by his follower Kirill Borovsky. Extremely high reliability of reaching levels (according to K. Borovsky  - 80-90%) Indispensable for any trading strategy – every trader needs to determine the exit point from the market! Precisely determines targets on any timeframes and any instruments (forex, met
"Piranha" - an autonomous trading system that determines overbought and oversold levels on the chart. Red and blue zones represent overbought and oversold levels respectively. Entry points are marked with arrows: a downward arrow in the red zone for "sell" and an upward arrow in the blue zone for "buy". The Take profit level is indicated by the green moving average. Key features: Adjusting the Take profit level as the green moving average changes position. Averaging ability when a new market e
Fiyat tersine döndükçe ve geri çekildikçe piyasa yapısından elde edilen kâr değişir. Piyasa yapısını tersine çevirme uyarısı göstergesi, bir trendin veya fiyat hareketinin ne zaman tükenmeye yaklaştığını ve tersine dönmeye hazır olduğunu tanımlar. Genellikle bir geri dönüş veya büyük bir geri çekilme meydana gelmek üzereyken meydana gelen piyasa yapısındaki değişiklikler konusunda sizi uyarır. Gösterge, olası bir tükenme noktasının yakınında her yeni yüksek veya düşük oluştuğunda, başlangıçta
Top indicator for MT5   providing accurate signals to enter a trade without repainting! It can be applied to any financial assets:   forex, cryptocurrencies, metals, stocks, indices .  Watch  the video  (6:22) with an example of processing only one signal that paid off the indicator! MT4 version is here It will provide pretty accurate trading signals and tell you when it's best to open a trade and close it. Most traders improve their trading results during the first trading week with the help of
IX Power MT5
Daniel Stein
5 (3)
IX Power   nihayet FX Power'ın rakipsiz hassasiyetini Forex dışı sembollere getiriyor. En sevdiğiniz endeksler, hisse senetleri, emtialar, ETF'ler ve hatta kripto para birimlerindeki kısa, orta ve uzun vadeli eğilimlerin yoğunluğunu doğru bir şekilde belirler. Terminalinizin sunduğu   her şeyi analiz   edebilirsiniz. Deneyin ve işlem yaparken   zamanlamanızın   nasıl   önemli ölçüde iyileştiğini   deneyimleyin. IX Power Temel Özellikler 100 hassas, yeniden boyanmayan hesaplama sonuçları -
Bill Williams Advanced
Siarhei Vashchylka
5 (5)
Bill Williams Advanced is designed for automatic chart analysis using Bill Williams' "Profitunity" system. The indicator analyzes four timeframes at once. Manual (Be sure to read before purchasing) Advantages 1. Automatically analyzes the chart using the "Profitunity" system of Bill Williams. The found signals are placed in a table in the corner of the screen. 2. Equipped with a trend filter based on the Alligator indicator. Most of the system signals are recommended to be used only accordi
TPA True Price Action indicator reveals the true price action of the market makers through 100% non-repainting signals strictly at the close of a candle! TPA shows entries and re-entries, every time the bulls are definitely stronger than the bears and vice versa. Not to confuse with red/green candles. The shift of power gets confirmed at the earliest stage and is ONE exit strategy of several. There are available now two free parts of the TPA User Guide for our customers. The first "The Basics"
** All Symbols x All Timeframes scan just by pressing scanner button ** ***Contact me after purchase to send you instructions and add you in "123 scanner group" for sharing or seeing experiences with other users. After 17 years of experience in the markets and programming, Winner indicator is ready. I would like to share with you! Introduction The 123 Pattern Scanner indicator with a special enhanced algorithm is a very repetitive common pattern finder with a high success rate . Interestingly,
Yeni Başlayanlar veya Uzman Tüccarlar için En İyi Çözüm! Bu Gösterge benzersiz, yüksek kaliteli ve uygun fiyatlı bir ticaret aracıdır çünkü bir dizi tescilli özellik ve yeni bir formül ekledik. Sadece BİR grafik ile 28 Forex çifti için Döviz Gücünü okuyabilirsiniz! Yeni bir trendin veya scalping fırsatının tam tetik noktasını belirleyebildiğiniz için ticaretinizin nasıl gelişeceğini hayal edin? Kullanım kılavuzu:   buraya tıklayın Bu ilk olan, orijinal! Değersiz bir özenti klonunu almayın
Bu gösterge paneli, seçilen semboller için mevcut en son   harmonik kalıpları   gösterir, böylece zamandan tasarruf edersiniz ve daha verimli olursunuz /   MT4 sürümü . Ücretsiz Gösterge:   Basic Harmonic Pattern Gösterge sütunları Symbol :   seçilen semboller görünecektir Trend:   yükseliş veya düşüş Pattern :   desen türü (gartley, kelebek, yarasa, yengeç, köpekbalığı, cypher veya ABCD) Entry :   giriş fiyatı SL:   zararı durdur fiyatı TP1:   1. kar alma fiyatı TP2:   2. kar alma fiyatı
Yeni Nesil Otomatik Arz ve Talep Bölgeleri. Her Grafikte Çalışan Yeni ve Yenilikçi Algoritma. Tüm Bölgeler Piyasanın Fiyat Hareketine Göre Dinamik Olarak Oluşturulmaktadır. İKİ TÜR UYARI --> 1) FİYAT BİR BÖLGEYE ÇIKTIĞINDA 2) YENİ BİR BÖLGE OLUŞTURDUĞUNDA Bir tane daha işe yaramaz gösterge almazsın. Kanıtlanmış Sonuçlarla eksiksiz bir Ticaret Stratejisi elde edersiniz.     Yeni özellikler:     Fiyat Arz/Talep Bölgesine ulaştığında uyarılar     Yeni bir Arz/Talep Bölgesi olu
AW Prime Oscillator MT5
AW Trading Software Limited
İki osilatörün birleşimi. Birincisi giriş noktalarını, ikincisi ise mevcut trendi gösterir. Gösterge, osilatör sinyallerini iki modda oklarla görüntüleyebilir; tüm hızlı osilatör sinyalleri veya yalnızca mevcut trend yönündeki sinyaller. Çok zaman dilimli bir panele ve üç tür sinyal bildirimine sahiptir. Faydalar: Günlük ve scalping ticaretine uygundur Trend filtreleme Basit ve hassas kurulum Çoklu zaman dilimi paneli Bir danışmana entegrasyona uygundur. Herhangi bir sembol ve herhangi bir zaman
Owl Smart Levels MT5
Sergey Ermolov
4.38 (37)
MT4 versiyonu  |  FAQ Owl Smart Levels Indicator , Bill Williams'ın gelişmiş fraktalları , piyasanın doğru dalga yapısını oluşturan Valable ZigZag ve kesin giriş seviyelerini gösteren Fibonacci seviyeleri gibi popüler piyasa analiz araçlarını içeren tek gösterge içinde eksiksiz bir ticaret sistemidir. pazara ve kar elde edilecek yerlere. Stratejinin ayrıntılı açıklaması Gösterge ile çalışma talimatı Baykuş Yardımcısı ticaretinde Danışman Yardımcısı Kullanıcıların özel sohbeti -> Satın aldıktan
ADR Ters Çevirme Göstergesi, normal ortalama günlük aralığına göre fiyatın şu anda nerede işlem gördüğünü bir bakışta size gösterir. Fiyat, ortalama aralığı ve seçtiğiniz seviyenin üzerindeki seviyeleri aştığında, açılır pencere, e-posta veya push yoluyla anında uyarılar alacaksınız, böylece hızlı bir şekilde geri çekilmelere ve geri dönüşlere atlayabilirsiniz. Gösterge, grafikte ortalama günlük aralık uç noktalarında yatay çizgiler ve ayrıca fiyatları aşan matematiksel olasılıkları olan seviye
Yazarın diğer ürünleri
Ind2tompson
Vasilii Luchnikov
5 (1)
The 2indtompson indicator is an indicator for comparing two instruments for determining volumes, for balancing in pair trading or arbitrage trading, prepared from an analog version for the MT4 terminal. So if you need to compare how much two instruments will weigh and you don't know how to do it, then put an indicator on the chart and it will automatically calculate the volumes needed for balancing. Additionally, the indicator shows the state of the instruments relative to each other - Divergenc
FREE
Mtrx2tompson
Vasilii Luchnikov
5 (1)
The indicator is based on indicators built-in standard indicators, the indicator take into account the current indicators 30 indicators and give a signal to buy or sell, the General trend of all trends of other indicators. In the input parameters, you can configure special parameters for each indicator. the indicator is executed in the form of an oscillator and shows the General trend and the preponderance of all indicators in one or the other direction. https://youtu.be/UG2ZZEH9B_U
FREE
VolumeSpreadtompson
Vasilii Luchnikov
5 (1)
hello. The indicator shows the levels of change in the spread per unit of time when its values are higher. Practice shows that the change in volumes is associated with the warning and advance of speculative activity, especially at key moments: Fed news, oil news, speeches by leaders of the IDR countries.   We are very happy to present new developments. Thanks. 
FREE
MaxlotTomson
Vasilii Luchnikov
5 (2)
Good afternoon. Today we offer the maxlottomson indicator to determine the maximum volume that you can put up for purchase or sale, if you look at your deposit level. This indicator is convenient to use for News trading, when you need to determine the entry point on a high-speed movement and calculate the risk level as a percentage of the deposit, the maxlottomson indicator shows the maximum value of the LOT volume for your deposit that you can use for trading.
FREE
DuettoFXTompson
Vasilii Luchnikov
4 (1)
The DuettoFXTompson indicator is designed to work with two instruments that have a high level of correlation. the indicator can be used for pair trading on currencies, stocks, and other financial instruments. The indicator shows the moment when the instruments diverge and the sum of the two instruments (yellow line). additionally, the parameter of the Average MA value is calculated. Recommended timeframe for M5 operation. Contacts for communication 777basil@mail.ru we will prepare an expert, a
FREE
Добрый день. Сегодня добавили вспомогательный индикатор тренда DveMashkiTompson, идея взята из аналога МТ4 и перенесена на МТ5, используется совместно с индикаторами Тренда ТМА и МА, рисует красные и зеленые области в зависимости от направления рынка. Тренд вверх -зеленые области, тренд вниз -красные.Области основываются на пересечении индикатора МА, таким образом данный индикатор дает информацию графического содержания для более быстрой оценки ситуации и принятия решения.
FREE
SynchroWindowTomson
Vasilii Luchnikov
5 (1)
Привет. Сегодня представляем индикатор корреляции -  SynchroWindowTomson. Индикатор в одном окне показывает движение нескольких инструментов, по отношению друг к другу, удобно определять направление и изменение, особенно когда вы работаете с целым портфелем разных инструментов и нужно определить какой из них тянет результат назад и движется в другую сторону. Так же видны точки разворота спреда.
FREE
Hi. PortfolioHedgingStopOrderOneSymbol-trend EA for opening orders from mid-channel on the third wave Elliot, is working on the breakdown of the level from a custom indicator TMA channel width with fixed S / L and T / P. this EA is designed to determine the best entry point into the market after the correction. if you have confirmation of a strong trend movement, but if you are a novice and still doubt the correctness of your actions, it is always better to wait for the correction to finish and
Hello. CatchCandleLimitOrderOneSymbol-flat expert Advisor, for opening orders from the channel borders to the center, works on pullbacks from the support and resistance levels, from the custom channel width indicator TMA, with a fixed S/L and T / P. The EA is designed to trade off the levels when a particular trend movement, and is no doubt the continuation of the trend, the Levels are shifted automatically with the price based on the channel boundaries and the extreme price deviation for a be
VolumeTick
Vasilii Luchnikov
Indicator VolumeTick https://youtu.be/tmHZKdMCMGo made for rapid identification of possible reversal points, when the conditions of consolidation and bi-directional trading traders, the number of volumes in the market increases sharply, which shows the interest of the participants to change the direction of movement of the tool market and counts the number of ticks on each bar, made in the form of an oscillator. This way we can foresee stopping trading or trading in the other direction, or add
https://youtu.be/Ze9zPpYtIrI GridCatchCandleLimitOrderOneSymbol is a Grid flat expert Advisor for opening orders from the channel borders to the center. it works on pullbacks from the support and resistance levels, from the custom TMA channel width indicator, with fixed S/L and T / P. The EA is designed to trade off the levels when a particular trend movement, and is no doubt the continuation of the trend, the Levels are shifted automatically with the price based on the channel boundaries and
The CatchPositionByStopOrder trading expert is designed to work on a trending market when the direction of trading is known, you can trade both SELLSTOP and BUYSTOP orders, and you can trust the expert himself to choose the direction. Sets pending STOP orders and moves them behind the price to determine the most effective entry point. The recommended timeframe for trading is M5/M15/H1. In the expert Advisor, you can work with fixed S/l and T/p, as well as with the help of a trawl. if T / p=0, t
Good afternoon. Today we present a new indicator PointIntoChannelTOMSON https://youtu.be/dmgtVwX3nvg https://youtu.be/Wr7N2WEY8lA -this indicator is calculated from the channel to the level of price deviation in the direction of buying and selling, the green and red window of indicators, respectively. The higher the deviation level, the greater the probability of a reversal. The indicator readings are recalculated with each new bar and it is recommended to use it only as an auxiliary one
UturnAnalysis
Vasilii Luchnikov
Good afternoon. UturnAnalysis - to check the quality of the indicator WE HAVE LAUNCHED A TRIAL VERSION free distribution of signals about reversals based on this indicator for the futures and stock markets of the MICEX write to tech support, me 777basil@mail.ru , or in the comments your email address and we will send you the account details where the alerts are sent, for free. https://youtu.be/q228LvLec-Y we put it on several tools at once https://youtu.be/Wr7N2WEY8lA will save you time a
Filtrele:
Ngonidzashe Calven Chingonzo
125
Ngonidzashe Calven Chingonzo 2024.04.02 15:36 
 

nice indicator

BSantiago72
70
BSantiago72 2022.11.18 13:07 
 

this is a wonderful indicator! Backtest, adjust and see for yourself. Thanks LiK’e INVEST!

13qwerty
55
13qwerty 2022.02.07 14:42 
 

Может и плагиат, но для использования гораздо лучше оригинального ВВ. Если бы можно было на графике установить индюк для страших ТФ, то цены бы не было. В сочетании с метром и уровнями полноценная безубыточная стратегия. Автору спасибо!

GANDURAS
14
GANDURAS 2021.07.06 16:40 
 

Индикатор ни о чем. Дешевый плагиат. В CodeBase есть оригинал.

Luke Perrett
3386
Luke Perrett 2021.02.25 13:38 
 

Author is very helpful and considerable.

Aleksandr Tamonin
4109
Aleksandr Tamonin 2021.01.24 09:05 
 

Неплохой индикатор, но использовать можно только как дополнительный фильтр. Автору спасибо.

İncelemeye yanıt
Sürüm 1.2 2021.02.20
Добрый день. Добавили в описательную часть адреса обратной связи технической поддержки, для оперативного реагирования и устранения сбоев.Спасибо.