TickChart
- Yardımcı programlar
- Boris Sedov
- Sürüm: 15.4
- Güncellendi: 25 Şubat 2021
- Etkinleştirmeler: 5
Tick Chart — full-featured chart for MetaTrader 4.
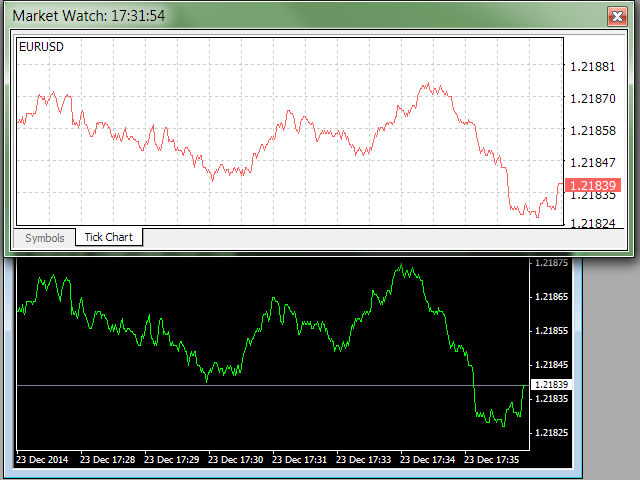
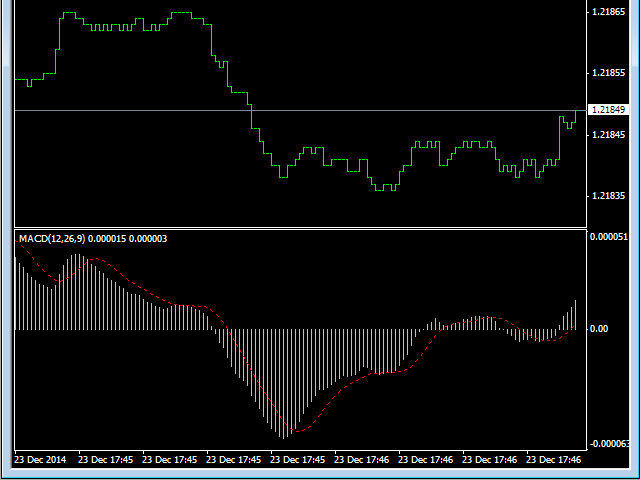
A utility for creating and working with a tick chart in the MetaTrader 4 terminal. You can create a tick chart that works exactly the same as a regular chart. You can apply indicators, Expert Advisors and scripts to the tick chart. You get a fully functional tick chart on which you can work just as well as on a regular chart.
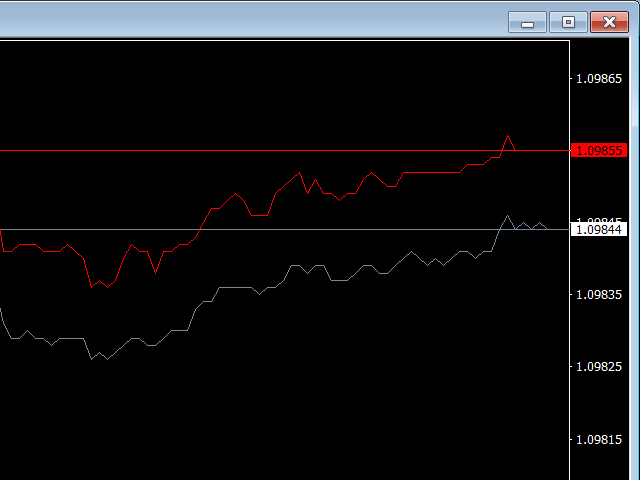
You can enable the output of the Ask price data. The data are generated in the form of the upper shadow of a tick bar. From these data, we can accurately estimate the spread value at any time on a cumulative tick history.
At the same time the data is updated synchronously with the basic chart with no delays.
You can open several charts at the same time.
Inputs
- Show Ask — enable the output of the Ask price data.
- Chart — timeframe for a chart opened in a separate window. In case you are going to work with a single chart for the currency pair, the timeframe is irrelevant. Timeframe does not affect the calculations during the chart creation. This setup is created to open several charts for the same currency pair, but with different settings. In such case, different timeframes for each chart (for example, M2, M3, M4) should be set. You also need to set different timeframes when simultaneously running the Tick Chart indicator and other tools that generate a synthetic chart on the same currency pair.
Launch
- Open the "Navigator" window.
- Find the Tick Chart and drag it to the desired chart (any timeframe).
- Open the resulting chart by clicking the corresponding "Open chart" button.






















Спасибо за утилиту! Мне нравиться. Для скальпинга.