Linear Regression Bands MQL5
- Göstergeler
- Nery Adrian Gay
- Sürüm: 1.0
- Etkinleştirmeler: 5
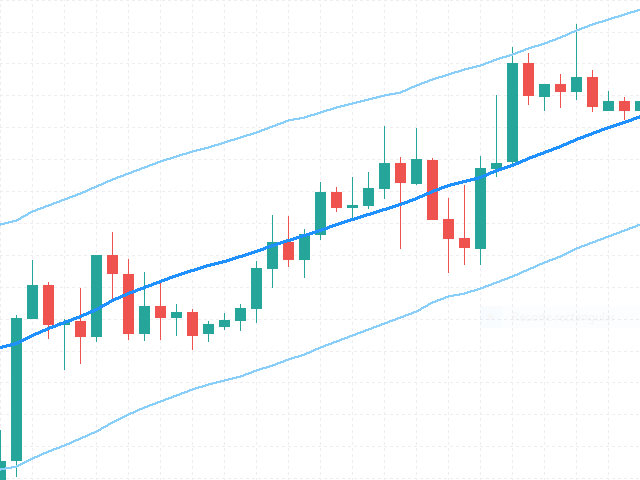
Representation of the intercept value of the linear regression and the mean absolute deviation symmetrically to the intercept value.
PARAMETERS
• Periods: number of periods to calculate linear regression
• Amplitude: multiplier of the absolute mean deviation to define the bands
• Displacement: displacement on the horizontal axis
• AppliedPrice: price on which the calculations are made
• MainPlot: display of the main plot
• UpperPlot: display of the upper band
• LowerPlot: display of the lower band
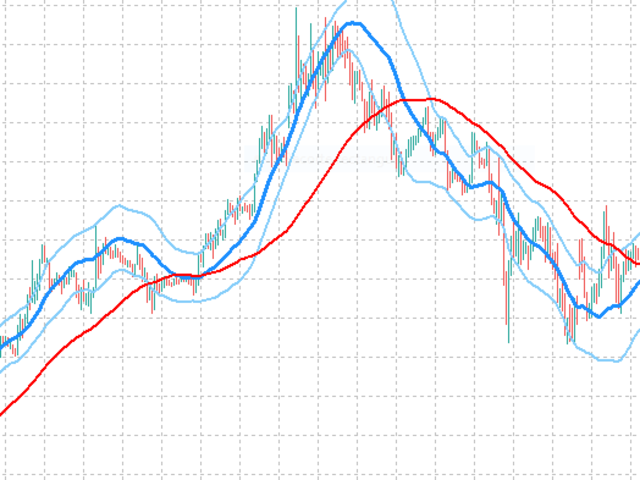
Notice that the moving average, when the price is in range, is nothing but the linear regression. Here we see the advantage of linear regression over one of the most used indicators, and that is that it adjusts in the same way when the price is trending, but not the moving average.
SUGGESTIONS FOR USE
• Super fast compared to the moving average, so the MainPlot better represents the price
• Bands more accurately define the price channel, not only in range but also in trend, this is ideal for swing trading
• It can be used to visualize trends with the naked eye, but also sustained accelerations and decelerations of the price. Whenever the price is above the MainPlot the price is accelerating, the reverse also for when the price is below.
REMEMBER!!!…
• Indicators are just tools, there is no magic bullet, don't blindly believe in alerts.
• Stick to a trading style, prepare a strategy, be consistent with it, apply improvements if necessary.
• Study your tools and your alternatives well, don't forget to manage the money.
• Identify the trend direction, confirm it by another method if necessary, define your risk, identify value areas (supports and resistances), check how the market reacts to these value areas (price action), and don't forget Doing a fundamental analysis always helps a lot.
PARAMETERS
• Periods: number of periods to calculate linear regression
• Amplitude: multiplier of the absolute mean deviation to define the bands
• Displacement: displacement on the horizontal axis
• AppliedPrice: price on which the calculations are made
• MainPlot: display of the main plot
• UpperPlot: display of the upper band
• LowerPlot: display of the lower band
Notice that the moving average, when the price is in range, is nothing but the linear regression. Here we see the advantage of linear regression over one of the most used indicators, and that is that it adjusts in the same way when the price is trending, but not the moving average.
SUGGESTIONS FOR USE
• Super fast compared to the moving average, so the MainPlot better represents the price
• Bands more accurately define the price channel, not only in range but also in trend, this is ideal for swing trading
• It can be used to visualize trends with the naked eye, but also sustained accelerations and decelerations of the price. Whenever the price is above the MainPlot the price is accelerating, the reverse also for when the price is below.
REMEMBER!!!…
• Indicators are just tools, there is no magic bullet, don't blindly believe in alerts.
• Stick to a trading style, prepare a strategy, be consistent with it, apply improvements if necessary.
• Study your tools and your alternatives well, don't forget to manage the money.
• Identify the trend direction, confirm it by another method if necessary, define your risk, identify value areas (supports and resistances), check how the market reacts to these value areas (price action), and don't forget Doing a fundamental analysis always helps a lot.