• Genel bakış
  • İncelemeler
  • Yorumlar
  • Yenilikler

MA Multicurrencies Multi timeframes Histogram

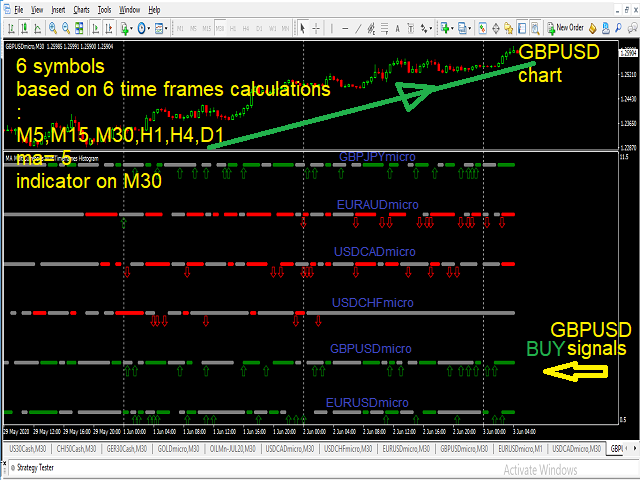
MA Multi-Currencies  Multi-Timeframes Histogram BUY/SELL Indicator

up to 6 currencies on time 

calculations based on 6 time frames : M5, M15, M30, H1, H4, D1

Trading Strategies:

**TREND shifts to UP trend when Green point appears after Red and Gray points -> Close SELL positions then add new BUY positions on new Green points 

**TREND shifts to DOWN trend when Red point appears after Green and Gray points -> Close BUY  positions then add new SELL positions on new Red points

** Close BUY positions in UP trend when Gray point appear after Green points and Positions are profitable

** Close SELL positions in DOWN trend when Gray point appear after RED points and Positions are profitable

Pressing on any symbols label on indicator will open its chart for trading 

Alerting enable/disable options on new Buy/Sell Signals

you can initialize it on any symbol time frame less than H4

main input : ma index = I use 5 

-> High value means long term signals

-> Low value means short term signals

(you may try different values) on demo trial 

Enjoy the Demo trial and give feedback 


Önerilen ürünler
R Var Hareketli Ortalama Göstergesi, zorlu trend takipçileri için tasarlanmış bir trend takip göstergesidir. Hisse senedi tüccarları ve emtia tüccarları arasında oldukça popüler bir forex ticaret göstergesidir ve popülaritesi, kullanıcılarına gerçek para kazanma sinyalleri verme yeteneğinden kaynaklanmaktadır. Gösterge, bir sienna çizgisi üzerine yerleştirilmiş yeşil ve kırmızı noktalardan oluşur. Yeşil nokta yükseliş sinyalini, kırmızı nokta ise düşüş sinyalini gösteriyor. Temel Ticaret
Oscillator helps determine the direction of the market Shows the direction of the price movement and is painted in the appropriate color. Allows you to conduct trend and counter trend trading It works on all timeframes, on any currency pairs, metals and cryptocurrency Can be used when working with binary options Distinctive features Does not redraw; Simple and clear settings; It works on all timeframes and on all symbols; Suitable for trading currencies, metals, options and cryptocurrency (Bitco
MQLTA Candle Timer
MQL4 Trading Automation
5 (1)
MQLTA Candle Timer is an indicator that can show you the details about a symbol/pair and alert you before the close of a candle. Used in swing trading and not only, it can help your strategies knowing and be ready before the close of a candle. How does it work Simply add the indicator to the chart and set the notifications options. You can load a minimalistic interface or a full interface. The alert will be sent once per candle. Parameters All the parameters, that you can see in the picture,
FREE
This Expert Advisor uses ATR as CORE indicator for GRID operative.ATR measures intrinsec volatility. Using ATR on a GRID, you will give enought space between lines considering current volatility. On this EA, you can set ATR period and timeframe parameters, and also you can set a ATR multiplier factor, to increase margin between each GRID level. In the same way, you can also configure the number of GRID levels (up and down) as well as the color of the drawn lines. In addition, it has a start/
Introducing the Austin Trend Scanner: Your Ultimate Tool for Timely Trend Identification. The Austin Trend Scanner is a groundbreaking MetaTrader 4 indicator meticulously engineered to provide traders with precise trend reversal signals across multiple timeframes. Built upon advanced algorithms and non-repainting technology, this indicator offers unparalleled accuracy in identifying profitable trading opportunities. Key Features: 1. Non-Repainting Signals: The Austin Trend Scanner delivers n
Gann Box MT4
Frederic Jacques Collomb
Gann Box göstergesi, trader'ların piyasanın kilit seviyelerini tanımlamalarına ve bunlardan yararlanmalarına yardımcı olmak için tasarlanmış güçlü ve çok yönlü bir araçtır. Bu gösterge, grafiğe bir dikdörtgen çizmeyi sağlar ve bu dikdörtgen otomatik olarak stratejik seviyeler olan 0, 0.25, 0.50, 0.75, 1 ile birkaç bölgeye ayrılır. Fiyat bu seviyelerden birine ulaştığında, alarmlar tetiklenir ve bu, ticaret kararları için değerli bir destek sağlar. Çizdiğiniz bölgeye göre piyasanın gelişimini an
EUTUSDKILLER is a trend EA that works in all market conditions (i)It buys when the indicator confirms a trend  (ii)Sell when the same indicator confirms a down trend. (iii)Easy visual and effective trend detection. (iV)It filters and improve your trading strategies. (v) It scans previous data and give real time output. (vi) It can be set to auto calculate lots size.
BinaryMartini
Abdulkarim Karazon
macd ile 3ma çaprazına dayanan ikili ticaret göstergesi, çubuk açıkken alım ve satım sinyalleri verir ve Yeniden Boyanmaz veya Arkadan boyanmaz gösterge martingale ticareti için yapıldığından yüksek kazanma oranına odaklanmaz, gösterge arka arkaya en düşük kaybetme sinyali sayısına odaklanır. Strateji : Minimum Depozito 1000 birimdir, 1 birim ile ticarete başlıyoruz (işlem büyüklüğü her 1000 sermaye için 1 birimdir) Mevcut sinyal kaybolursa bir sonraki sinyalde ticaret boyutunu iki katına çı
Femade Indie
Opengates Success International
Femade Indie Vs 1.0 is a simple but multi-currency monitoring Indicator created to instantly notify the trader when an attached currency pair is ready to buy, sell or give signal when such currency pair is getting ready for a big move either up or down. It does this by visual aids on the screen charts, sound and pop-up alerts. If it shows " Medium ", this means that the so called currency signal is almost gone but can still be traded provided the trader will not need a lot of pips which can be b
ForceX Trend is a trend indicator that allows you to effectively determine the direction of the current trend, as well as identify potential reversal points. The indicator makes it possible to classify the direction of price movement by determining its strength. Solving this problem helps to enter the market in time and get the desired result. Let's start with the benefits. Allows you to determine the current trend. You can quickly understand what kind of trend is currently developing in th
Forex Indicator "Trend Entry Histogram" for MT4 Trend Entry Histogram indicator can be used for search of   entry signals into the trend  direction once Entry bar appears This indicator has unique feature - it takes both: price and volume for calculations  Trend Entry Histogram   can be in 2 colors:   red for bearish  trend  and blue for bullish one . Once you see steady trend (minimum 10 consecutive histogram bars   of the same color) - wait for entry bar  Entry  signal is   1 column with oppos
The High Frequency Trader execute trades without any time or trading frequency restrictions.  The EA is programmed to respond quickly to market conditions and aims to capture short-term price movements with precision. Key Features: Time and Frequency Freedom: The EA does not impose any time restrictions, allowing it to trade continuously and react swiftly to market opportunities as they arise. Adjustable Lot Size: The user can customize the trading volume using the "LotSize" input parameter, all
Trend MagicX
Hafis Mohamed Yacine
A trending market is one in which price is generally moving in one direction. ... When trading a trend-based strategy, traders usually pick the major currencies as well as any other currency utilizing the dollar because these pairs tend to trend and be more liquid than other pairs.  Best Trend Indicator That Tells You the Direction of the Trend   Trend MagicX_v1.1 displays the trend direction, duration, intensity and the resulting trend rating for all time frames in real time. You'll see at
Using the Arrow Effect forex indicator algorithm, you can quickly understand what kind of trend is currently developing in the market. The Elephant indicator accompanies long trends, can be used without restrictions on instruments or timeframes. With this indicator, you can try to predict future values. But the main use of the indicator is to generate buy and sell signals. The indicator tracks the market trend, ignoring sharp market fluctuations and noises around the average price. The indicator
A top-quality from the famous XSuper Trend indicator. It is completely loyal to the original algorithm, and implements many useful features Which includes Trend Indicators as Filters like MACD,CCI and Alligator. The Chefs Super Trend Plus Indicator is a great way to identify the current market trend. The indicator shows a clear distinction between uptrends and downtrends. The indicators has optional filters for sound signal. Suitable for the following trending pairs: EUR/USD, GBP/USD, USD/JPY,
PTW NON REPAINT TRADING SYSTEM + HISTOGRAM Non-Repainting ,   Non-Redrawing   and   Non-Lagging  Trading System. Does the following: - Gives Accurate Entry and Exit Points - Scalping, Day and Swing Trading  - 95% Accuracy  - Targets, where to take profits. - Shows Trends, Support and resistance levels - Works on All Brokers - Works on All Currencies, CFDs and Stocks - It does not place trades for you, it only shows you what trades to place. - It works on All Timeframes - It is for Trend or ra
Trade Stats
Johannes Schoeman
Does your trading consist of Multiple EA's, Multiple time frames an no clear indication of how each individual strategy or time frame is performing, then this indicator will help. Assign the EA Magic number to this indicator and track it's performance on the chart by selecting on chart the period, today, week, month year or all history to view. Easy visual colour changing header to display the performance of the EA for the respective periods.    Minimize the panel to reduce chart clutter. Add yo
Main Features Detect the best and most successful point of trend and reversal trend Easy-to-use Intuitive easy setup Scan the number of candles – Amount of history bars to evaluate Configuring not required Watches multiple timeframes for support and resistance Customizable Trailing stoploss and takeprofit Automatic Lot Size Optimization Suitable for any time frame Suitable for any currency pair This EA is fully automated and easy to use. This robot uses Moving Averages working i
Confluence Indicator is unique indicator which collects differnt popular indicators and analyzes their data. It decides an overall trend with its strength. It is not only helpful for identifying the the current picture of the market but also helps traders to stay away from non trending market. It maximize the chance of winning by giving an aggregate picuture of markets best reliable technical indicator settings There are total 7 types of signal which this indicator provides. Each candle will sho
XP Speed Meter the best indicator that measures the price/tick’s currency speed for you. It will give you the ability to know when the pair moving fast or slow . So, you can trade or not trade. It’s very important tool for scalper traders – news traders. Even for trend traders it will be useful to know if the market is trending fast or slow . XP Speed Meter is better than the volume type indicators of course. Because it shows the currency speed on the run-time without any lacking like what the v
TWO SYMBOLS CORRELATION  line indicator    It compares the power/strength lines of two user input symbols and create a SMOOTHED line that indicates the degree of deviation of the 2 symbols Strategy#1- FOLLOW THE INDICATOR THICK LINE when CROSSING O LEVEL DOWN --- TRADE ON INDICATOR THICK LINE (TREND FRIENDLY) !! Strategy#2- TRADE INDICATOR PEAKS (Follow indicator Reversal PEAKS Levels)!! you input - the index of calculation ( 10/20/30....)                 - the indicator Drawing start point (ind
Algo Trading Indicaor  With this indicator , you’ll have zones and trends that hight probability the price will reverse from it. so will gives you all the help that you need  Why should you join us !?  1-This indicator is logical since it’s working in previous days movement , to predict the future movements. 2-Algo trading indicator will help you to draw trends which is special and are too strong than the basics trend , trends will change with the frame time that you work on . 3-We can
Niubility Trend  Niubility Trend displays the trend direction for all time frames in real time. You'll see at a glance at which direction the trends are running, how long they last and how powerful they are. All this makes it an easy-to-use trend trading system for beginners, advanced and professional traders. Features Easy to trade Customizable colors and sizes It is non-repainting and non-backpainting It is fantastic as a trailing stop method It implements alerts of all kinds
AD Trend line
Pavel Shutovskiy
5 (1)
AD Trend line draws trend lines on the basis of A/D indicator (Accumulation/Distribution). When A/D indicator breaks a trend line, the probability of the trend reversal is very high. This is a multitimeframe indicator which can display values from higher timeframes. Parameters Time-frame — Select a timeframe; zero is the current timeframe of the chart; Trend Line — Display lines on the chart; Apply to — Apply lines to close the candle's highest/lowest value; Width line — Width of the line; Style
FREE
The RBCI hist indicator is an adaptive trend histogram, that eliminates noise using a Low-pass filter, which passes the lower frequencies and cuts off hight frequencies of the price fluctuations. The signal (depending on the strategy chosen by trader) is the intersection of the zero line by the indicator, as well as the change in the histogram color. The change in the histogram color serves as an early signal for opening positions towards the trend. The position of the indicator relative to the
Dark Breakout
Marco Solito
4.88 (8)
Dark Breakout   is an Indicator for intraday trading. This Indicator is based on Trend Following  strategy, providing an entry signal on the breakout. The signal is provided by the arrow, which confirms the breaking of the level. We can enter in good price with this Indicator, in order to follow the main trend on the current instrument. It is advised to use low spread ECN brokers. This Indicator does Not repaint and N ot lag . Recommended timeframes are M5, M15 and H1. Recommended working pairs
Indicators Combiner In One Indicator
ʿMrw Alsyd Mhmd Ywsf Alqrydy
1 (1)
^With Mixin Combiner. ^You Can Combine 10 Indicators Together To Make One Arrow In The End ^You Can Filter Time You Want To Trade. ^You Can Control Which Candle Arrow Apear On It " Bullish Or Bearsh". ^There Is An Statistics To Can Filter "What success rate of the indicators you Combined? ". ^You Also Can Control The Appearance Of The Arrows At Any Time Of The Candle , "Is It In The Beginning Or At Any Time In Particular? ".
This is a simple arrow system based on Engulfing Candlestick Pattern. It gives you alerts on your smartphone when there is an engulfing candlestick pattern happens. Which type of alerts available? 1. It paints on chart Up/Down Arrows. 2. Popup message and sound alert in trading terminal window. 3. Push notification or Alert on your Android and IOS mobile phones (requires MT4 or MT5 app installed!) *Note: Use it on higher timeframes like H4 (4 hours), D1 (1 Day) then find trade opportunities on s
This Indicator will notified you when time to entry into the market, build with double william percent range strategy.  --> Buy Notification will flag with the blue arrow --> Sell Notification will flag with the red arrow After Flag Appear, the market usually explode but carefully you must performs double check because weakness of this indicator when in the end of the trend
Jerk Indicator
Safwan Rushdi Khalil Arekat
In physics, "Jerk" is the third time-derivative of position, with acceleration being the second derivative and velocity the first derivative. In technical analysis, the first derivative of price is the price momentum, with the second derivative,acceleration, being seldom used and the third derivative virtually unknown. The magnitude frequency response of a digital differentiator is a positive-slope straight line passing through zero frequency. Therefore, every instance of a digital signal differ
FREE
Bu ürünün alıcıları ayrıca şunları da satın alıyor
Gann Made Easy
Oleg Rodin
4.85 (82)
Gann Made Easy , bay teorisini kullanarak ticaretin en iyi ilkelerine dayanan, profesyonel ve kullanımı kolay bir Forex ticaret sistemidir. WD Gann. Gösterge, Zararı Durdur ve Kâr Al Seviyeleri dahil olmak üzere doğru SATIN AL ve SAT sinyalleri sağlar. PUSH bildirimlerini kullanarak hareket halindeyken bile işlem yapabilirsiniz. Lütfen satın aldıktan sonra benimle iletişime geçin! Alım satım ipuçlarımı ve harika bonus göstergelerini ücretsiz olarak sizinle paylaşacağım! Muhtemelen Gann ticaret y
Atomic Analyst
Issam Kassas
5 (2)
Öncelikle belirtmek gerekir ki bu Ticaret Göstergesi Yeniden Çizim Yapmaz, Gecikmez ve Gecikme Göstermez, bu da hem manuel hem de robot ticareti için ideal hale getirir. Kullanıcı kılavuzu: ayarlar, girişler ve strateji. Atom Analisti, Piyasada Daha İyi Bir Avantaj Bulmak İçin Fiyatın Gücünü ve Momentumunu Kullanan PA Fiyat Hareketi Göstergesidir. Gürültüleri ve Yanlış Sinyalleri Kaldırmaya ve Ticaret Potansiyelini Artırmaya Yardımcı Olan Gelişmiş Filtrelerle Donatılmıştır. Birden fazla katma
- Real price is 80$ - 40% Discount ( It is 49$ now ) Contact me for instruction, add group and any questions! Related Product:  Bitcoin Expert , Gold Expert Introduction The breakout and retest strategy is traded support and resistance levels. it involves price breaking through a previous level.  The break and retest strategy is designed to help traders do two main things, the first is to avoid false breakouts. Many false breakouts start with a candlestick that breaks out of a level but ends wi
Scalper Inside PRO
Alexey Minkov
4.73 (56)
An exclusive indicator that utilizes an innovative algorithm to swiftly and accurately determine the market trend. The indicator automatically calculates opening, closing, and profit levels, providing detailed trading statistics. With these features, you can choose the most appropriate trading instrument for the current market conditions. Additionally, you can easily integrate your own arrow indicators into Scalper Inside Pro to quickly evaluate their statistics and profitability. Scalper Inside
TPSproTREND PrO
Roman Podpora
4.79 (19)
TPSpro TREND PRO,   piyasayı otomatik olarak analiz eden, trend ve değişimlerinin her biri hakkında bilgi sağlayan, ayrıca yeniden çizmeden işlemlere girme sinyalleri veren bir trend göstergesidir! Gösterge her mumu ayrı ayrı analiz ederek kullanır. farklı dürtülere atıfta bulunur - yukarı veya aşağı dürtü. Para birimleri, kripto paralar, metaller, hisse senetleri ve endeksler için işlemlere tam giriş noktaları! Sürüm MT5                   GÖSTERGENİN TAM AÇIKLAMASI       Bunu -   RFI SEVİYELER
Enigmera
Ivan Stefanov
5 (3)
ENIGMERA: Pazarın çekirdeği https://www.enigmera.com Giriş Bu gösterge ve ticaret sistemi, finansal piyasalar için dikkate değer bir yaklaşımdır. ENIGMERA, destek ve direnç seviyelerini doğru bir şekilde hesaplamak için fraktal döngüleri kullanır. Gerçek birikim aşamasını gösterir ve yön ve hedefler verir.  İster bir trendde ister bir düzeltmede olalım çalışan bir sistem.  Nasıl çalışır? ENIGMERA üç çizgiden oluşur: destek/direnç çizgisi, hedef çizgisi ve sapma çizgisi. Sistem, geçmiş veril
Şu anda %20 İNDİRİMLİ! Herhangi bir Acemi veya Uzman Tüccar için En İyi Çözüm! Bu gösterge paneli yazılımı 28 döviz çifti üzerinde çalışıyor. Ana göstergelerimizden 2'sine (Gelişmiş Para Birimi Gücü 28 ve Gelişmiş Para Birimi Dürtüsü) dayanmaktadır. Tüm Forex piyasasına harika bir genel bakış sağlar. Gelişmiş Para Birimi Gücü değerlerini, para birimi hareket hızını ve tüm (9) zaman dilimlerinde 28 Forex çifti için sinyalleri gösterir. Trendleri ve / veya scalping fırsatlarını belirlemek içi
Gold Stuff
Vasiliy Strukov
4.89 (239)
Gold Stuff, özellikle altın için tasarlanmış bir trend göstergesidir ve herhangi bir finansal enstrümanda da kullanılabilir. Gösterge yeniden çizilmez ve gecikmez. Önerilen zaman dilimi H1. Bu göstergede tam otomatik Uzman Danışman EA Gold Stuff çalışır. Profilimde bulabilirsiniz. Ayarları ve kişisel bir bonusu almak için satın alma işleminden hemen sonra benimle iletişime geçin!  Güçlü Destek ve Trend Tarayıcı göstergemizin ücretsiz bir kopyasını pm'den alabilirsiniz. Ben! AYARLAR Ok Ç
Dynamic Forex28 Navigator - Yeni Nesil Forex Ticaret Aracı. ŞU ANDA %49 İNDİRİM. Dynamic Forex28 Navigator, uzun zamandır popüler olan göstergelerimizin evrimidir ve üçünün gücünü tek bir göstergede birleştirir: Gelişmiş Döviz Gücü28 Göstergesi (695 inceleme) + Gelişmiş Döviz İMPULS ve UYARI (520 inceleme) + CS28 Kombo Sinyalleri (Bonus). Gösterge hakkında ayrıntılar https://www.mql5.com/en/blogs/post/758844 Yeni Nesil Güç Göstergesi Ne Sunuyor?  Orijinallerde sevdiğiniz her şey, şimdi ye
Trend Punch
Mohamed Hassan
4.95 (19)
This indicator is unstoppable when combined with our other indicator called  Support & Resistance . After purchase, send us a message and you will get it   for  FREE as a BONUS! Introducing Trend Punch , the revolutionary forex trend indicator that will transform the way you trade! Trend Punch is uniquely designed to provide precise buy and sell arrows during strong market trends, making your trading decisions clearer and more confident. Whether you're trading major currency pairs or exotic sym
Trend Screener
STE S.S.COMPANY
4.8 (87)
Trend Göstergesi, Trend Alım Satım ve Filtreleme için Çığır Açan Benzersiz Çözüm, Tüm Önemli Trend Özellikleriyle Tek Bir Araç İçinde Yerleştirildi! Forex, emtialar, kripto para birimleri, endeksler ve hisse senetleri gibi tüm sembollerde/araçlarda kullanılabilen %100 yeniden boyamayan çoklu zaman çerçevesi ve Çoklu para birimi göstergesidir. SINIRLI SÜRELİ TEKLİF: Destek ve Direnç Tarama Göstergesi sadece 50$ ve ömür boyu mevcuttur. (Orijinal fiyat 250$) (teklif uzatıldı) Trend Screener, grafik
FX Volume
Daniel Stein
4.58 (33)
Sabah Brifingimiz aracılığıyla ayrıntılar ve ekran görüntüleri ile günlük piyasa güncellemenizi alın burada mql5 ve on Telegram ! FX Volume, bir brokerin bakış açısından piyasa duyarlılığı hakkında GERÇEK bir fikir veren İLK ve TEK hacim göstergesidir. COT raporlarından çok daha hızlı bir şekilde, brokerlar gibi kurumsal piyasa katılımcılarının Forex piyasasında nasıl konumlandıklarına dair harika bilgiler sağlar. Bu bilgileri doğrudan grafiğinizde görmek, ticaretiniz için gerçek oyun değiştir
TPSpro RFI Levels
Roman Podpora
4.82 (22)
TALİMATLAR         RUS   -        ENG       Bir gösterge ile kullanılması   önerilir       -       TPSpro   TREND PRO -   Sürüm MT4         Ticarette önemli bir unsur, bir ticaret aracını satın alma veya satma kararlarının alındığı bölgeler veya seviyelerdir. Büyük oyuncuların piyasadaki varlıklarını gizleme girişimlerine rağmen, kaçınılmaz olarak izler bırakırlar. Bizim görevimiz bu izleri nasıl tanımlayacağımızı ve doğru şekilde nasıl yorumlayacağımızı öğrenmekti. Ana işlevler:: Satıcılar ve
FX Power MT4 NG
Daniel Stein
5 (13)
Sabah Brifingimiz burada mql5 ve on Telegram! FX Power MT4 NG , uzun zamandır çok popüler olan döviz gücü ölçerimiz FX Power'ın yeni neslidir. Peki bu yeni nesil güç ölçer ne sunuyor? Orijinal FX Power hakkında sevdiğiniz her şey PLUS GOLD/XAU güç analizi Daha da hassas hesaplama sonuçları Ayrı ayrı yapılandırılabilir analiz dönemleri Daha da iyi performans için özelleştirilebilir hesaplama limiti Özel çokluDaha fazlasını görmek isteyenler için örnek ayarlar Her grafikte en sevdiğiniz renkler i
Öncelikle, bu Ticaret Aracının Non-Repainting, Non-Redrawing ve Non-Lagging Gösterge olduğunu vurgulamakta fayda var, bu da onu profesyonel ticaret için ideal hale getiriyor. Çevrimiçi kurs, kullanıcı kılavuzu ve demo. Akıllı Fiyat Hareketi Kavramları Göstergesi, hem yeni hem de deneyimli tüccarlar için çok güçlü bir araçtır. İleri ticaret fikirlerini, Inner Circle Trader Analizi ve Smart Money Concepts Ticaret Stratejileri gibi 20'den fazla kullanışlı göstergeyi bir araya getirerek bir araya g
Scalper Vault
Oleg Rodin
5 (27)
Scalper Vault , başarılı bir scalping için ihtiyacınız olan her şeyi size sağlayan profesyonel bir scalping sistemidir. Bu gösterge, forex ve ikili opsiyon tüccarları tarafından kullanılabilecek eksiksiz bir ticaret sistemidir. Önerilen zaman çerçevesi M5'tir. Sistem size trend yönünde doğru ok sinyalleri sağlar. Ayrıca size üst ve alt sinyaller ve Gann piyasa seviyeleri sağlar. Göstergeler, PUSH bildirimleri dahil her türlü uyarıyı sağlar. Göstergeyi satın aldıktan sonra lütfen benimle iletişim
MetaTrader 4 için Ultimate Gold Advisor Ultimate Gold Advisor, MetaTrader 4 üzerindeki ticaret deneyimini optimize etmek için tasarlanmış ileri teknolojik bir araçtır. Deneyimli yatırımcıların ihtiyaçlarını karşılamak amacıyla geliştirilen bu gösterge, doğruluk, sofistike analiz ve çok yönlü işlevselliği bir araya getirerek bilgiye dayalı ticaret kararlarını destekler. Altın ticareti için ideal olmakla birlikte, geniş bir varlık yelpazesinde de uygulanabilir olan Ultimate Gold Advisor, piyasa st
MetaBands M4
Vahidreza Heidar Gholami
5 (2)
MetaBands uses powerful and unique algorithms to draw channels and detect trends so that it can provide traders with potential points for entering and exiting trades. It’s a channel indicator plus a powerful trend indicator. It includes different types of channels which can be merged to create new channels simply by using the input parameters. MetaBands uses all types of alerts to notify users about market events. Features Supports most of the channel algorithms Powerful trend detection algorith
Stratos Pali
Michela Russo
5 (1)
Stratos Pali Indicator   is a revolutionary tool designed to enhance your trading strategy by accurately identifying market trends. This sophisticated indicator uses a unique algorithm to generate a complete histogram, which records when the trend is Long or Short. When a trend reversal occurs, an arrow appears, indicating the new direction of the trend. Important Information Revealed Leave a review and contact me via mql5 message to receive My Top 5 set files for Stratos Pali at no cost! D
Currency Strength Wizard , başarılı ticaret için size hepsi bir arada çözüm sağlayan çok güçlü bir göstergedir. Gösterge, birden çok zaman dilimindeki tüm para birimlerinin verilerini kullanarak şu veya bu forex çiftinin gücünü hesaplar. Bu veriler, şu veya bu para biriminin gücünü görmek için kullanabileceğiniz, kullanımı kolay para birimi endeksi ve para birimi güç hatları biçiminde temsil edilir. İhtiyacınız olan tek şey, işlem yapmak istediğiniz tabloya göstergeyi eklemektir ve gösterge size
GOLD Impulse with Alert
Bernhard Schweigert
4.56 (9)
Bu gösterge, 2 ürünümüz Advanced Currency IMPULSE with ALERT  +   Currency Strength Exotics  'in süper bir kombinasyonudur. Tüm zaman dilimleri için çalışır ve 8 ana para birimi artı bir Sembol için grafiksel olarak güç veya zayıflık dürtüsünü gösterir! Bu Gösterge, Altın, Egzotik Çiftler, Emtialar, Endeksler veya Vadeli İşlemler gibi herhangi bir sembol için para birimi gücü ivmesini göstermek için uzmanlaşmıştır. Türünün ilk örneğidir, Altın, Gümüş, Petrol, DAX, US30, MXN, TRY, CNH vb.
Market Structure
Reza Aghajanpour
4.85 (26)
** All Symbols x All Timeframes scan just by pressing scanner button ** *** Contact me  to send you instruction and add you in "Market Structure group" for sharing or seeing experiences with other users. Introduction: Market structure is important for both new and professional traders since it can influence the liquidity and price action of a market (Breakout and Retest). It’s also one of the most commonly used techniques to understand trends, identify potential reversal points, and get a feel f
Matrix Arrow Indicator MT4
Juvenille Emperor Limited
5 (3)
Matrix Arrow Indicator MT4 , forex, emtialar, kripto para birimleri, endeksler, hisse senetlerigibi tüm sembollerde/araçlarda kullanılabilen %100 yeniden boyamayan çoklu zaman çerçevesi göstergesini izleyen benzersiz bir 10'u 1 arada trenddir.  Matrix Arrow Indicator MT4 , mevcut eğilimi erken aşamalarında belirleyecek ve aşağıdakiler gibi 10'a kadar standart göstergeden bilgi ve veri toplayacaktır: Ortalama Yönlü Hareket Endeksi (ADX) Emtia Kanal Endeksi (CCI) Klasik Heiken Ashi mumları Hareke
IX Power MT4
Daniel Stein
5 (5)
IX Power nihayet FX Power'ın rakipsiz hassasiyetini Forex dışı sembollere getiriyor. En sevdiğiniz endeksler, hisse senetleri, emtialar, ETF'ler ve hatta kripto para birimlerindeki kısa, orta ve uzun vadeli eğilimlerin yoğunluğunu doğru bir şekilde belirler. Terminalinizin sunduğu her şeyi analiz edebilirsiniz. Deneyin ve işlem yaparken zamanlamanızın nasıl önemli ölçüde iyileştiğini deneyimleyin. IX Power Temel Özellikler 100 hassas, yeniden boyanmayan hesaplama sonuçları - terminalini
Fiyat tersine döndükçe ve geri çekildikçe piyasa yapısından elde edilen kâr değişir. Piyasa yapısını tersine çevirme uyarısı göstergesi, bir trendin veya fiyat hareketinin ne zaman tükenmeye yaklaştığını ve tersine dönmeye hazır olduğunu tanımlar. Genellikle bir geri dönüş veya büyük bir geri çekilme meydana gelmek üzereyken meydana gelen piyasa yapısındaki değişiklikler konusunda sizi uyarır. Gösterge, olası bir tükenme noktasının yakınında her yeni yüksek veya düşük oluştuğunda, başlangıçta
ŞU ANDA %31 INDIRIMLI !!! Yeni Başlayanlar veya Uzman Tüccarlar için En İyi Çözüm! Bu gösterge benzersiz, yüksek kaliteli ve uygun fiyatlı bir ticaret aracıdır çünkü bir dizi tescilli özellik ve gizli bir formül ekledik. Yalnızca BİR grafikle 28 döviz çiftinin tümü için Uyarılar verir. Yeni bir trendin veya scalping fırsatının tam tetik noktasını belirleyebildiğiniz için ticaretinizin nasıl gelişeceğini hayal edin! Yeni temel algoritmalar üzerine inşa edilen bu sistem, potansiyel işlemler
Gold Channel is a volatility-based indicator, developed with a specific timing algorithm for the XAUUSD pair, which consists of finding possible corrections in the market. This indicator shows two outer lines, an inner line (retracement line) and an arrow sign, where the theory of the channel is to help identify overbought and oversold conditions in the market. The market price will generally fall between the boundaries of the channel. If prices touch or move outside the channel it is a tra
Satın aldıktan sonra yorum bırakın, bonus olarak 4 yüksek kaliteli gösterge alın. Chart Patterns All-in-One göstergesi, traderların teknik analizde yaygın olarak kullanılan çeşitli grafik desenlerini görselleştirmelerine yardımcı olur. Bu gösterge, potansiyel piyasa hareketlerini belirlemeye yardımcı olur ancak kârlılığı garanti etmez. Satın almadan önce göstergeyi demo modunda test etmeniz önerilir. Mevcut Teklif : "Chart Patterns All in One" göstergesinde %50 indirim. Dahil Edilen Desenler : 1
Blahtech Supply Demand
Blahtech Limited
4.61 (33)
Was: $299  Now: $99   Supply Demand uses previous price action to identify potential imbalances between buyers and sellers. The key is to identify the better odds zones, not just the untouched ones. Blahtech Supply Demand indicator delivers functionality previously unavailable on any trading platform. This 4-in-1 indicator not only highlights the higher probability zones using a multi-criteria strength engine, but also combines it with multi-timeframe trend analysis, previously confirmed swings
AW Prime Oscillator
AW Trading Software Limited
5 (1)
İki osilatörün birleşimi. Birincisi giriş noktalarını, ikincisi ise mevcut trendi gösterir. Gösterge, osilatör sinyallerini iki modda oklarla görüntüleyebilir; tüm hızlı osilatör sinyalleri veya yalnızca mevcut trend yönündeki sinyaller. Çok zaman dilimli bir panele ve üç tür sinyal bildirimine sahiptir. Faydalar: Günlük ve scalping ticaretine uygundur Trend filtreleme Basit ve hassas kurulum Çoklu zaman dilimi paneli Bir danışmana entegrasyona uygundur. Herhangi bir sembol ve herhangi bir zama
Yazarın diğer ürünleri
Simple moving trend lines with support and resistance moving levels  used on any time frame on any symbols input: # of bars for trend lines (10-20- 50-100-200----) as per your time frame and your strategy  and     moving period ( 10-20 -50-100-200----) as per your time frame and your strategy Direction Arrows : UP and DOWN are drawn when breaking the trend lines ALerts available at Arrows appearance...  
Multi Strategies Combined Signal All in One   Multi Strategies Single Combined   Select from up to 6 Strategies solo or Combine different strategies for signal generation  (Combining more than 2 strategies may LIMIT a lot the number of signals)! ALL inputs and Strategies selection From Chart !!! Also Inputs editing from Chart !!! Push your strategy bottom (one strategy) OR Combine signal from as may strategies (up to 6) : Selected and enabled strategies will be in GREEN !!! 1- BUY SELL areas 2-
HEDGING  MASTER line indicator    It compares the power/strength lines of two user input symbols and create a SMOOTHED line that indicates the degree of deviation of the 2 symbols Strategy#1- FOLLOW THE INDICATOR THICK LINE when CROSSING O LEVEL DOWN --- TRADE ON INDICATOR THICK LINE (TREND FRIENDLY) !! Strategy#2- TRADE INDICATOR PEAKS (Follow indicator Reversal PEAKS Levels)!! you input - the index of calculation ( 10/20/30....)                 - the indicator Drawing start point (indicator hi
Buy Sell Zones1
Mohamed yehia Osman
Buy Sell Zones   Simple indicator for BUY / Sell Zones moving Buy and Sell zones : Closest zone is wide and clear : Red for Sell zone , Green for Buy zone >>> old far zones are in bold lines :::BUY Zones (GREEN) appear only in UP Trend and disappear in DOWN Trend :::SELL Zones (RED) appear only in DOWN Trend and disappear in UP Trend input parameters ::: index bars : bars range for zone calculation levels : number of zones  Up move/Down move arrows mail and message Alerts !! used on any symbol u
Automatic redrawing of Trend Supports and resistances levels and Possible Wedge pattern formation to indicate price breaking of Rising Wedge (signal SELL) or price breaking of falling Wedge (signal BUY) Very simple and smart indicator  ALERTS AND MOBILE NOTIFICATIONS availavle !!! you can edit the calculation bars of the bars count for formation of the trend lines and the initial shift from current price  Smaller values for bars /shift inputs when using Higher Time frames (D1-H4) and the reverse
Price Predictor
Mohamed yehia Osman
Price Predictor is an indicator that shows precise price reversals taking into account a higher time frame and a lower time frame candle patterns calculations it is great for scalping and swing trading  . Buy and sell arrows are shown on the chart as for entry signals.  BIG Arrows indicates the trend - SMALL Arrows signal a trade (BUY/SELL)   - A Green BIG UP Arrow with a support green line indicates a Bull Market : wait for buy signal       - A Green SMALL Up Arrow after a BIG green arrow is
Automatic redrawing of Trend Supports and resistances levels and Possible Wedge pattern formation to indicate price breaking of Rising Wedge (signal SELL) or price breaking of falling Wedge (signal BUY) Very simple and smart indicator  ALERTS AND MOBILE NOTIFICATIONS availavle !!! you can edit the calculation bars of the bars count for formation of the trend lines and the initial shift from current price  Smaller values for bars /shift inputs when using Higher Time frames (D1-H4) and the reverse
:::: It is programmed to work on any M5 Chat windows !! Used to determine the Strongest currency pairs and the Weakest pairs also detect the peak of deviation of currencies strength  IT CAN BE USED FOR INDICES AND STOCKS TOO !! Strategy one : It can be used in to BUY Strongest pair and SELL Weakest one Strategy two: It can be used on Daily basis to Hedge BUY Strongest pair with high % (ex: +1%) and BUY Weakest one with % lower(ex: -0.7%) the same with SELL  Strategy three: on 3days  or above ca
Auto redrawn Pivot support resistance horizontal lines  with signal of Buy/Sell possibilities with SL level and with trend support resistance lines too used for all symbols and time frames  you can adjust inputs parameters (only 2) and test it on various symbols and time frames input number of bars for calculation and moving average for signal accuracy example : use it on M30 time frame with input 200 for bars count and 100 for MA
A simple Approach to Elliot waves patterns Signal generated on trend continuation when breaking the "5" level or on corrective direction after 1-5 waves detected 1-5 labeled points arrows used for signal UP/DOWN direction Chaotic patterns in Blue are drawn all times until  a 1-5 Elliot wave pattern detected  1-5 Red pattern in Bull Market : UP arrow in BULL trend continuation OR DOWN arrow  as a reversal DOWN direction as pattern correction 1-5 Green pattern in Bear Market :DOWN arrow in BEAR tr
YOU DON'T HAVE TO SHIFT ON ALL TIME FRAMES FOR EACH CURRENCY PAIR TO CONCLUDE ITS TREND AND ITS POWER YOU HAVE IT ALL IN ONE TABLE , 20 CURRENCY PAIR WITH 5 TIME FRAMES ALSO , COMPARE BETWEEN CURRENCIES STRENGTH AND ALERTS THE STRONGER /WEAKER PAIR BASED ON 5 TIMEFRAMES CALCULATIONS The Power meter currencies table is a very helpful tool to indicate the TREND strength of up to 20 currencies pairs  using 5 time frames M5 M30 H1 H4 and D1 ( latest version You SELECT you own 5 timeframes from M1 t
Auto redrawn Pivot support resistance horizontal lines  with signal of Buy/Sell possibilities with SL level and with trend support resistance lines too used for all symbols and time frames  you can adjust inputs parameters (only 2) and test it on various symbols and time frames input number of bars for calculation and moving average for signal accuracy example : use it on M30 time frame with input 200 for bars count and 100 for MA
Smart and simple Indicator based on wolves waves reversal pattern also near to falling and rising wedge and butterfly patterns with Stoploss and entry signal preferred time frame M30 : with parameters bars count used for calculation = 200 and moving average for accuracy = 100; you can try it for other higher or lower parameters and try your own set of inputs higher timeframe = lower input !!! important note ::: Indicator don't back draw when first installed on Chart  once installed wait for new
This Indicator provides Buy/Sell Signal based on calculations on Higher frame (Trend) and Lower frame(Entry signals) * You should select the higher and lower frame for indicator calculations * You select the Trend line colors as you prefer * Enable or disable Alerts! Trend lines UP/Down are drawn when a trend is detected Wait for small arrows for entry : *Normally an UP arrow in an UP Trend is a BUY signal : ---you Close the BUY position IF a Reverse DOWN Trend signal appears Or when Up trend li
Buy Sell Zones
Mohamed yehia Osman
Simple indicator for BUY / Sell Zones moving Buy and Sell zones : Closest zone is wide and clear : Red for Sell zone , Green for Buy zone >>> old far zones are in bold lines :::BUY Zones (GREEN) appear only in UP Trend and disappear in DOWN Trend :::SELL Zones (RED) appear only in DOWN Trend and disappear in UP Trend input parameters ::: index bars : bars range for zone calculation levels : number of zones  Up move/Down move arrows mail and message Alerts !! used on any symbol used on any timefr
Crazy Dancing moving RES/SUP Levels Automatic redrawing of moving Supports and resistances levels  to indicate price breaking supports (signal SELL)  or breaking resistance levels (signal BUY) Very simple appearing indicator but very clever and smart too !!!! Main Inputs: # of bars for the support and resistances levels + the initial shift from start + moving average for filter signaling Smaller values for bars /shift inputs when using Higher Time frames (D1-H4) and the reverse higher values for
Select from up to 6 Strategies solo or Combine different strategies for signal generation  (Combining more than 2 strategies may LIMIT a lot the number of signals)! ALL From Chart !!! Also Inputs editing from Chart !!! Push your strategy bottom (one strategy) OR Combine signal from as may strategies (up to 6) : Selected and enabled strategies will be in GREEN !!! 1- BUY SELL areas 2- Support resistance break signal 3- Elliot wave continuation /reversal signal 4- Advanced Moving averages 5- Tren
SMOOTH DEVIATION line indicator for 2 symbols   It compares the power/strength lines of two user input symbols and create a SMOOTHED line that indicates the degree of deviation of the 2 symbols Strategy#1- FOLLOW THE INDICATOR THICK LINE when CROSSING O LEVEL DOWN --- TRADE ON INDICATOR THICK LINE (TREND FRIENDLY) !! Strategy#2- TRADE INDICATOR PEAKS (Follow indicator Reversal PEAKS Levels)!! you input - the index of calculation ( 10/20/30....)                 - the indicator Drawing start point
Simple 3 Moving  supports and resistance levels (Your Review /comment and feedback is important  !! Thanks) Signal UP and Down possibilities created on crossing the multi supports/resistance levels supports all time frames Adjusted inputs for area covered for generating the levels and the shifts needed to cover 3 areas supports /resistances levels for example you may use main parameters in M30 time frames: extern int ShiftFromStart=20;  extern int barsCount=20; extern int sequenceShifts=50;  in
SMOOTH STRENGTH METER INDICATOR (SMOOTH LINE) it draws Currencies TREND Volatility Power / Strength lines : -       Detects the 2 highly TRENDED Volatile pairs  ( will be the Bold Lines ) - A very Helpful Indicator - It draws smooth lines for up to 20 currencies pairs representing Volatility  strength and power - First it indicates the most powerful trended direction pairs : Strongest / Weaker -       MAIN FUNCTION  :it gives indication of the       UP trend most Volatile Line  and the      DOWN
Smart EA based on Trend and Support Resistance Levels with SL results given on EURUSD  H1 for last 10 months IF AUTOLOT enabled: **if LotRisk =1- 3 ---- Profit up to 50%  DD up to 17% **if LotRisk > 5 /10 /20 --- HIGH RISK --- HIGH Profit up to 1600 % or More but High DD up to 40% tested also on other symbols GBPUSD with positive results *** used parameters on H1 timeframe  bars 25  shift 4 ma index 0.85 for lower time frames Inputs will me doubled or tripled ...  for higher time frames inputs
Trend Balance Bar
Mohamed yehia Osman
Trend Bar Balance Indicator Simple indicator based on trend detection and support resistance breakage  It detects the major trend and the minor support and resistance levels *** a signal for UP /BUY is detected and alerted in a BULL trend and a resistance level break *** a signal for DOWN /SELL is detected and alerted  in a Bear trend and a support level break THE POWER OF THIS INDICATOR I USE IT WHEN YOU COMBINE ITS DAILY SIGNALS FROM DIFFERENT CHART SYMBOLS AT SAME TIME AND CLOSE ALL ORDERS BY
SYMBOL POWER based on inputted 5 time frames and Compared to 20 Other Symbols !! Great Indicator YOU DON'T HAVE TO SHIFT ON ALL TIME FRAMES FOR EACH CURRENCY PAIR TO CONCLUDE ITS TREND AND ITS POWER YOU HAVE IT ALL IN ONE TABLE , 20 CURRENCY PAIR WITH 5 TIME FRAMES ALSO , COMPARE BETWEEN CURRENCIES STRENGTH AND ALERTS THE STRONGER /WEAKER PAIR BASED ON 5 TIMEFRAMES CALCULATIONS ALEERTS enable /disable using 5 time frames M5 M30 H1 H4 and D1   ( latest version You SELECT you own 5 timeframes from
Multi Strategies Single Combined   Select from up to 6 Strategies solo or Combine different strategies for signal generation  (Combining more than 2 strategies may LIMIT a lot the number of signals)! ALL inputs and Strategies selection From Chart !!! Also Inputs editing from Chart !!! Push your strategy bottom (one strategy) OR Combine signal from as may strategies (up to 6) : Selected and enabled strategies will be in GREEN !!! 1- BUY SELL areas 2- Support resistance break signal 3- Elliot wave
Trend Lines Signal   This Indicator provides Buy/Sell Signal based on calculations on Higher frame (Trend) and Lower frame(Entry signals) * You should select the higher and lower frame for indicator calculations * You select the Trend line colors as you prefer * Enable or disable Alerts! Trend lines UP/Down are drawn when a trend is detected Wait for small arrows for entry : *Normally an UP arrow in an UP Trend is a BUY signal : ---you Close the BUY position IF a Reverse DOWN Trend signal appear
SYMBOL POWER based on inputted 5 time frames and Compared to 20 Other Symbols !! Great Indicator YOU DON'T HAVE TO SHIFT ON ALL TIME FRAMES FOR EACH CURRENCY PAIR TO CONCLUDE ITS TREND AND ITS POWER YOU HAVE IT ALL IN ONE TABLE , 20 CURRENCY PAIR WITH 5 TIME FRAMES ALSO , COMPARE BETWEEN CURRENCIES STRENGTH AND ALERTS THE STRONGER /WEAKER PAIR BASED ON 5 TIMEFRAMES CALCULATIONS ALEERTS enable /disable using 5 time frames M5 M30 H1 H4 and D1     ( latest version You SELECT you own 5 timeframes fr
TWO SYMBOLS CORRELATION  line indicator    It compares the power/strength lines of two user input symbols and create a SMOOTHED line that indicates the degree of deviation of the 2 symbols Strategy#1- FOLLOW THE INDICATOR THICK LINE when CROSSING O LEVEL DOWN --- TRADE ON INDICATOR THICK LINE (TREND FRIENDLY) !! Strategy#2- TRADE INDICATOR PEAKS (Follow indicator Reversal PEAKS Levels)!! you input - the index of calculation ( 10/20/30....)                 - the indicator Drawing start point (ind
Symbols Strength meter Graph  :::: It is programmed to work on any M5 Chat windows !! Used to determine the Strongest currency pairs and the Weakest pairs also detect the peak of deviation of currencies strength  IT CAN BE USED FOR INDICES AND STOCKS TOO !! Strategy one : It can be used in to BUY Strongest pair and SELL Weakest one Strategy two: It can be used on Daily basis to Hedge BUY Strongest pair with high % (ex: +1%) and BUY Weakest one with % lower(ex: -0.7%) the same with SELL  Strateg
Trend Follower and Reversal Trend handler * EA opens X Lot position (calculated according to Lot risk value) with trend with indicated TP if Trend reversal occurs * EA opens 5 X Lot (if input " Reversal Lot scaling" = 5     ) position with reversal trend with indicated TP and same SL for old trend position * Increasing LOT risk value + Increasing Reversal Lot scaling value = High Risk and High Profit and High DD * Decreasing LOT risk value + Decreasing Reversal Lot scaling = Low Risk and Low Pr
Filtrele:
İnceleme yok
İncelemeye yanıt
Sürüm 2.2 2020.06.25
graphical enhancement
Sürüm 2.1 2020.06.25
minimizing redrawn effects
Sürüm 2.0 2020.06.22
adding option to Enable/Disable inclusion of different time frames(M1 M5 M15 M30 H1, H4 , D1) in calculations