• Genel bakış
  • İncelemeler (19)
  • Yorumlar (41)
  • Yenilikler

Trading box Rectangle extender

5

Place price Alerts on extended Rectangles and Trendlines - Risk reward indicator mt4

Extend Rectangles & Trendlines to the right edge

Mark your supply demand zones with extended rectangle and draw support resistance lines with extended trendline.

Find detailed manuals here. Find contacts on my profile.

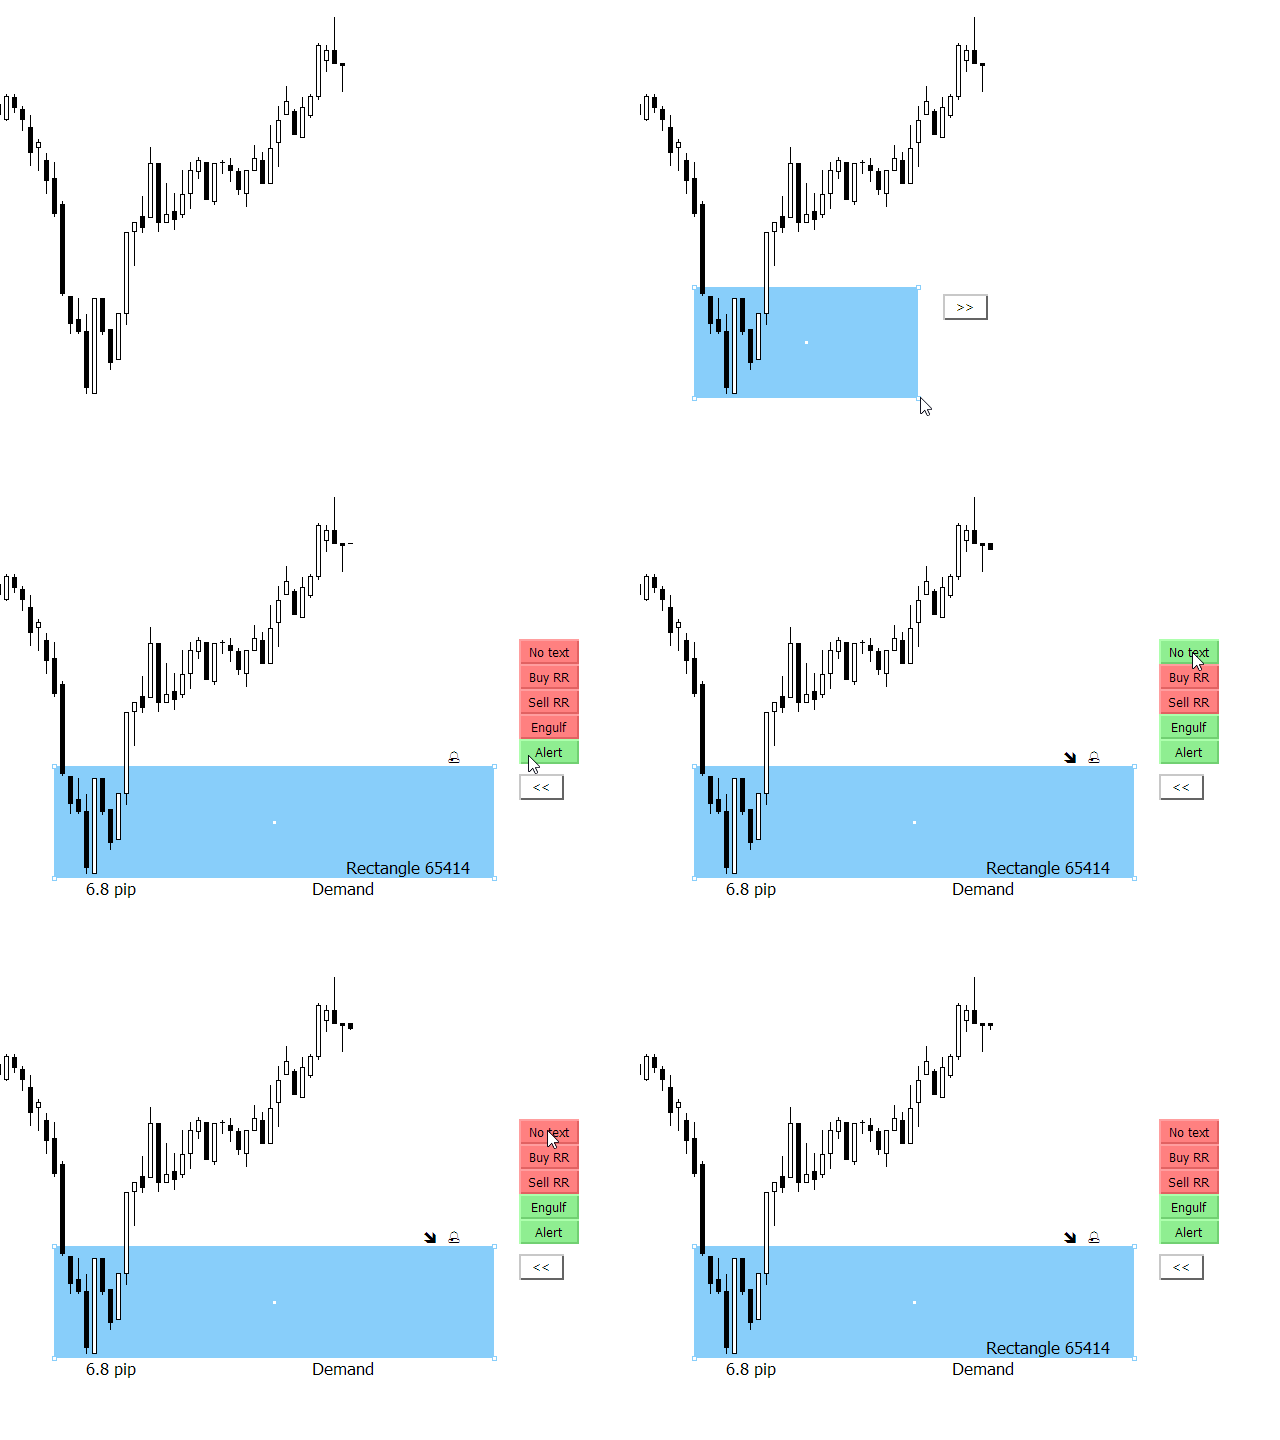
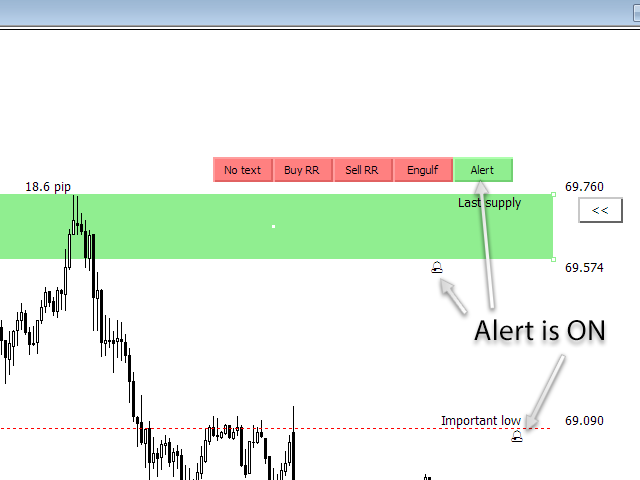
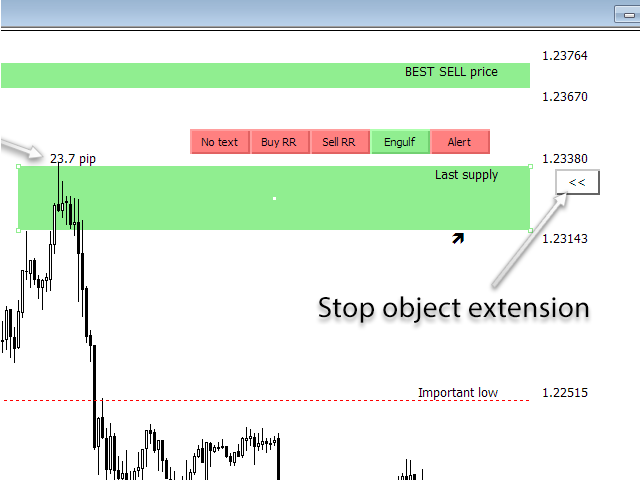
MT4 Rectangle extender indicator will simplify and make it easier for you to analyze markets and stay notified about important events. When you extend rectangle or trendline the action buttons will be shown (Alert, Engulf, Risk Reward). You will receive alert and mobile push notification when price touch or break (engulf) rectangle or trendline.


Smart Rectangle Extender or Zone Extender

Rectangles and Trendlines will be extended into future with one click. Rectangle pip size, name and prices will be displayed around rectangle


Price Alert and Engulf Alert

Price Alert and Engulf detection in Rectangle extender are supported with MT4 mobile push notifications and email alert. Phone alert or smartphone alert for price level alert  Trendline alert and line alert. rectangle reader indicator


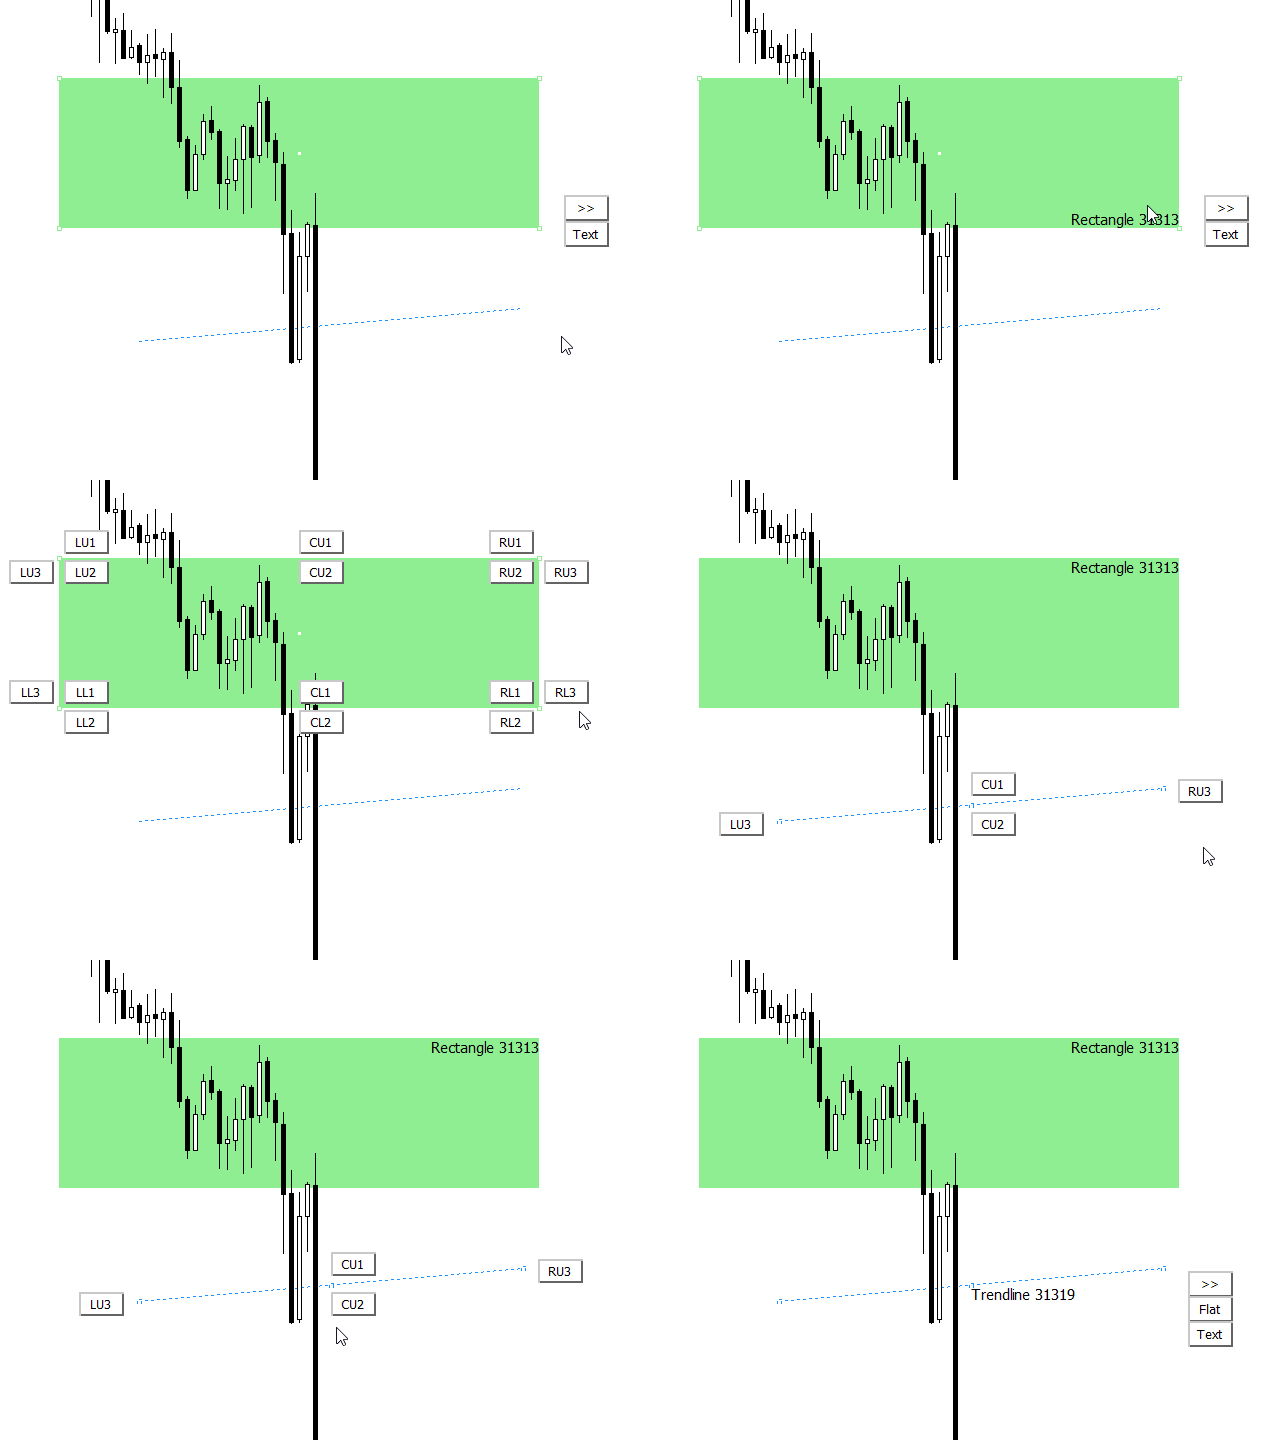
Flat trendline

Button that will change trendline to horizontal flat trendline


Show object name

Text button that gives options to display rectangle or trendline text in all possible spots around or inside object. This works for non-extended rectangles and trendlines where we would like to have object name displayed in suitable place around or inside object. (rectangle indicator, rectangle zone)


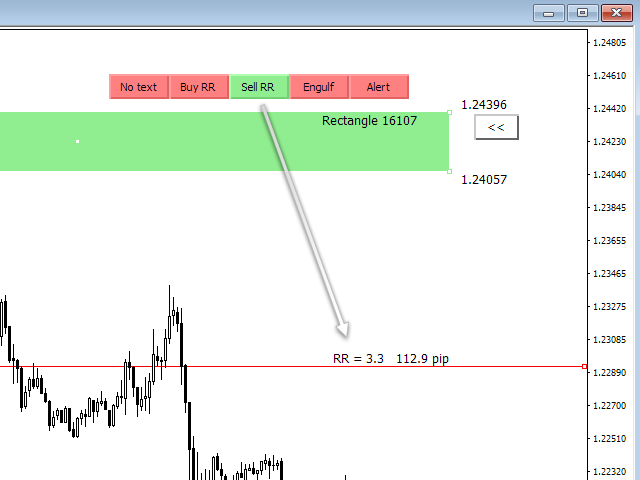
Risk reward ratio calculation

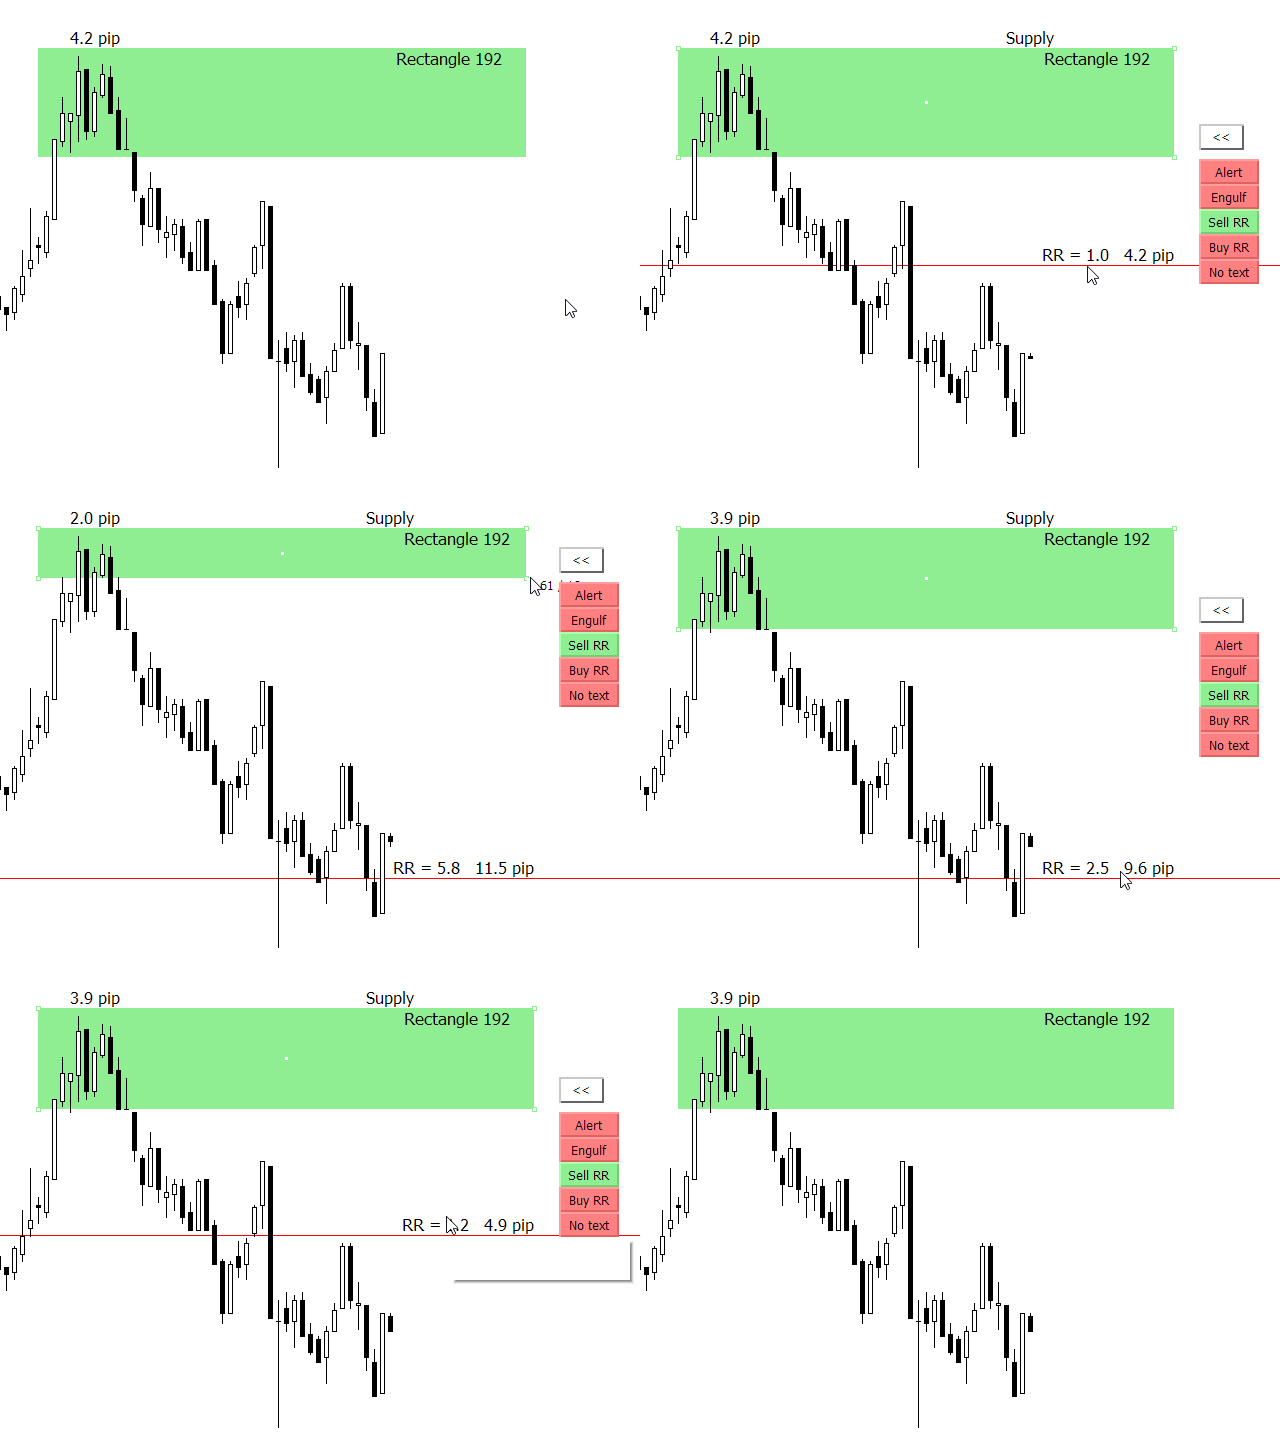
You can enable Risk Reward (RR) calculation with click on button Buy RR or Sell RR. Horizontal line will be displayed, and it will show Risk Reward ratio and pip distance between extended rectangle and horizontal RR line. You can select and move horizontal RR line to get your risk reward calculation information


Pip distance in brackets

It calculates pip difference between Bid and object price and display it at the right side of extended object


Timeframe colors for extended rectangle and trendline (multi timeframe analysis support)

User can define different colors for timeframe groups (separately for rectangles or trendlines):

Color 1: M1, M5, M15

Color 2: M30, H1, H4

Color 3: D1, W1, MN


Indicator customization

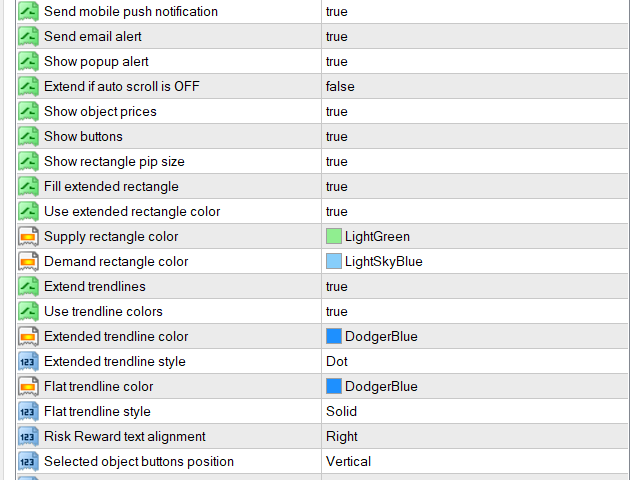
Trader can customize MT4 rectangle extender indicator with input properties. You can change colors, font size, element display position and some other features


Input property Description
Bring Alerted chart to the top True or false
Show pip distance in brackets True or false
Show object prices Show or hide prices on the right side of rectangle or trendline
Show buttons Show or hide buttons on the right side of selected rectangle or trendline
Show rectangle pip size Show or hide rectangle pip size
Fill extended rectangle When you extend rectangle, it will be filled with background color if variable is set to true
Supply rectangle color Default color for rectangles that are extended above bid price
Demand rectangle color Default color for rectangles that are extended below bid price
Extended trendline color We can set default color of extended trendline
Extended trendline style We can set default line style of extended trendline
Risk Reward text alignment We can display Risk Reward ratio calculation on left or right side of chart


İncelemeler 19
prequest01
624
prequest01 2022.12.27 14:28 
 

Excellent tool, very versatile and powerful for your TA. The author is very responsive and takes personal feedback to quickly implement. A must have indicator in your trading arsenal.

Gaved
229
Gaved 2022.02.01 20:45 
 

Great work. Recommended.

Lungisa Gina
38
Lungisa Gina 2021.12.22 11:43 
 

I trade Support & Resistance Zones and this tool is a game-changer for me.

Önerilen ürünler
The Nihilist 5.0 Indicator includes Forexalien and Nihilist Easy Trend trading strategies and systems. It is composed of an MTF Dashboard where you can analyze the different input possibilities of each strategy at a glance. It has an alert system with different types of configurable filters. You can also configure which TF you want to be notified on your Metatrader 4 platform and Mobile application The indicator has the option to view how could be a TP and SL by using ATR or fixed points, even
Graphic Shapes -using history, it projects four types of graphical shapes at the moment, allowing you to determine the main ranges of price movement in the future, as well as gives an understanding of the main market reversals, while giving entry points by priority!The panel contains three types of figure sizes expressed by timeframes. They allow you to conduct a complete market analysis without using additional tools! The indicator is a powerful tool for forecasting price movements in the forex
Summer 40% discount ($149 -> $88) Everything for chart Technical Analysis indicator mt4 in one tool Draw your supply demand zone with rectangle and support resistance with trendline and get alerts to mobile phone or email alert -  Risk reward indicator Video tutorials, manuals, DEMO download   here .  Find contacts on my   profile . 1.   Extended rectangles and trendlines Object will be extended to the right edge of the chart when price will draw new candles on chart. This is rectangle extend
Summary This indicator is based on RSI and Momentum indicators. It also considers moving averages of these two indicators. The three indicators have adjustable settings. The arrows do not repaint since the indicator only uses confirmed values and waits for the candle to close before painting an arrow. The indicator is also able to alert when arrows appear. There are 3 types of alerts - Popup, Email and Mobile Push Notifications. The arrows can be used in the EA and the inputs can also be optimiz
FREE
The indicator shows De Mark patterns and gives trading signals in the form of arrows and alerts. Shows De Mark lines on the history of quotes. Has a multiframe., Can show DeMark patterns of higher timeframes on lower timeframes. Has a switchable function for displaying fractals. Trading signals are accompanied by sound alerts, as well as sending them to mail and mobile devices.
NAM Divergences
NAM TECH GROUP, CORP.
5 (1)
MT4 Multi-timeframe Divergence and Overbougt/Oversold detection indicator. Features - Fully customizable on chart control panel, provides complete interaction. - Hide and show control panel wherever you want. - Real time information about non-capitalized divergences. - Real time information about overbougt / oversold situations. - Real time information about regular divergences. - Real time information about hidden divergences. - Oscillators available for divergences detection: AO, RSI, CCI, M
Bermaui Channel
Muhammad Elbermawi
5 (19)
This is a price channel that shows five important price levels on the chart. Those levels are: 1. The Highest High (HH) of the previous x bars. 2. The Highest Low (HL) of the previous x bars. 3. The Center Line. 4. The Lowest High (LH) of the previous x bars. 5. The Lowest Low (LL) of the previous x bars. How does Bermaui Channels Captures Overbought  area Think of the distance between HH and HL levels as an overbought area. When the price candles or bars crosses the HL to the upside this
Ultimate pattern builder indicator Allows you to build any pattern with up to 3 candlesticks (+ special fourth). This indicator is special because you can create any pattern you want, by modifying body and both wicks separately to your needs. If you ever wanted to create your own patterns , or just adjust any known popular pattern, then this is perfect for you. With this indicator you can learn how to build candles, testing it in strategy tester and get marked new candles on realtime charts, h
FREE
Description  Fibo Retracement  is an indicator that automatically plots  Fibonacci  levels in the main chart based on Close prices , which distinguishes it from the Fibo Levels indicator that plots levels based on High/Low prices. Thus, using both indicators provides the trader with the opportunity of determining support and resistance zones by Fibonacci! The levels are calculated and plotted over a certain interval using the number of bars specified by the user. The user can display Fibonacci l
MAtsi
Vasja Vrunc
Professional 0 Lag MAs Trend Sensor Indicator MAtsi is a trend sensor indicator , where 2 MA-s operates simultaneously . It is designed to cover a wider range of dynamic trends, where MAi is not so effective. Included averages are described in MAi indicator code section. MAtsi indicator can run many instances, for all time frames at once, so you can test and compare results with different settings. It is very fast and has, like all our indicators, a built-in " slider history testing " techn
Mr Beast Paterns with alerts
Luis Mariano Vazquez Marcos
El indicador "MR BEAST PATTERNS WITH ALERTS" es una herramienta avanzada diseñada para identificar y notificar automáticamente patrones de oportunidad en el mercado financiero. Basándose en una combinación de análisis técnico y algoritmos inteligentes, este indicador escanea constantemente el gráfico en busca de patrones específicos que podrían indicar momentos propicios para la toma de decisiones. Características Principales: Detección de Patrones: El indicador identifica patrones de oportunida
GreenBox
Taro Mitsuyasu
It is an indicator that analyzes the high and low prices in real time by Dow theory, draws a trend line, and draws the predicted arrival point in the Box format after breaking the low price and the high return price. The high and low prices are determined by the nBars parameter (initial value = 5), but displaying the corresponding moving averages (SMA and EMA 4 to 5 times nBars) at the same time makes it easier to understand the trend change. (D ownload the demo version of the free GreenBox and
KFX Symbol Changer
Peter Kariuki Thande
4 (1)
KFX SMA: Symbol Changer + Moving Average (3x) + ATR + RSI + Candle Timer. This indicator allows you to create a Symbol list and change between symbols of the current chart or Timeframe by selecting the appropriate button. On Chart there are three(3) multi timeframe Moving Averages shown (selected by you), ATR Value MTF ( selected by you -  helps with setting SL and TP), RSI Value MTF (selected by you) and a Candle Timer.   Features: - Symbol Changer : Change Symbol and Timeframe of Chart.   (
FREE
Simply drop the indicator to the graph and support and resistance levels will be shown automatically! The indicator for automatic drawing of support and resistance levels based on THREE points. Identified points are marked on the chart Indicator shows break through price for both bullish and bearish trends (if found) You can specify on how many bars the indicator shall look in order to identify supporting points. In addition, you can select on which time frame the indicator will work. That means
Fibo label
Damir Satridinov
5 (1)
Индикатор рисует уровни Фибоначчи с выделенными Ценовыми метками.При установке индикатора на график необходимо создать трендовую линию с именем указанным в поле" Unique name of trend line to place fib on ". По умолчанию имя=" Unique name of trend line to place fib on"  =     "+"    .В индикаторе можно заменить уровни фибоначчи по своему усмотрению.Также меняются цвет,стиль,толщина линий и т. д.
FREE
Description Heiken Ashi Multicurrency  is a colored well-known multicurrency/multy-symbol indicator. It shows a financial instrument as a smoothed candlestick chart in a separate window below the chart of the main financial symbol. The indicator may be used with any broker, irrespective of the name of the financial instrument since it is necessary to manually enter the name as an input parameter. If you enter a non-existent or incorrect name of a financial instrument, you will receive an error m
Japanese Candlesticks Monitor scans Japanese candlesticks. It shows a vertical line and a name of a probable candlestick pattern. The indicator is constantly updated, and new patterns are added. Your feedback is most welcome. I have just started working on the indicator, and your opinions are highly appreciated . The indicator does not work on history data . If the indicator has not been launched at a candle opening, that candle is not considered. This means that the indicator works in real time
Algo Trading Indicaor  With this indicator , you’ll have zones and trends that hight probability the price will reverse from it. so will gives you all the help that you need  Why should you join us !?  1-This indicator is logical since it’s working in previous days movement , to predict the future movements. 2-Algo trading indicator will help you to draw trends which is special and are too strong than the basics trend , trends will change with the frame time that you work on . 3-We can
Indicator. Zones of support and resistance levels The most reliable tool in the hands of any technical analyst is support and resistance levels.It is these levels that magically work in the market, because the price then bounces off them, on the contrary, gaining maximum acceleration, punching them and striving for a new price point.However, in practice, many beginners face enormous difficulties in building them.This is due to the fact that the price may react quite differently to them, and ofte
The  Market Sessions Indicator for MT4 helps you predict market turnarounds  by detecting major supply and demand areas. These pivot points tend to occur after a new session has started and the previous one is still open. It is also used to gauge how many points or pips the market moves on average during a session. This helps us to place better our take profits and stop losses. The indicator works on all forex pairs, gold, silver, commodities, stocks, indices and any other instrument that your b
Master Phi is an indicator based on Fibonacci numbers. It analyzes the percentage values returning the proportion of the Golden Section. You can customize values and set custom levels so you will create your personal Trading. The attention on the minimums and the maximums of timeframes allows accurate analysis in order to intercept very precisely the trading levels after the various impulse movements. Input Values Time_Frame to analyze LEVELS SETTINGS 9 levels (in percentage) 9 colors LINE SET
Profit MACD
Aleksey Ivanov
5 (2)
I present an indicator for professionals. ProfitMACD is very similar to classic MACD in appearance and its functions . However, ProfitMACD is based on completely new algorithms (for example, it has only one averaging period) and is more robust, especially on small timeframes, since it filters random price walks. The classic MACD indicator (Moving Average Convergence / Divergence) is a very good indicator following the trend, based on the ratio between two moving averages, namely the EM
The Transition Trend indicator shows the points of potential market reversal. The indicator's smart algorithm detects the trend, filters out market noise and generates entry signals and exit levels. Simple, visual and efficient trend detection. Uses just one parameter for settings. The indicator does not redraw and does not lag. You can set up message alerts as sound or email. Works on all currency pairs and all timeframes. Ready-made trading system.
Dow trend bands
Mariusz Piotr Rodacki
This indicator is not only for trading but also for learning, thanks to it, you can learn to identify trend, support and resistance. You've probably heard about the Dow trend theory, where higher highs and higher lows indicate an uptrend, and lower highs and lower lows indicate a downtrend. This indicator determines this trend based on the Dow Theory. You just need to enter a number representing the number of candles between extremes. The optimal solution is the number 3 (H1 TF), unless you
FREE
FIBO Trend PRO mt4
Evgenii Aksenov
4.67 (15)
The indicator allows you to instantly determine the current trend by color and FIBO levels. Higher Timeframe the panel shows the current trend of higher periods, helping to determine the strength of the trend Trade according to the trend when changing the color of candles or trade against the trend when the price hit the extreme levels of the   FIBO Trend PRO  indicator     Advantages of the FIBO Trend PRO Indicator never repaint and does not change their values Very easy to use and intuitive
FREE
Thư viện này bao gồm: * Mã nguồn struct của 5 cấu trúc cơ bản của MQL4: + SYMBOL INFO + TICK INFO + ACCOUNT INFO * Các hàm cơ bản của một robot + OrderSend + OrderModify + OrderClose * String Error Runtime Return * Hàm kiểm tra bản quyền của robot, indicator, script * Hàm init dùng để khởi động một robot chuẩn * Hàm định dạng chart để không bị các lỗi nghẽn bộ nhớ của chart khi chạy trên VPS * Hàm ghi dữ liệu ra file CSV, TXT * Hỗ trợ (mã nguồn, *.mqh): dat.ngtat@gmail.com
Trend Divergence Indicator: Your Essential Tool for Market Analysis The Trend Divergence Indicator is a powerful tool designed to assist traders in identifying market trends and pinpointing entry points with precision. By leveraging price divergence, this indicator enhances your trading strategy, offering reliable insights and filtering unnecessary signals. Key Features and Benefits of the Trend Divergence Indicator Accurate Trend Analysis: The Trend Divergence Indicator uses price divergence t
A top-quality from the famous XSuper Trend indicator. It is completely loyal to the original algorithm, and implements many useful features Which includes Trend Indicators as Filters like MACD,CCI and Alligator. The Chefs Super Trend Plus Indicator is a great way to identify the current market trend. The indicator shows a clear distinction between uptrends and downtrends. The indicators has optional filters for sound signal. Suitable for the following trending pairs: EUR/USD, GBP/USD, USD/JPY,
The indicator draws trend lines based on Thomas Demark algorithm. It draws lines from different timeframes on one chart. The timeframes can be higher than or equal to the timeframe of the chart, on which the indicator is used. The indicator considers breakthrough qualifiers (if the conditions are met, an additional symbol appears in the place of the breakthrough) and draws approximate targets (target line above/below the current prices) according to Demark algorithm. Recommended timeframes for t
CMI - Profit from trending and ranging markets. The CMI indicator is a two-part system used to trigger both trend and counter-trend trades, that has been introduced by Daniel Fernandez in an article published in Currency Trading Magazine (August 2011 issue). It is a simple, yet effective indicator, which gauges whether the market has behaved in a choppy (non-directional) manner or trending (directional) manner. CMI calculates the difference between the most recent bar's close and the close n bar
Bu ürünün alıcıları ayrıca şunları da satın alıyor
Gann Made Easy
Oleg Rodin
4.83 (92)
Gann Made Easy , bay teorisini kullanarak ticaretin en iyi ilkelerine dayanan, profesyonel ve kullanımı kolay bir Forex ticaret sistemidir. WD Gann. Gösterge, Zararı Durdur ve Kâr Al Seviyeleri dahil olmak üzere doğru SATIN AL ve SAT sinyalleri sağlar. PUSH bildirimlerini kullanarak hareket halindeyken bile işlem yapabilirsiniz. Lütfen satın aldıktan sonra benimle iletişime geçin! Alım satım ipuçlarımı ve harika bonus göstergelerini ücretsiz olarak sizinle paylaşacağım! Muhtemelen Gann ticaret y
Bull versus Bear
Mohamed Hassan
4.8 (5)
Official Release price of $65 for the first 27 /3 0  copies (3 copies left). Next price is $120 !  Send us a message after your purchase to receive more information on how to get your  BONUS  for FREE  that works in great combination with Bull vs Bear ! Bull versus Bear is an easy-to-use Forex indicator that gives traders clear and accurate signals based on clear trend retests . Forget about lagging indicators or staring at charts for hours because  Bull vs Bear provides real-time entries w
FX Volume
Daniel Stein
4.58 (33)
Sabah Brifingimiz aracılığıyla ayrıntılar ve ekran görüntüleri ile günlük piyasa güncellemenizi alın burada mql5 ve on Telegram ! FX Volume, bir brokerin bakış açısından piyasa duyarlılığı hakkında GERÇEK bir fikir veren İLK ve TEK hacim göstergesidir. COT raporlarından çok daha hızlı bir şekilde, brokerlar gibi kurumsal piyasa katılımcılarının Forex piyasasında nasıl konumlandıklarına dair harika bilgiler sağlar. Bu bilgileri doğrudan grafiğinizde görmek, ticaretiniz için gerçek oyun değiştir
Atomic Analyst
Issam Kassas
5 (2)
Öncelikle belirtmek gerekir ki bu Ticaret Göstergesi Yeniden Çizim Yapmaz, Gecikmez ve Gecikme Göstermez, bu da hem manuel hem de robot ticareti için ideal hale getirir. Kullanıcı kılavuzu: ayarlar, girişler ve strateji. Atom Analisti, Piyasada Daha İyi Bir Avantaj Bulmak İçin Fiyatın Gücünü ve Momentumunu Kullanan PA Fiyat Hareketi Göstergesidir. Gürültüleri ve Yanlış Sinyalleri Kaldırmaya ve Ticaret Potansiyelini Artırmaya Yardımcı Olan Gelişmiş Filtrelerle Donatılmıştır. Birden fazla katma
Gold Stuff
Vasiliy Strukov
4.89 (241)
Gold Stuff, özellikle altın için tasarlanmış bir trend göstergesidir ve herhangi bir finansal enstrümanda da kullanılabilir. Gösterge yeniden çizilmez ve gecikmez. Önerilen zaman dilimi H1. Bu göstergede tam otomatik Uzman Danışman EA Gold Stuff çalışır. Profilimde bulabilirsiniz. Ayarları ve kişisel bir bonusu almak için satın alma işleminden hemen sonra benimle iletişime geçin!  Güçlü Destek ve Trend Tarayıcı göstergemizin ücretsiz bir kopyasını pm'den alabilirsiniz. Ben! AYARLAR Ok Ç
Scalper Inside PRO
Alexey Minkov
4.73 (56)
An exclusive indicator that utilizes an innovative algorithm to swiftly and accurately determine the market trend. The indicator automatically calculates opening, closing, and profit levels, providing detailed trading statistics. With these features, you can choose the most appropriate trading instrument for the current market conditions. Additionally, you can easily integrate your own arrow indicators into Scalper Inside Pro to quickly evaluate their statistics and profitability. Scalper Inside
FX Power MT4 NG
Daniel Stein
5 (13)
Sabah Brifingimiz burada mql5 ve on Telegram! FX Power MT4 NG , uzun zamandır çok popüler olan döviz gücü ölçerimiz FX Power'ın yeni neslidir. Peki bu yeni nesil güç ölçer ne sunuyor? Orijinal FX Power hakkında sevdiğiniz her şey PLUS GOLD/XAU güç analizi Daha da hassas hesaplama sonuçları Ayrı ayrı yapılandırılabilir analiz dönemleri Daha da iyi performans için özelleştirilebilir hesaplama limiti Özel çokluDaha fazlasını görmek isteyenler için örnek ayarlar Her grafikte en sevdiğiniz renkler i
FX Levels, geleneksel Lighthouse yöntemini yenilikçi bir dinamik yaklaşımla birleştiren ve tüm ticaret sembollerinde kusursuz bir şekilde çalışan son derece doğru bir destek ve direnç göstergesidir. Buna döviz çiftleri, endeksler, hisse senetleri veya emtialar dahildir. FX Levels, tersine dönme noktalarını belirler ve bunları grafikte görüntüler, bu da ticaret faaliyetlerinizde kar hedefleri olarak ideal bir şekilde kullanılabilir. FX Levels'ı geliştirirken, brokerlar ve onların veri akışları i
The Stochastic Basket Currency Strenght  brings the Stochastic indicator to a new level.  Expanding the boundaries of TimeFrames and mono-currency analysis, the SBCS take the movements of each currency that composes the cross and confront them in the whole basket of 7 crosses.  The indicator works with any combination of AUD, CAD, CHF, EUR, GBP, JPY, NZD, USD pairs and with full automation takes in account every stochastic value (main line) for the selected Time Frame.  After that, the indicator
TPSproTREND PrO
Roman Podpora
4.79 (19)
TPSpro TREND PRO,   piyasayı otomatik olarak analiz eden, trend ve değişimlerinin her biri hakkında bilgi sağlayan, ayrıca yeniden çizmeden işlemlere girme sinyalleri veren bir trend göstergesidir! Gösterge her mumu ayrı ayrı analiz ederek kullanır. farklı dürtülere atıfta bulunur - yukarı veya aşağı dürtü. Para birimleri, kripto paralar, metaller, hisse senetleri ve endeksler için işlemlere tam giriş noktaları! Sürüm MT5                   GÖSTERGENİN TAM AÇIKLAMASI       Bunu -   RFI SEVİYELER
Trend Screener
STE S.S.COMPANY
4.81 (88)
Trend Göstergesi, Trend Alım Satım ve Filtreleme için Çığır Açan Benzersiz Çözüm, Tüm Önemli Trend Özellikleriyle Tek Bir Araç İçinde Yerleştirildi! Forex, emtialar, kripto para birimleri, endeksler ve hisse senetleri gibi tüm sembollerde/araçlarda kullanılabilen %100 yeniden boyamayan çoklu zaman çerçevesi ve Çoklu para birimi göstergesidir. SINIRLI SÜRELİ TEKLİF: Destek ve Direnç Tarama Göstergesi sadece 50$ ve ömür boyu mevcuttur. (Orijinal fiyat 250$) (teklif uzatıldı) Trend Screener, grafik
Reversal-Arrow: Hassas ve Güvenilir Dönüş Noktaları Tespiti Reversal-Arrow, potansiyel trend dönüş noktalarını belirlemek için tasarlanmış gelişmiş bir göstergedir. Bu gösterge, görsel olarak anlaşılır sinyaller sunarak piyasa ortamını anlamayı kolaylaştırır, belirsizlikleri azaltır ve karar alma sürecini basitleştirir. Özellikle XAUUSD ve XAUEUR için 1, 5 ve 15 dakikalık zaman dilimlerinde optimize edilmiştir ve bu zaman dilimlerinde en yüksek performansı sağlar; ancak diğer döviz çiftleri ve z
TPSpro RFI Levels
Roman Podpora
4.82 (22)
TALİMATLAR         RUS   -        ENG       Bir gösterge ile kullanılması   önerilir       -       TPSpro   TREND PRO -   Sürüm MT4         Ticarette önemli bir unsur, bir ticaret aracını satın alma veya satma kararlarının alındığı bölgeler veya seviyelerdir. Büyük oyuncuların piyasadaki varlıklarını gizleme girişimlerine rağmen, kaçınılmaz olarak izler bırakırlar. Bizim görevimiz bu izleri nasıl tanımlayacağımızı ve doğru şekilde nasıl yorumlayacağımızı öğrenmekti. Ana işlevler:: Satıcılar ve
Dynamic Forex28 Navigator
Bernhard Schweigert
5 (2)
Dynamic Forex28 Navigator - Yeni Nesil Forex Ticaret Aracı. ŞU ANDA %49 İNDİRİM. Dynamic Forex28 Navigator, uzun zamandır popüler olan göstergelerimizin evrimidir ve üçünün gücünü tek bir göstergede birleştirir: Gelişmiş Döviz Gücü28 Göstergesi (695 inceleme) + Gelişmiş Döviz İMPULS ve UYARI (520 inceleme) + CS28 Kombo Sinyalleri (Bonus). Gösterge hakkında ayrıntılar https://www.mql5.com/en/blogs/post/758844 Yeni Nesil Güç Göstergesi Ne Sunuyor?  Orijinallerde sevdiğiniz her şey, şimdi ye
Bu gösterge paneli, seçilen semboller için mevcut en son harmonik kalıpları gösterir, böylece zamandan tasarruf edersiniz ve daha verimli olursunuz / MT5 sürümü . Ücretsiz Gösterge: Basic Harmonic Pattern Gösterge sütunları Symbol : seçilen semboller görünecektir Trend: yükseliş veya düşüş Pattern : desen türü (gartley, kelebek, yarasa, yengeç, köpekbalığı, cypher veya ABCD) Entry : giriş fiyatı SL: zararı durdur fiyatı TP1: 1. kar alma fiyatı TP2: 2. kar alma fiyatı TP3: 3. kar alma fiya
Scalper Vault
Oleg Rodin
5 (27)
Scalper Vault , başarılı bir scalping için ihtiyacınız olan her şeyi size sağlayan profesyonel bir scalping sistemidir. Bu gösterge, forex ve ikili opsiyon tüccarları tarafından kullanılabilecek eksiksiz bir ticaret sistemidir. Önerilen zaman çerçevesi M5'tir. Sistem size trend yönünde doğru ok sinyalleri sağlar. Ayrıca size üst ve alt sinyaller ve Gann piyasa seviyeleri sağlar. Göstergeler, PUSH bildirimleri dahil her türlü uyarıyı sağlar. Göstergeyi satın aldıktan sonra lütfen benimle iletişim
Gold Channel is a volatility-based indicator, developed with a specific timing algorithm for the XAUUSD pair, which consists of finding possible corrections in the market. This indicator shows two outer lines, an inner line (retracement line) and an arrow sign, where the theory of the channel is to help identify overbought and oversold conditions in the market. The market price will generally fall between the boundaries of the channel. If prices touch or move outside the channel it is a tra
Şu anda %20 İNDİRİMLİ! Herhangi bir Acemi veya Uzman Tüccar için En İyi Çözüm! Bu gösterge paneli yazılımı 28 döviz çifti üzerinde çalışıyor. Ana göstergelerimizden 2'sine (Gelişmiş Para Birimi Gücü 28 ve Gelişmiş Para Birimi Dürtüsü) dayanmaktadır. Tüm Forex piyasasına harika bir genel bakış sağlar. Gelişmiş Para Birimi Gücü değerlerini, para birimi hareket hızını ve tüm (9) zaman dilimlerinde 28 Forex çifti için sinyalleri gösterir. Trendleri ve / veya scalping fırsatlarını belirlemek içi
Currency Strength Wizard , başarılı ticaret için size hepsi bir arada çözüm sağlayan çok güçlü bir göstergedir. Gösterge, birden çok zaman dilimindeki tüm para birimlerinin verilerini kullanarak şu veya bu forex çiftinin gücünü hesaplar. Bu veriler, şu veya bu para biriminin gücünü görmek için kullanabileceğiniz, kullanımı kolay para birimi endeksi ve para birimi güç hatları biçiminde temsil edilir. İhtiyacınız olan tek şey, işlem yapmak istediğiniz tabloya göstergeyi eklemektir ve gösterge size
ŞU ANDA %26 INDIRIMLI Yeni Başlayanlar veya Uzman Tüccarlar için En İyi Çözüm! Bu Gösterge benzersiz, yüksek kaliteli ve uygun fiyatlı bir ticaret aracıdır çünkü bir dizi tescilli özellik ve yeni bir formül ekledik. Sadece BİR grafik ile 28 Forex çifti için Döviz Gücünü okuyabilirsiniz! Yeni bir trendin veya scalping fırsatının tam tetik noktasını belirleyebildiğiniz için ticaretinizin nasıl gelişeceğini hayal edin? Kullanım kılavuzu: buraya tıklayın Bu ilk olan, orijinal! Değersiz bir
MetaTrader 4 için Ultimate Gold Advisor Ultimate Gold Advisor, MetaTrader 4 üzerindeki ticaret deneyimini optimize etmek için tasarlanmış ileri teknolojik bir araçtır. Deneyimli yatırımcıların ihtiyaçlarını karşılamak amacıyla geliştirilen bu gösterge, doğruluk, sofistike analiz ve çok yönlü işlevselliği bir araya getirerek bilgiye dayalı ticaret kararlarını destekler. Altın ticareti için ideal olmakla birlikte, geniş bir varlık yelpazesinde de uygulanabilir olan Ultimate Gold Advisor, piyasa st
Gann Swing Structure
Kirill Borovskii
5 (1)
This indicator is based on the mathematics of the great trader W.D. Ganna. With its help, you can easily find strong levels by analyzing swings to find the optimal entry point. The indicator works on all instruments and all timeframes. The indicator is fully manual and has control buttons. All you need to do is press the NEW button, a segment will appear, which you can place on any movement, swing or even 1 candle that you want to analyze. By placing the segment, press the OK button. A grid (th
Sizlere ON Trade Waves Patterns Harmonic Elliot Wolfe'u tanıtmaktan mutluluk duyarız. Bu, manuel ve otomatik yöntemleri kullanarak piyasada çeşitli desenleri tespit etmek için tasarlanmış gelişmiş bir göstergedir. İşte nasıl çalıştığı: Harmonik Desenler: Bu gösterge, grafiğinizde görünen harmonik desenleri tanımlayabilir. Bu desenler, Scott Carney'in "Harmonic Trading vol 1 & 2" adlı kitabında açıklandığı gibi harmonik ticaret teorisini uygulayan tüccarlar için önemlidir. Onları manuel olarak ç
IX Power MT4
Daniel Stein
4.67 (6)
IX Power nihayet FX Power'ın rakipsiz hassasiyetini Forex dışı sembollere getiriyor. En sevdiğiniz endeksler, hisse senetleri, emtialar, ETF'ler ve hatta kripto para birimlerindeki kısa, orta ve uzun vadeli eğilimlerin yoğunluğunu doğru bir şekilde belirler. Terminalinizin sunduğu her şeyi analiz edebilirsiniz. Deneyin ve işlem yaparken zamanlamanızın nasıl önemli ölçüde iyileştiğini deneyimleyin. IX Power Temel Özellikler 100 hassas, yeniden boyanmayan hesaplama sonuçları - terminalini
Advanced Supply Demand
Bernhard Schweigert
4.91 (295)
CURRENTLY 26% OFF !! Best Solution for any Newbie or Expert Trader! This indicator is a unique, high quality and affordable trading tool because we have incorporated a number of proprietary features and a new formula. With this update, you will be able to show double timeframe zones. You will not only be able to show a higher TF but to show both, the chart TF, PLUS the higher TF: SHOWING NESTED ZONES. All Supply Demand traders will love it. :) Important Information Revealed Maximize the potenti
Supply and Demand Dashboard PRO
Bernhard Schweigert
4.8 (20)
Şu anda %20 İNDİRİMLİ! Bu gösterge paneli, birden fazla sembol ve 9 zaman dilimine kadar çalışan çok güçlü bir yazılım parçasıdır. Ana göstergemize dayanmaktadır (En iyi yorumlar: Advanced Supply Demand ).     Gösterge paneli harika bir genel bakış sağlar. Gösterir:    Bölge mukavemet derecesi dahil filtrelenmiş Arz ve Talep değerleri, Bölgelere/ve bölgeler içindeki pip mesafeleri, İç içe geçmiş bölgeleri vurgular, Tüm (9) zaman dilimlerinde seçilen semboller için 4 çeşit uyarı verir. Kişis
ŞU ANDA %31 INDIRIMLI !!! Yeni Başlayanlar veya Uzman Tüccarlar için En İyi Çözüm! Bu gösterge benzersiz, yüksek kaliteli ve uygun fiyatlı bir ticaret aracıdır çünkü bir dizi tescilli özellik ve gizli bir formül ekledik. Yalnızca BİR grafikle 28 döviz çiftinin tümü için Uyarılar verir. Yeni bir trendin veya scalping fırsatının tam tetik noktasını belirleyebildiğiniz için ticaretinizin nasıl gelişeceğini hayal edin! Yeni temel algoritmalar üzerine inşa edilen bu sistem, potansiyel işlemler
Enigmera
Ivan Stefanov
5 (3)
ENIGMERA: Pazarın çekirdeği https://www.enigmera.com Giriş Bu gösterge ve ticaret sistemi, finansal piyasalar için dikkate değer bir yaklaşımdır. ENIGMERA, destek ve direnç seviyelerini doğru bir şekilde hesaplamak için fraktal döngüleri kullanır. Gerçek birikim aşamasını gösterir ve yön ve hedefler verir.  İster bir trendde ister bir düzeltmede olalım çalışan bir sistem.  Nasıl çalışır? ENIGMERA üç çizgiden oluşur: destek/direnç çizgisi, hedef çizgisi ve sapma çizgisi. Sistem, geçmiş veril
ÜRÜNÜ SATIN ALMADAN ÖNCE LÜTFEN AŞAĞIDAKİ BİLGİLERİ OKUYUNUZ! Apollo Pips PLUS SP benzersiz bir üründür! YENİ "APOLLO PIPS" GÖSTERGEMİ ARTI TÜM İŞLEM GÖSTERGELERİME ERİŞİM İLE "SÜPER PAKET" BONUSUNU ALMAK İSTEYENLER İÇİN! Apollo Pips PLUS SP ürününü satın alarak aslında Apollo Pips göstergemin tamamen yeni bir versiyonunu satın almış oluyorsunuz. Göstergenin bu sürümü, geliştirilmiş bir algoritmaya ve kullanımı kolay bir parametreye sahiptir; bu, size göstergeyi herhangi bir piyasada ve herhangi
Satın aldıktan sonra yorum bırakın, bonus olarak 4 yüksek kaliteli gösterge alın. Chart Patterns All-in-One göstergesi, traderların teknik analizde yaygın olarak kullanılan çeşitli grafik desenlerini görselleştirmelerine yardımcı olur. Bu gösterge, potansiyel piyasa hareketlerini belirlemeye yardımcı olur ancak kârlılığı garanti etmez. Satın almadan önce göstergeyi demo modunda test etmeniz önerilir. Mevcut Teklif : "Chart Patterns All in One" göstergesinde %50 indirim. Dahil Edilen Desenler : 1
Yazarın diğer ürünleri
-25% discount ($199 -> $149) Advanced trading tool: One click smart orders that execute under your conditions Developed by trader for trading community:  position size calculator (lot size), open position after price action, strategy builder, set and forget trading, mobile notifications... Risk Management -  Risk percentage position size calculator, gain percentage, target risk reward ratio, spread and commissions are included in calculations 7 Advanced order types  - Set and forget trading w
Summer 40% discount ($149 -> $88) Everything for chart Technical Analysis indicator mt4 in one tool Draw your supply demand zone with rectangle and support resistance with trendline and get alerts to mobile phone or email alert -  Risk reward indicator Video tutorials, manuals, DEMO download   here .  Find contacts on my   profile . 1.   Extended rectangles and trendlines Object will be extended to the right edge of the chart when price will draw new candles on chart. This is rectangle extend
-25% discount ($149 -> $111) Everything for chart Technical Analysis indicator mt5 in one tool Draw your supply demand zone with rectangle and support resistance with trendline and get alerts to mobile phone or email alert -  Risk reward indicator mt5 Video tutorials, manuals, DEMO download   here .   Find contacts on my   profile . 1.   Extended rectangles and trendlines Object will be extended to the right edge of the chart when price will draw new candles on chart. This is rectangle extend
2024 50% discount ($199 -> $99) Advanced trading tool: One click smart orders that execute under your conditions Developed by trader for trading community:  position size calculator (lot size), open position after price action, strategy builder, set and forget trading, mobile notifications... Risk Management -  Risk percentage position size calculator, gain percentage, target risk reward ratio, spread and commissions are included in calculations 7 Advanced order types   - Set and forget tradi
Place price Alerts   on  extended  Rectangles   and   Trendlines -  Risk reward indicator mt5 Extend Rectangles & Trendlines to the right edge Mark your supply demand zones with extended rectangle and draw support resistance lines with extended trendline. Find detailed manuals   here .  Find contacts on my   profile . MT4 Rectangle extender indicator will simplify and make it easier for you to analyze markets and stay notified about important events. When you extend rectangle or trendline the a
Display rectangles and trendlines list  from Trading box  Technical analysis tool. Objects are ordered in the list by   pip distance   that is difference between object price and Bid price. With this tool you will know which chart to look for next trading opportunity. No more switching between charts and searching for trades where price is close to rectangle zone or trendline support resistance level. Sorted Rectangles and Trendlines by pip distance -  If you are trading on multiple charts, the
FREE
Rectangle position changer   tool is used for precise/accurate rectangle positioning by time or price only.   You can move each side of rectangle separately with lines created around selected rectangle. This tool will replace classical grid because it is like dynamical chart grid for rectangle grid. This tool allows you to adjust your rectangles, from all 4 sides, with ease and makes your technical analysis that much faster. This tool is handy when corner points for changing rectangle position a
FREE
Display Order box list from  Trading box  Order Management tool. Find contacts and manual links on my   profile . This dashboard gives you an edge in forex trading because in few seconds you can decide which pair and timeframe is worth to watch more closely. This is how you will not be distracted by all other forex pairs that you trade, and you will not miss great opportunities to trade the best price. Trading Dashboard  (order box overview panel and Trading box Order management extension) Tr
FREE
Display rectangles and trendlines list from  Trading box  Technical analysis tool. Objects are ordered in the list by pip distance that is difference between object price and Bid price. With this tool you will know which chart to look for next trading opportunity. No more switching between charts and searching for trades where price is close to rectangle zone or trendline support resistance level. Sorted Rectangles and Trendlines by pip distance -  If you are trading on multiple charts, then th
FREE
Rectangle position changer  tool ( rectangle indicator) is used for precise/accurate rectangle positioning by time or price only. You can move each side of rectangle separately with lines created around selected rectangle. This tool will replace classical grid because it is like dynamical chart grid for rectangle grid. This tool allows you to adjust your rectangles, from all 4 sides, with ease and makes your technical analysis that much faster. This tool is handy when corner points for changi
FREE
This tool will remove buttons and text labels from the chart, after you remove Trading box Order management or Trading box Technical analysis . You just need to drag this tool to your chart and after cleanup of objects is finished, the tool will remove itself from the chart. Please check images below that present Before and After using the Removal tool. There is also a short YouTube video at the bottom to show how easy it is to clean your chart after using Trading box tools. - input var
FREE
Display Order box list from  Trading box  Order Management tool. Find contacts and  manual   links on my   profile . This dashboard gives you an edge in forex trading because in few seconds you can decide which pair and timeframe is worth to watch more closely. This is how you will not be distracted by all other forex pairs that you trade, and you will not miss great opportunities to trade the best price. Trading Dashboard  (order box overview panel and Trading box Order management extension)
FREE
This tool will remove buttons and text labels from the chart, after you remove Trading box Order management or Trading box Technical analysis. You just need to drag this tool to your chart and after cleanup of objects is finished, the tool will remove itself from the chart. Please check images below that present Before and After using the Removal tool. There is also a short YouTube video at the bottom to show how easy it is to clean your chart after using Trading box tools. - input variable "
FREE
Filtrele:
prequest01
624
prequest01 2022.12.27 14:28 
 

Excellent tool, very versatile and powerful for your TA. The author is very responsive and takes personal feedback to quickly implement. A must have indicator in your trading arsenal.

Gaved
229
Gaved 2022.02.01 20:45 
 

Great work. Recommended.

Lungisa Gina
38
Lungisa Gina 2021.12.22 11:43 
 

I trade Support & Resistance Zones and this tool is a game-changer for me.

Frank Langrehr
316
Frank Langrehr 2021.06.20 18:12 
 

must have for every trader to draw your zones and lines, now with the bring chart to front Alert, very helpful, support at the best, I had issue and igor help me a lot, best purchase I ever made here on the market

Fadi88888
232
Fadi88888 2021.05.02 12:34 
 

Very useful tool... I can highly recommend to buy and use it . Also the developer very helpful

ShockMarkets
25
ShockMarkets 2021.04.25 06:40 
 

Combining the 'FLAT' trendline function with the alert line is what superior functionality is all about. I've been wanting that one simple thing, on MT4, for many years. Along with the alert boxes this is shaping up to be a very handy tool. Nice work Igor.

AkiraHank
30
AkiraHank 2021.04.13 05:43 
 

I bought . When I draw a rectangle and set an alert, Engulf..., the description appears on the rectangle. How to not show description, thanks

exzell
169
exzell 2021.04.03 12:59 
 

This tool is super amazing, been super impressed with it from day one and is firmly part of my analysis toolkit, I asked the developer to add thickness to the trendline and less than a week it was done, what a guy, awesome service - what more can I say, its just brilliant

bertotorde
141
bertotorde 2021.02.03 17:30 
 

Perfect. Great tool.

JimMac64
46
JimMac64 2020.09.06 20:00 
 

I purchased the Rectangle Extender and Igor (Developer) could not have been more helpful - What a guy! The indicator works perfectly and I am very impressed with both. I recommend this indicator. Thanks - Jim

[Silindi] 2020.06.13 09:11 
 

Kullanıcı incelemeye herhangi bir yorum bırakmadı

BEN
97
BEN 2020.06.10 22:46 
 

Kullanıcı incelemeye herhangi bir yorum bırakmadı

raiinzen
727
raiinzen 2020.06.07 15:07 
 

Kullanıcı incelemeye herhangi bir yorum bırakmadı

[Silindi] 2020.05.30 10:46 
 

Kullanıcı incelemeye herhangi bir yorum bırakmadı

teodosy87
293
teodosy87 2020.05.26 20:40 
 

Kullanıcı incelemeye herhangi bir yorum bırakmadı

87trader
25
87trader 2020.05.26 19:23 
 

Kullanıcı incelemeye herhangi bir yorum bırakmadı

SOMENDRA
14
SOMENDRA 2020.05.24 17:32 
 

Kullanıcı incelemeye herhangi bir yorum bırakmadı

[Silindi] 2020.05.21 18:06 
 

Kullanıcı incelemeye herhangi bir yorum bırakmadı

Mamboki
118
Mamboki 2020.05.21 12:04 
 

Kullanıcı incelemeye herhangi bir yorum bırakmadı

İncelemeye yanıt
Sürüm 8.3 2024.09.30
- recompile with new Metatrader client
Sürüm 8.2 2024.08.24
- bug fix
Sürüm 8.1 2024.04.01
>> button position fixed for Horizontal line buttons display
Sürüm 8.0 2024.03.22
- object name change bug fix
Sürüm 7.9 2024.03.16
- reported bug fix
Sürüm 7.8 2024.03.12
- bug fix: text objects deleted on object property change
Sürüm 7.7 2024.02.17
- update
Sürüm 7.6 2024.01.13
- NEW input variables:
Resistance trendline color - Above Bid
Support trendline color - Below Bid

TBOM promotional video from trader Kevin Cortese: https://www.youtube.com/watch?v=gUR_juP7n5k
Sürüm 7.5 2023.08.10
- performance upgrade
Watch our latest video about Fair Value Gap indicator: https://www.youtube.com/watch?v=pBRXTKNIMAk
Sürüm 7.4 2023.02.08
- NEW input "Button text color"
Sürüm 7.3 2022.12.26
- new input variable "Engulf alert un-fill rectangle"
Sürüm 7.2 2022.11.20
- rectangle and trendline alert buttons visible within chart when scrolling left
Sürüm 7.1 2022.11.07
- bug fixed after renaming object
Sürüm 7.0 2022.11.06
- performance upgrade that will lower CPU usage on MetaTrader terminal
Sürüm 6.9 2022.09.17
- new input variable "Extended object text position" with options (Right, Left)
Sürüm 6.8 2022.08.12
- new version
Sürüm 6.7 2022.08.01
- recompile with new Metatrader version
Sürüm 6.5 2022.05.09
- performance upgrade
Sürüm 6.4 2022.05.04
- bug fix and recompile code for MT4 update

Please check our YouTube channel to learn trading tips and tricks: https://www.youtube.com/Tradingbox
Sürüm 6.3 2022.04.09
- recompile for new MT4 build
Sürüm 6.2 2021.12.23
- compliance upgrade for the NEW tool "Rectangle position changer"

Download: https://www.mql5.com/en/market/product/75865

VIDEO: https://www.youtube.com/watch?v=IYW1dgOWwRg
Sürüm 6.1 2021.11.27
- CPU usage reduced that will allow more charts with TBTA in MetaTrader terminal
Sürüm 6.0 2021.11.16
- bug fix for non extended rectangle Risk Reward tool
- CPU performance improvement when using TBRE on multiple charts
Sürüm 5.9 2021.11.01
- risk reward tool for non-extended rectangles
- adding more texts positions (object names) to rectangle and trendline. With button "X" you remove current text
Sürüm 5.6 2021.08.28
- speed and performance upgrade
Sürüm 5.5 2021.08.01
- improved performance between Trading box tools (Order management, Technical analysis, Rectangle extender, Order box Dashboard)
Sürüm 5.4 2021.08.01
- extended rectangle and trendline buttons display correction for high resolution displays
Sürüm 5.3 2021.07.31
- bug fix for chart clean up after indicator is removed
Sürüm 5.2 2021.07.25
- optimized refresh rate for pip distance display in brackets (price difference between Bid and object price)
Sürüm 5.1 2021.07.22
- removed input variable "Set larger button text"
- NEW input variable "Button font size"
- NEW input variable "Button size scale"
Sürüm 5.0 2021.07.20
- NEW input variable "Show pip distance in brackets"

NEW input variable "Use timeframe colors for extended rectangle"
- Rectangle color for M1, M5, M15
- Rectangle color for M30, H1, H4
- Rectangle color for D1, W1, MN

NEW input variable "Use timeframe colors for extended trendline"
- Trendline color for M1, M5, M15
- Trendline color for M30, H1, H4
- Trendline color for D1, W1, MN

- button click lagging solved
Sürüm 4.9 2021.07.17
- bug fix when Trading box Order management and Rectangle extender are used on the same chart
Sürüm 4.8 2021.07.06
- NEW input variable "Set larger button text" that will create a little bigger buttons and font size +2
Sürüm 4.7 2021.06.20
- NEW input variable "Bring Alerted chart to the top"

- NEW input variable "Extend new created rectangle"
- NEW input variable "Extend new created trendline"
Sürüm 4.6 2021.05.25
- bug fix for button display
Sürüm 4.5 2021.05.01
- NEW "Text" button that gives options to display rectangle or trendline text in all possible spots around or inside object. This works for non-extended rectangles and trendlines where we would like to have object name displayed in suitable place around or inside object. This is custom show object name function.

- Safety check warning for too many objects on chart (performance issues) + warning for incompatible indicators
Sürüm 4.4 2021.04.03
Added new input variables:
- Extended trendline width
- Flat trendline width
Sürüm 4.3 2021.03.27
- better sync with Trading box Order management v3.0 objects
Sürüm 4.2 2021.03.01
New input variables added and used when you extend rectangle or trendline:
- Alert enabled by default
- Engulf enabled by default
- Close enabled by default
- No text enabled by default
Sürüm 4.1 2021.02.17
- Alert and Engulf button color refresh after alert is triggered
Sürüm 4.0 2021.02.15
- bug fix and also code sync for MT5 version
Sürüm 3.9 2021.02.04
- bug fix for full zoom chart label positions
Sürüm 3.8 2021.02.01
- input variables description added

- new input variables:
- Selected object buttons position
- Rectangle pip size position
Sürüm 3.7 2021.01.16
- switching between timeframes bug solved
Sürüm 3.6 2021.01.01
Important MAJOR performance upgrade and bug fix:
- CPU load problems solved (better chart and object refresh logic)
- Ignoring Trading box Order management objects
- All user bug reports solved
- Works better with other indicators
- Added e-mail alert option
- Added 3 new variables to manage alerts and notifications (send_mobile_push_notification, send_email_alert, show_popup_alert)
- Optimized chart refresh rate that will reduce CPU load from 30% up to 400%

Please also check our product Technical analysis which is advanced version of Rectangle extender.

*** I wish you all best in 2021 and happy trading ***
Sürüm 3.5 2020.11.06
- minor bug fix when use >> button on rectangle
Sürüm 3.4 2020.11.02
- another bug solved when clicking << button
Sürüm 3.3 2020.11.02
- bug fix for << button and when rename trendline
Sürüm 3.2 2020.10.30
- added new input variable extend_if_auto_scroll_off that will give you option to have fixed extended object size if you have auto scroll option diabled
Sürüm 3.1 2020.10.29
- minor bug fixed when Auto scroll is OFF. Objects are extended to the right side of the chart
Sürüm 3.0 2020.10.04
- minor bug fix for alert arrows timeframe visibility
Sürüm 2.9 2020.09.30
MAJOR upgrade
- new Flat button for trendline (create horizontal flat trendline)
- new Close button for rectangle, trendline and ray (alert when current candle closes beyond object price)
- when you click on extended rectangle it shows you text Demand or Supply type of rectangle
- if you extend rectangle around price then you have option to decide if this rectangle is supply or demand
Sürüm 2.8 2020.09.07
- minor preformance upgrades
Sürüm 2.7 2020.08.08
- Button fix for Demand rectangle extender
Sürüm 2.6 2020.08.04
- Rectangle and trendline function buttons are now aligned on right side of charts, so they not overlay with other trendlines and rectangles
- button positions corrections
Sürüm 2.5 2020.07.28
-minor bug for Risk Reward calculation
Sürüm 2.4 2020.07.13
- bug fix for trendline extension
Sürüm 2.3 2020.07.10
- aditional bug fix for rectangle colors
Sürüm 2.2 2020.07.10
- rectangle name and action buttons are now fixed depends on supply or demand rectangle position
Sürüm 2.1 2020.07.02
- bug fix for hiding buttons after new created object
Sürüm 2.0 2020.06.21
- MAJOR UPGRADE: When you click on button Alert or Engulf, the creation time is saved. When you open MT4 the Alert and Engulf will be checked if price was hit your alert level when your MT4 was closed.
We reccomand that alerts need to be placed again in new version, becouse data protocol has been changed/upgraded.
Sürüm 1.9 2020.06.21
- MAJOR UPGRADE: When you click on button Alert or Engulf, the creation time is saved. When you open MT4 the Alert and Engulf will be checked if price was hit your alert level when your MT4 was closed.
We reccomand that alerts need to be placed again in new version, becouse data protocol has been changed/upgraded.
Sürüm 1.8 2020.06.13
- bug fix when selecting Order box from tool Trading box Order Management
Sürüm 1.7 2020.06.10
- bug fix
Sürüm 1.6 2020.06.09
- bug fixed with anoying alert when deselecting object (my bad while developing code)
Sürüm 1.5 2020.06.05
- when deselecting object, buttons disapear more quickly
Sürüm 1.4 2020.06.04
- bug fix for extending rectangle and trendline on lower timeframes with no chart history
Sürüm 1.3 2020.06.03
- added new input variable show_rectangle_pip_size
Sürüm 1.2 2020.06.02
- buttons for retina display
- bug fixes reported by users
Sürüm 1.1 2020.05.26
- program bug fixed becouse in some MT4 program hangs and stop MT4 application