FX Fishing
- Göstergeler
- Yasha Firooz
- Sürüm: 1.0
- Etkinleştirmeler: 5
Yasha Firooz Hakkında
Yasha, 2012 yılında bir varlık yönetimi şirketinin personeliydi.
Çeşitli ofis ve teknoloji görevleri kendisine devredildi ve varlık yönetimi ekibinin bir kısmını kurucunun ihtiyaçlarıyla birleştirebildi. Varlık yönetimi şirketi, ticaret sektörüne büyük yatırımlar yapmıştı.
FX Fishing MT4 (Meta Trader 4 Göstergesi) Hakkında
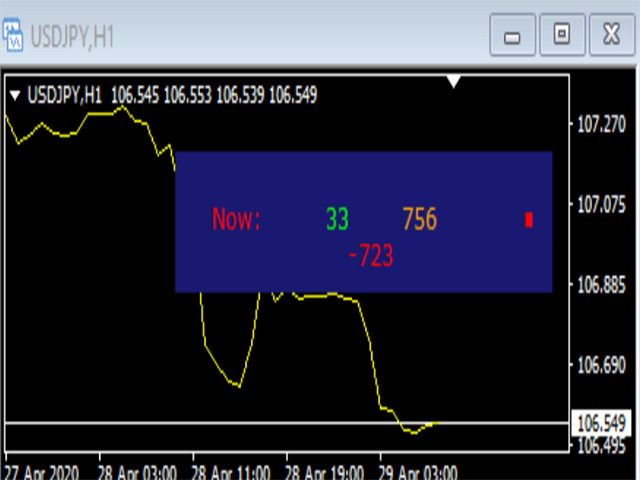
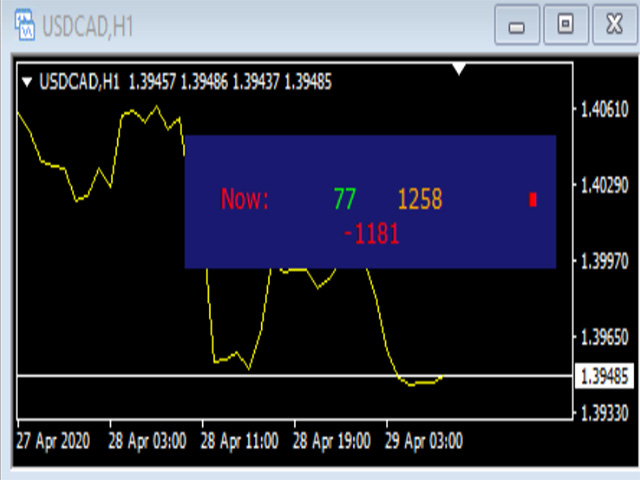
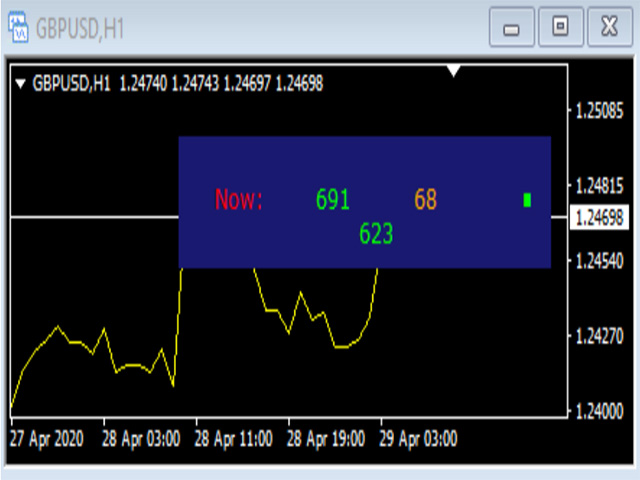
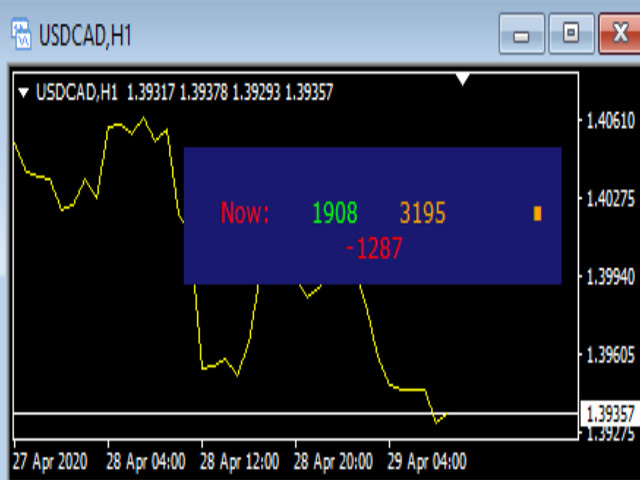
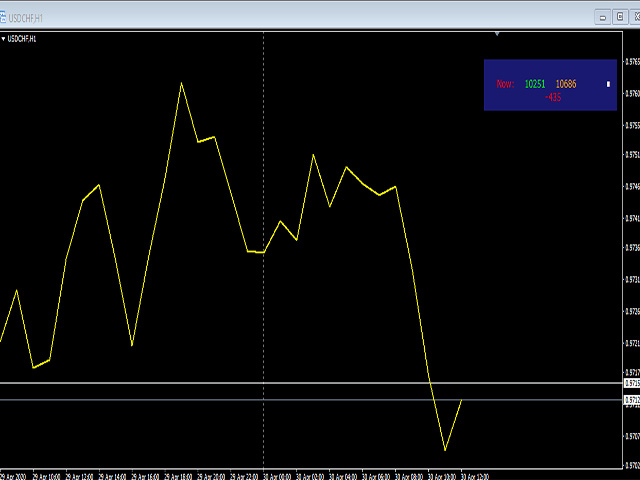
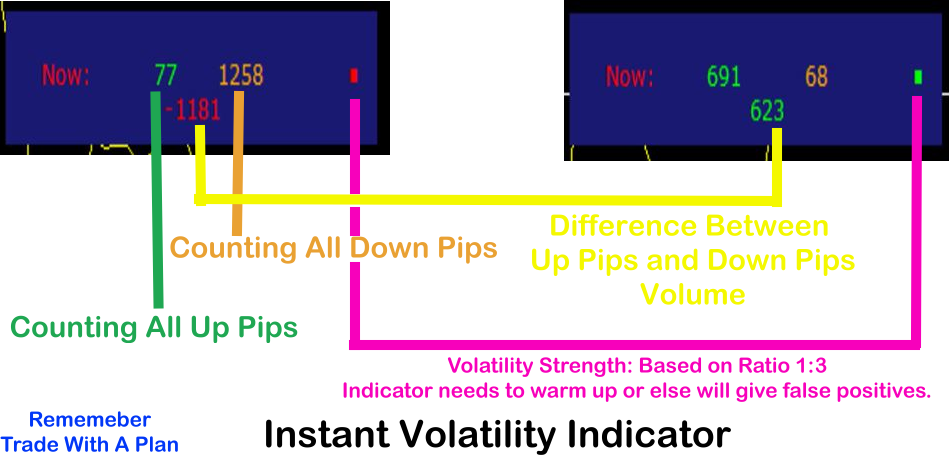
Yasha, piyasa oynaklığından rahatsızdı ve boğalar ile ayılar arasındaki piyasa dalgalarını hissetmenin mümkün olup olmadığını düşündü. Bu nedenle, tam da bunu yapacak bir gösterge stratejisi geliştirdi. Her yukarı pip için ve her dip pip için sayılır. Bu iki tik, aşağıda gösterilen gösterge görüntüsünde gösterildiği gibi görüntülenir:
- Yeşil Sayı (Yukarı Tik/Pip)
- Turuncu Sayı (Aşağı Tik/Pip)
Ortada gösterilen sayı, Yukarı ve Aşağı oynaklık arasındaki farktır.
Güçlü bir Boğa veya Ayı hacmini gösterir.
Balıkçılık Göstergesi, sağdaki renkli noktada gösterilen 1:2 ORAN üzerinde çalışır.
Yeşil = Boğa
Kırmızı = Ayı
Turuncu = Yan Yollar
Oran sağda, görüntülenen renkli nokta olarak gösterilir.
Bu göstergenin ticaretinizde size yardımcı olabileceği birkaç yol vardır.
Demoyu deneyebilir ve tarzınıza en uygun olanı bulabilirsiniz.
*Lütfen unutmayın: Bu son derece sezgisel bir göstergedir.
Fiyatı 45 dolardan 30 dolara düşürdüm
FX Balıkçılık MT5'i nasıl kullandım
(Trend)
1. Balıkçılık göstergesini grafiklerinize yerleştirin ve en az 10 veya 30 dakika bekleyin.
Nokta, yönün 1:2 oranını gösterecektir. Ardından ticaret yapmayı seçebilirsiniz.
Bitirdikten sonra: Göstergeyi grafiğinizden çıkarın ve yeniden uygulayın ve yukarıdaki talimatları tekrarlayın.
(Scalping)
2. Bu benim kişisel favorim. Göstergeyi grafiğinize yerleştirin. Sonra bu grafiği şablonlara kaydedin, örneğin, buna hızlı balık adını verebilirim.
Bir süre tick farkı hesaplayıcısını izlerdim. Sonra hareket farkı çok belirgin olurdu. Sonra o yönde işlem yapardım. Sonra parayla kapatırdım. Sonra hızlı balık şablonunu tekrar eklerdim. Ve tekrar ederdim.
Lütfen Altın Tüccarın Kurallarını Hatırlayın
Yalnızca rastgele işlem yapmak kumar oynamaktır.
- İyi para yönetimine sahip olun.
- Sıkı onaylara sahip olun.
- Ne zaman gireceğinizi bilin.
- Ne zaman çıkacağınızı bilin.
- Zarar durdurma emirlerini kullanmaktan korkmayın.
- Trail Stop'lar uygulamak için iyi olabilir.
- Her zaman öğreniyorsunuz, kendinize karşı aşırı eleştirel olmayın, bebekler bile yürümeyi öğrenmek zorunda kaldı.
- Yürüme psikolojisini edinmek şarttır.
- Ekonomik Takvimler ve Piyasa Geçişleri oynaklığı etkileyecektir.
Yasha Ticaret kuralları olumlamaları
1: Korkuyla ticaret yapmayacağım
2: Açgözlülükle ticaret yapmayacağım
3: İntikam Ticareti yapmayacağım
4: Kaçırma Korkusundan etkilenmeyeceğim (Bir ticarete girmemek veya bir ticaretten erken çıkmak)
5: Ticaret kurallarımı dindar bir şekilde takip ediyorum.
FX Balıkçılığını Denediğiniz İçin Teşekkür Ederiz, 5 yıldızlı bir yorum bırakın.