• Genel bakış
  • İncelemeler
  • Yorumlar (24)
  • Yenilikler

Currency Strength Meter Pro Dashboard for MT5

Currency Strength Meter is the easiest way to identify strong and weak currencies. This indicator shows the relative strength of 8 major currencies + Gold: AUD, CAD, CHF, EUR, GBP, JPY, NZD, USD, XAU. Gold symbol can be changed to other symbols like XAG, XAU etc.


By default the strength value is normalised to the range from 0 to 100 for RSI algorithm:

  • The value above 60 means strong currency;
  • The value below 40 means weak currency;


This indicator needs the history data of all 28 major currency pairs and 9 timeframe. History data will be downloaded automatically as indicator will be started.


This Currency Strength Meter supports many powerful features:

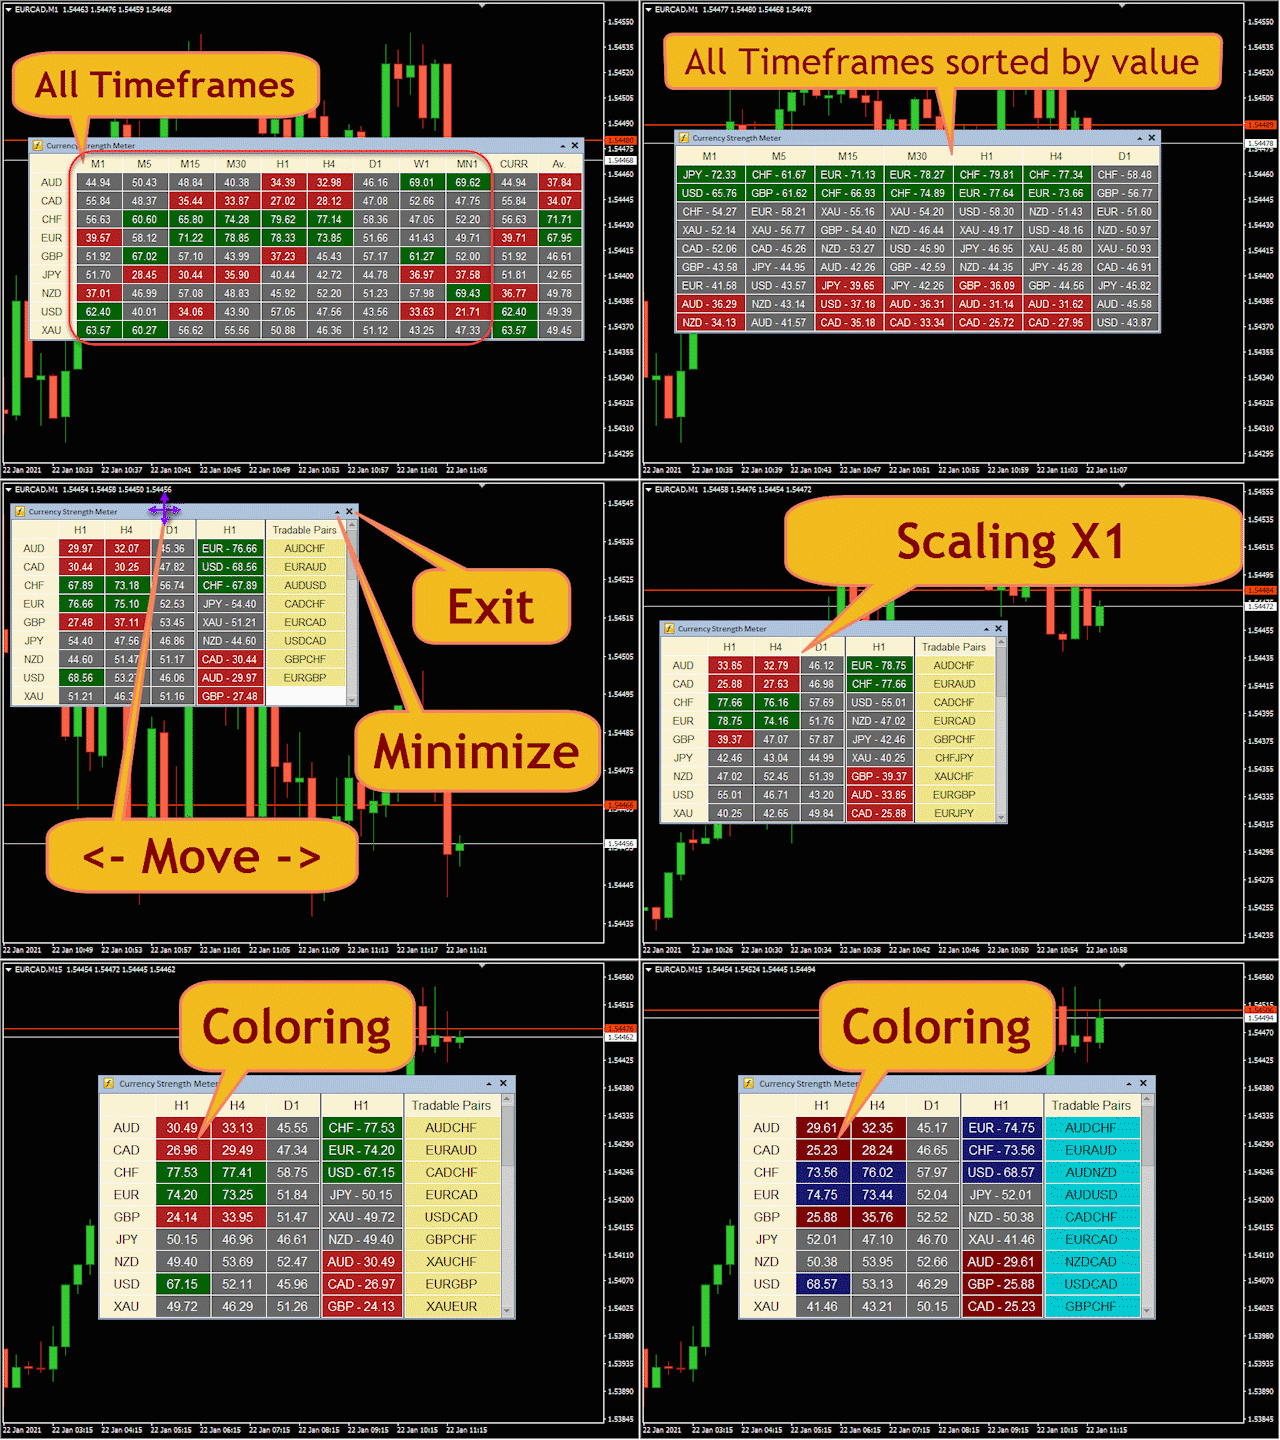
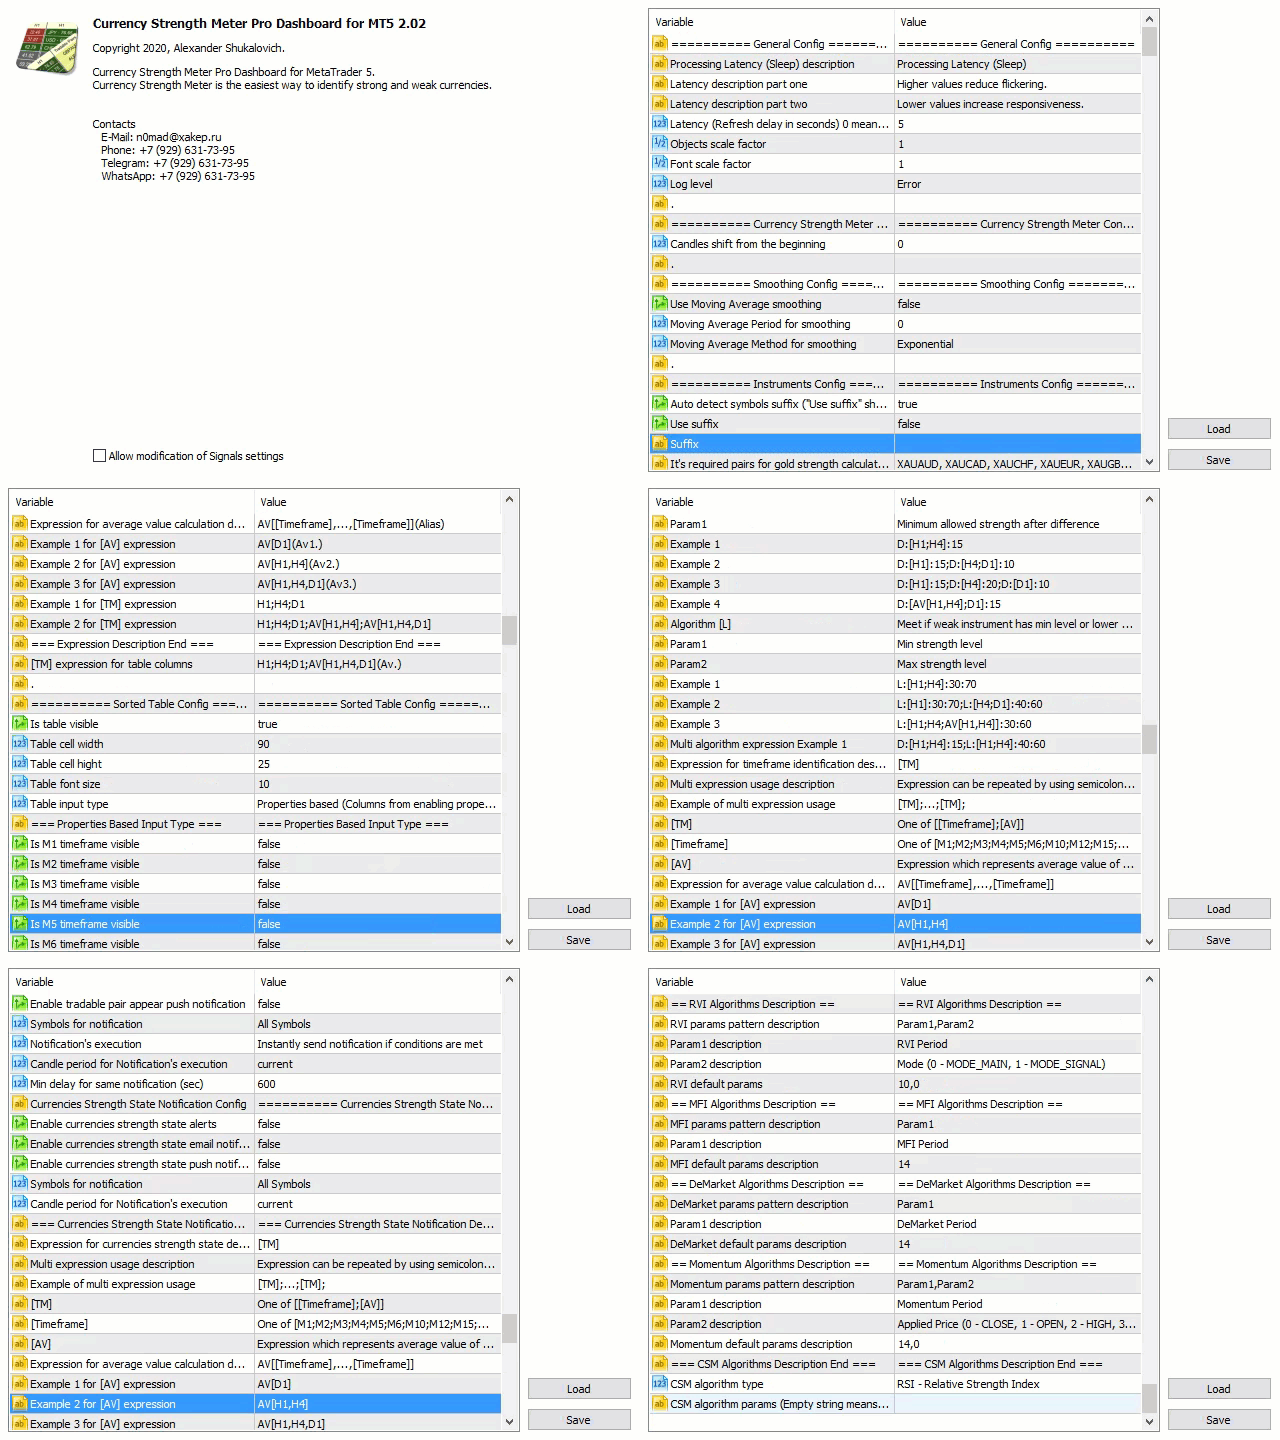
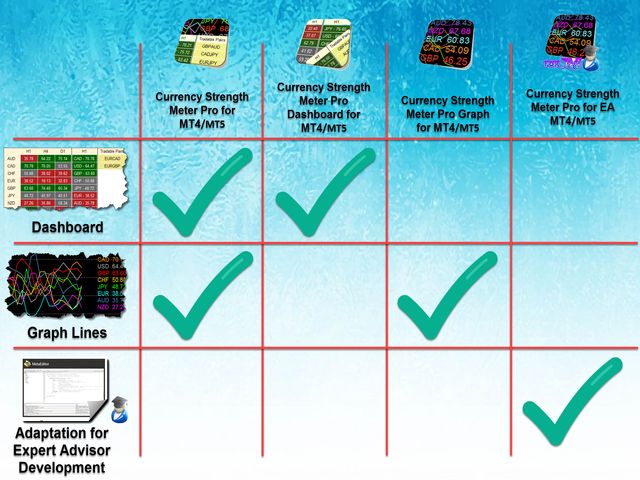
  • Currency Strength Meter Dashboard (shows strength of currencies for any timeframe with sorting by name or value at one user-friendly dashboard);
  • Allows to calculate average currency strength from specified timeframes;
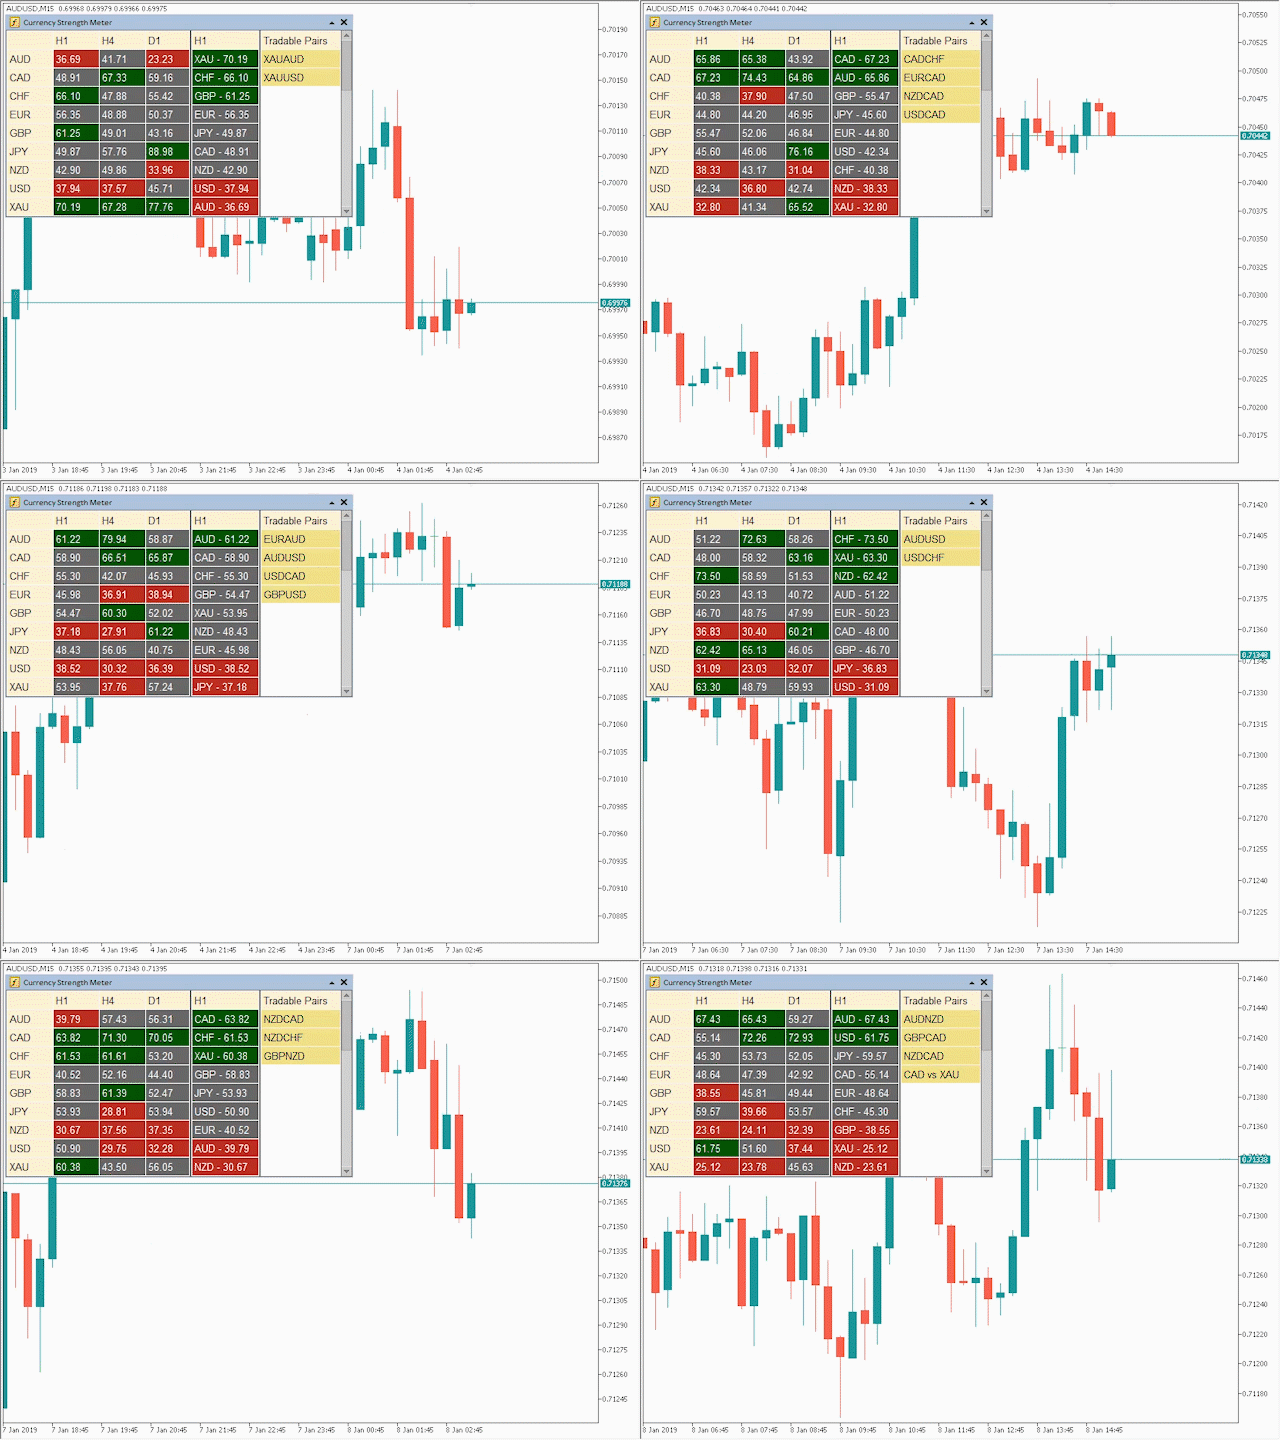
  • Searching tradable pairs by several algorithms (allows to find strong and weak currencies and show them at table as tradable pairs, you do not waste your time to do this calculation manually);
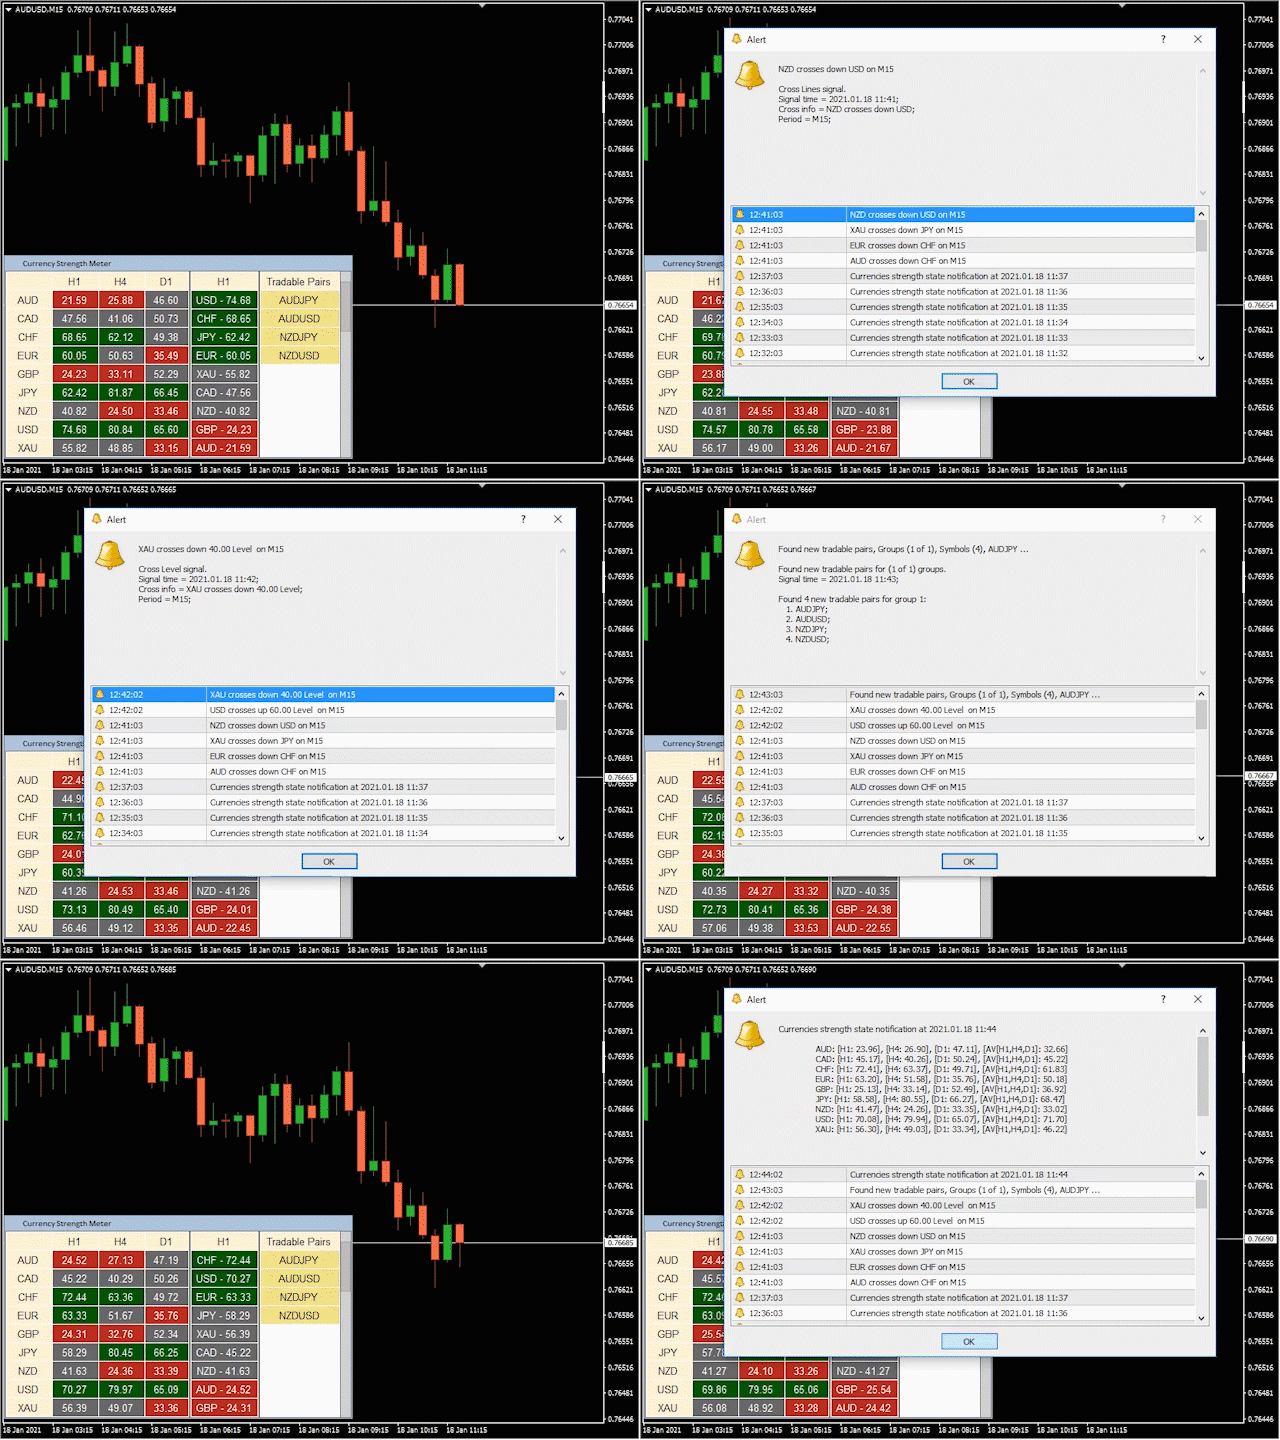
  • Powerful notification manager:
    • Notifications by crossing level (levels and timeframe is set by formula);
    • Notifications by crossing lines (timeframe is set by formula);
    • Notifications when new tradable pair is found (tradable pairs are found by formula);
    • Notifications about CSM state;
  • Many algorithms for calculation of strength of currencies (MACD, RSI, CCI, RVI, MFI, Stochastic, DeMarker, Momentum);
  • Powerful tradable pairs search engine by expression;
    • Min difference between strength of strong and weak currencies;
    • Min strength level for strong currency and weak currency;
    • Max difference between strength of strong and weak currencies;
    • Moving averages alignment;
  • Coloring of any object of Currency Strength Meter;
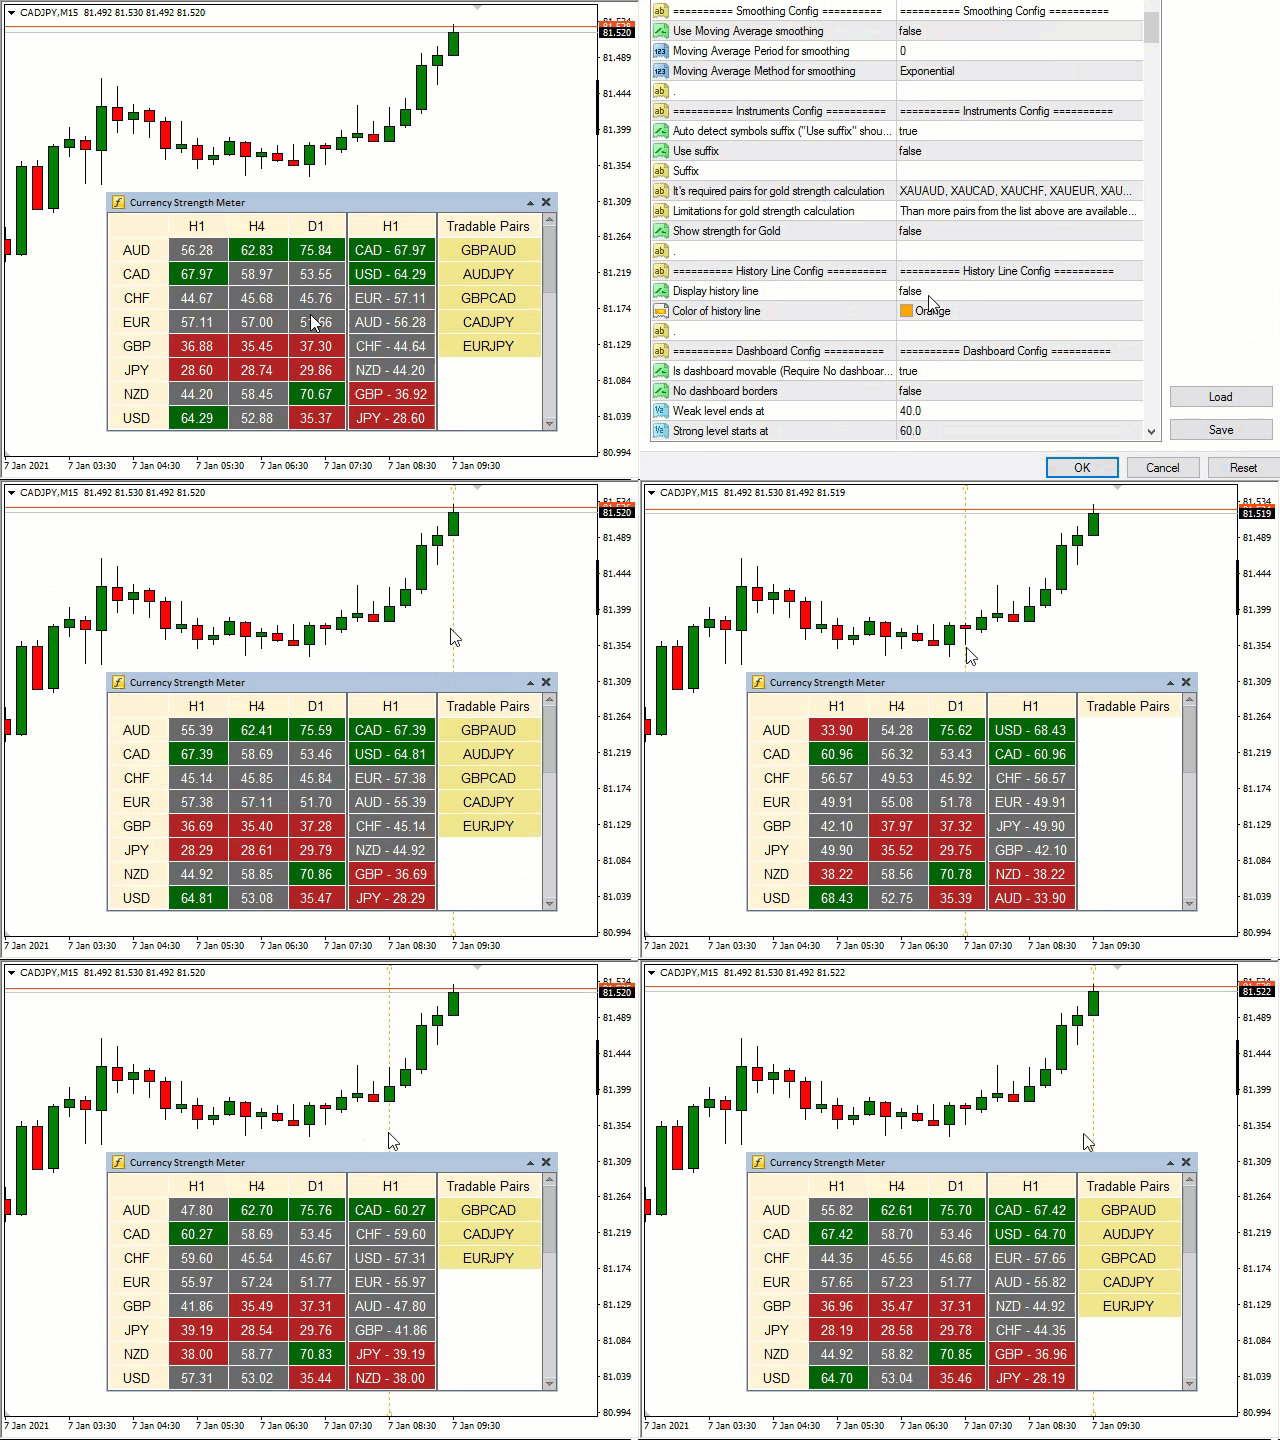
  • History line (allows to get Currency Strength Meter value for particular time in history, it helps to backtest your trading strategy with using Currency Strength Meter);
    • Calculation on candle close time;
    • Calculation on specified time with one minute precision;
  • Moving average smoothing (allowed to smooth result with specific algorithms);
  • Latency (allowed to calculate currency strength with specified interval, thus it takes less time for calculation);
  • User-friendly interface;
  • High resolution screens support (4K);


Relative links:


Communication:

  • Join  Take Profit Channel to get latest news and updates.
  • Join Take Profit Group to discuss products of author.
  • If you want new feature contact me please.


Take profit!


Önerilen ürünler
VPO Profile MT5
Kyra Nickaline Watson-gordon
5 (2)
Definition : VPO is a Volume Price Opportunity. Instead of using bars or candles with an Open, High, Low, and Close price, each "bar" in a Market Profile is represented by horizontal bars against the price It is called Market Profile terminology. In other words volume-price-opportunity (VPO) profiles are histograms of how many volumes were traded at each price within the span of the profile. By using a VPO chart, you are able to analyze the amount of trading activity, based on volume, for eac
Knowledge of the strength and weakness of each currency is vital for every forex trader. Our   Currency Strength Meter indicator   measures the strength of eight major currencies (USD, EUR, GBP, CHF, JPY, CAD, AUD, NZD) by using the Relative Strength Index indicator, also known as RSI. The Currency Strength Meter indicator shows you, simply and quickly, when a currency is oversold, overbought, or in "normal area". This way, you can identify which currency is the strongest and the weakest. Our
RSI / TDI uyarı panosu, ticaret yaptığınız her büyük çiftte RSI'leri (sizin tarafınızdan seçilebilir) bir kerede izlemenize olanak tanır. İki şekilde kullanabilirsiniz: 1. Birden fazla zaman çerçevesi seçin ve çizgi, normal ticaret koşullarının ötesine geçen birden fazla zaman çerçevesi olduğunda size gösterecektir. Birden fazla zaman diliminde aşırı alım veya aşırı satım seviyesine ulaştığı için fiyatın son zamanlarda sert bir şekilde yükseldiğinin harika bir göstergesi, bu nedenle yakın
Breakeven Price MT5
Vladimir Chiosa
5 (1)
Nowadays a lot of traders need to open more positions for the same pair, because one position is not usually the best possible position. Thus a lot of trades are accumulated, sometimes with different lot sizes, and it is not easy to calculate the breakeven price of all opened positions. For solving this issue the Breakeven Price indicator was created. Breakeven Price is an MT5 indicator which calculates real time the breakeven price of all Buy & Sell positions opened by trader or EAs. It shows r
Currency Strength Meter is the easiest way to identify strong and weak currencies. This indicator shows the relative strength of 8 major currencies + Gold: AUD, CAD, CHF, EUR, GBP, JPY, NZD, USD, XAU. Gold symbol can be changed to other symbols like XAG, XAU etc. By default the strength value is normalised to the range from 0 to 100 for RSI algorithm: The value above 60 means strong currency; The value below 40 means weak currency; This indicator needs the history data of all 28 major curren
Indicator MTF Qristalium Arrows is a semi - automatic trading system. It works on all currency pairs.  The indicator uses three rules: 1) we trade only on the trend, 2)"buy when everyone sells and sell when everyone buys", 3) the Price always goes against the crowd.  Indicator MTF Arrows Qristalium filter rules across multiple time frames using the built-in indicators. If the trend matches on the selected time intervals, the indicator will give an arrow to enter the market. Then you make
Market screener: Price, Spread and Swap, for selected Symbols (Market Watch) You can customize the list: set only the Symbols (currency pairs) that are needed. The number of Symbols is unlimited. The list can be sorted in ascending or descending order (Symbol name). The panel can be moved to any place on the chart. You can also minimize the panel. There is an option to notify about the increased spread size compared to the average value. My  #1 Utility : includes 65+ functions  |   Contact me  
This indicator allows you to enjoy the two most popular products for analyzing request volumes and market deals at a favorable price: Actual Depth of Market Chart Actual Tick Footprint Volume Chart This product combines the power of both indicators and is provided as a single file. The functionality of Actual COMBO Depth of Market AND Tick Volume Chart is fully identical to the original indicators. You will enjoy the power of these two products combined into the single super-indicator! Below is
Looking to boost your trading performance on MT5? Introducing the signal indicator that will become your reliable ally on the path to success! This unique indicator utilizes arrows and a color-changing moving average to simplify your trading decisions. When the trend shifts upwards, the indicator turns the line blue, alerting you to potential price increases. If the trend reverses downwards, the line turns red, signaling a potential price drop. Additionally, arrows precisely indicate the optimal
Was: $249  Now: $99   Market Profile defines a number of day types that can help the trader to determine market behaviour. A key feature is the Value Area, representing the range of price action where 70% of trading took place. Understanding the Value Area can give traders valuable insight into market direction and establish the higher odds trade. It is an excellent addition to any system you may be using. Inspired by Jim Dalton’s book “Mind Over Markets”, this indicator is designed to suit the
Gold Step
Ignacio Agustin Mene Franco
Step Gold. It is an Echo oscillator for trading synthetic and forex indices at a professional level, grasping long trends, whether long or short works for all seasons also for scalping, very good level in the crash and boom pairs, volatility's , jump in forex pairs, eur/usd usd/jpy, gbp/eur, aud/cad and others! when it hits the ceiling it gives a signal to a short when it hits the floor it signals a long! Enjoy it.
40% off. Original price: $50 ATR Scanner Pro is a multi symbol multi timeframe volatility scanner that monitors and analyzes Average True Range indicator value in up to 28 symbols and 9 timeframes in 3 modes : ATR value:   As a volatility dashboard it shows the ATR indicator value in all pairs and timeframes and signals when the ATR value reaches a maximum or minimum in a given duration. Short term ATR/Long term ATR ratio:  It shows ratio of 2 ATRs with different periods. It's useful in detec
VWAP Daily
Anton Polkovnikov
Weighted average price indicator or VWAP. The well-known standard VWAP with the beginning of the day is added with the function of selecting the periodization. It can be calculated both every day and on other periods. Also the indicator allows to exclude the volume from the calculation, which will allow using it on the cryptocurrencies and forex. There is an alert for a VWAP price crossing. There are 1 and 2 standard deviation. Settings: Volume: turning volume on and off in the calculation mecha
Before installing the HeatMap indicator make sure you are using a broker that gives you access to the Depth of market (DOM) !! This indicator creates a heatmap on your chart allowing you to see the buy or sell limit orders easily and in real time. You have the possibility to change the setting and the colors of the HeatMap in order to adapt to all markets and all charts. Here is an example of a setting you can use with the NASDAQ100 on the AMPGlobal broker :  https://www.youtube.com/watch?v=x0
Çekiç şamdan deseni tek bir mumdan oluşur. Çekiç şamdan desenini nasıl tanımlayacağınız aşağıda açıklanmıştır: Mumun küçük bir gövdesi var Alttaki fitil gövdeye göre büyük olmalı Üst kısmında fitil bulunmamalı veya çok küçük olmalıdır Vücudun rengi önemli değil Bu 1 mumlu yükseliş mum çubuğu formasyonu bir ters formasyondur, yani dipleri bulmak için kullanılır. Bu nedenle, aşağı yönlü bir hareket sonrasında boğaların kontrolü ele geçirmeye başladığını gösteren bu modeli görmek istiyoruz. Çekiç
Stratos Pali mt5
Michela Russo
4 (3)
Stratos Pali Indicator is a revolutionary tool designed to enhance your trading strategy by accurately identifying market trends. This sophisticated indicator uses a unique algorithm to generate a complete histogram, which records when the trend is Long or Short. When a trend reversal occurs, an arrow appears, indicating the new direction of the trend. Important Information Revealed Leave a review and contact me via mql5 message to receive My Top 5 set files for Stratos Pali at no cost ! Do
Bu göstergenin benzersizliği, hacim hesaplama algoritmasında yatmaktadır: birikim, günün başlangıcına bakılmaksızın doğrudan seçilen dönem için gerçekleşir. Son çubuklar hesaplamanın dışında tutulabilir, bu durumda mevcut veriler daha önce oluşturulan önemli seviyeler (hacimler) üzerinde daha az etkiye sahip olacaktır. Daha doğru bir hesaplama için varsayılan olarak M1 grafiğindeki veriler kullanılır. Fiyat hacimlerinin dağıtım adımı düzenlenir. Varsayılan olarak, ekranın sağ sınırı, analiz için
Volume Profile V6
Andrey Kolesnik
4.5 (2)
Market volume profile indicator.  It works on almost all instruments - currency pairs, stocks, futures, on real volumes and on ticks.  It can be set as automatic determination of the range of building a profile, for example, for a week or a month, etc.  and set the range manually by moving the borders (two vertical lines red and blue).  Shown as a bar graph.  The width of the histogram at a given level means, conventionally, the number of trades made on it.  With the "Mode level line color" para
This indicator is a scalping indicator intended solely for the Boom and Crash indices of the Deriv Limited market It supports Boom 500, Boom 1000, Crash 500 and Crash 1000 Not repaint and no bug The settings are intuitive and easy to use The product activation number is 20 The Time Frame used depends on the user If you are an aggressive scalper then just use M1 For long trades use M15 If you are conservative use M5 Please contact me for more details of its use
MultiFrame Trend Detector: Gelişmiş Forex Trend Analizi Göstergesi MultiFrame Trend Detector , MetaTrader 5 platformu için güçlü bir göstergedir ve yatırımcılara birden fazla zaman diliminde kapsamlı trend analizi sunar. Zaman dilimleri arasındaki ilişkiye dayalı olarak trend eşiklerini dinamik bir şekilde ayarlayan MultiFrame Trend Detector, tüm Forex pariteleri ve değerli metaller için güvenilir ve tutarlı trend tespiti sağlar. Ana Özellikler Özel Zaman Dilimi Analizi : Aynı anda birden fazla,
VR Grid Mt5
Vladimir Pastushak
3.43 (7)
VR Izgara göstergesi, kullanıcı tanımlı ayarlarla grafiksel bir ızgara oluşturmak için tasarlanmıştır . Standart ızgaradan farklı olarak, VR Izgarası dairesel seviyeler oluşturmak için kullanılır. Kullanıcının seçimine bağlı olarak tur seviyeleri arasındaki adım isteğe bağlı olabilir. Ek olarak, diğer göstergeler ve yardımcı programlardan farklı olarak VR Grid, zaman dilimi değiştiğinde veya terminal yeniden başlatıldığında bile ızgaranın konumunu korur . Ayarlar, set dosyaları, demo versiyonlar
FREE
Currency Strength Meter is the easiest way to identify strong and weak currencies. This indicator shows the relative strength of 8 major currencies + Gold: AUD, CAD, CHF, EUR, GBP, JPY, NZD, USD, XAU. Gold symbol can be changed to other symbols like XAG, XAU etc. By default the strength value is normalised to the range from 0 to 100 for RSI algorithm: The value above 60 means strong currency; The value below 40 means weak currency; This indicator needs the history data of all 28 major currency
Currency Power Meter shows the power of major currencies against each other. The indicator shows the relative strength of currency/pair at the current moment in a period of time (H4, daily, weekly, monthly). It is useful for day traders, swing traders and position traders with suitable period options. Currency power is the true reason of market trend: The strongest currency against the weakest currency will combine into a most trending pair. As we know, trend makes money and all traders love tre
A huge number of traders use the VolumeProfile/MarketProfile analysis method. And I think there is no need to explain such concepts as POC and VAH/VAL. However, the standard VolumeProfile representation has a drawback - we only see the current picture of the market. We see the "convexity" of the volume distribution within the period. But we don't see the main thing - the "migration" of the POC level during the price movement. Our indicator is unique. It is dynamic. The first feature is that the
Bu gösterge, bir gün içindeki en büyük ticaret faaliyetinin zamanını belirlemek için tasarlanmıştır. Bu hesaplamadan sonra, gösterge en önemli ticaret seviyelerini oluşturur. Bu seviyeleri fiili fiyat hareketiyle karşılaştırmak, piyasa eğilimlerinin gücü ve yönü hakkında bilgi sağlayabilir. Göstergenin özellikleri Zaman çerçevesi D1'in altında olmalıdır. Önerilen zaman dilimleri: M15, M30 ve H1. H1'in üzerindeki zaman dilimleri çok kaba bir resim verebilir. Ve M15'in altındaki zaman dilimleri
Gann Kutusu (veya Gann Meydanı), W.D. Gann'ın "Piyasa tahminleri için matematiksel formül" makalesine dayanan bir pazar analiz yöntemidir. Bu gösterge üç Kare modelini çizebilir: 90, 52(104), 144. Altı ızgara çeşidi ve iki yay çeşidi vardır. Bir grafik üzerinde aynı anda birden fazla kare çizebilirsiniz. Parametreler Square — kare modelin seçimi : 90 — 90'ın karesi (veya dokuzun karesi); 52 (104) — 52'nin karesi (veya 104); 144 — 144'ün evrensel karesi; 144 (full) — karenin "tam" versiyonu
A "Volume Profile" is an advanced charting indicator that displays total volume traded at every price level over a user specified time period. The main components of the volume profile are POC ( Point Of Control - the price level, at which the maximum number of contracts were executed during a selected period), VAH ( Value Area High - the highest price in the Value Area) and VAL ( Value Area Low - the lowest price in the Value Area). When we settled on the original indicator, we spent a lot o
Pipfinite creates unique, high quality and affordable trading tools. Our tools may or may not work for you, so we strongly suggest to try the Demo Version for MT4 first. Please test the indicator prior to purchasing to determine if it works for you. We want your good reviews, so hurry up and test it for free...we hope you will find it useful. Combo Razor Scalper with Trend Laser Strategy: Scalp in the direction of the trend Watch Video: (Click Here) Features Scalping indicator using a confir
The   Supply and Demand Zones indicator   is one of the best tools we have ever made. This great tool automatically draws supply and demand zones, the best places for opening and closing positions. It has many advanced features such as multi timeframe zones support, displaying the width of zones, alert notifications for retouched zones, and much more. Because of market fractality, this indicator can be used for any kind of trading. Whether you are a positional, swing, or intraday trader does no
Gösterge, tarihsel olanlarla karşılaştırılabilecek güncel teklifler oluşturur ve bu temelde bir fiyat hareketi tahmini yapar. Gösterge, istenen tarihe hızlı navigasyon için bir metin alanına sahiptir. Seçenekler: Sembol - göstergenin göstereceği sembolün seçimi; SymbolPeriod - göstergenin veri alacağı dönemin seçimi; GöstergeRenk - gösterge rengi; Ters - doğru tırnakları tersine çevirir, yanlış - orijinal görünüm; Sonraki, tarihi girebileceğiniz ve 'enter' tuşuna basa
Bu ürünün alıcıları ayrıca şunları da satın alıyor
TPSproTREND PrO MT5
Roman Podpora
4.83 (12)
TPSpro TREND PRO  - is a trend indicator that automatically analyzes the market and provides information about the trend and each of its changes, as well as giving signals for entering trades without redrawing! The indicator uses each candle, analyzing them separately. referring to different impulses - up or down impulse. Exact entry points into transactions for currencies, crypto, metals, stocks, indices!  Version MT4               DETAILED DESCRIPTION               R ecommended to use with an
TALİMATLAR         RUS   -        ENG       Bir gösterge ile kullanılması   önerilir       -       TPSpro   TREND PRO -   Sürüm MT4         Ticarette önemli bir unsur, bir ticaret aracını satın alma veya satma kararlarının alındığı bölgeler veya seviyelerdir. Büyük oyuncuların piyasadaki varlıklarını gizleme girişimlerine rağmen, kaçınılmaz olarak izler bırakırlar. Bizim görevimiz bu izleri nasıl tanımlayacağımızı ve doğru şekilde nasıl yorumlayacağımızı öğrenmekti. Ana işlevler:: Satıcılar ve
FX Power MT5 NG
Daniel Stein
4.75 (8)
FX Power NG'nin Tüm Gücünün Kilidini Açın: Nihai Para Birimi Güç Ölçer FX Power, sekiz yılı aşkın süredir dünya çapındaki yatırımcıları güvenilir ve hassas döviz gücü analizleriyle güçlendirmektedir. Şimdi, FX Power NG bu güvenilir aracı bir sonraki seviyeye taşıyarak, ticaretinize benzersiz doğruluk, özelleştirme ve içgörüler getiren gelişmiş özellikler sunuyor. FX Power NG'yi Ciddi Yatırımcılar İçin Olmazsa Olmaz Kılan Nedir? FX Power NG, orijinal FX Power'da sevdiğiniz her şeyi temel ekle
Öncelikle, bu Ticaret Sistemi'nin Non-Repainting, Non-Redrawing ve Non-Lagging Göstergesi olduğunu vurgulamak önemlidir, bu da hem manuel hem de robot ticareti için ideal hale getirir. Online kurs, kılavuz ve ön ayarları indir. "Smart Trend Trading System MT5", yeni ve deneyimli tüccarlar için özelleştirilmiş kapsamlı bir ticaret çözümüdür. 10'dan fazla premium göstergeyi birleştiriyor ve 7'den fazla sağlam ticaret stratejisi sunuyor, bu da çeşitli piyasa koşulları için esnek bir seçim yapar. Tr
FX Volume MT5
Daniel Stein
4.93 (14)
FX Hacmi ile Forex'te Gerçek Bir Avantaj Elde Edin: Nihai Hacim Göstergesi FX Volume, gerçek piyasa duyarlılığını içeriden bir bakış açısıyla ortaya koyan ilk ve tek hacim göstergesidir. FX Volume, kurumsal piyasa katılımcılarının ve brokerlerin nasıl konumlandıklarına dair benzersiz bilgiler sağlayarak, genellikle büyük oyuncular için ayrılmış öngörü ile ticaret yapmanıza olanak tanır. COT raporlarının gecikmelerine elveda deyin - FX Volume size bu önemli bilgileri anında grafiğinizde sunarak
IVISTscalp5
Vadym Zhukovskyi
5 (6)
What's new about iVISTscalp5 forecast indicator (Version 10)? iVISTscalp5 is a unique nonlinear forecasting for a week ahead system for any financial instrument which executes fast scalping using time levels. iVISTscalp5 is a tool for easy study and understanding of financial market. 1) iVISTscalp5 forecast indicator has been completely rewritten into another programming language (C++), which has accelerated data loading and processing. As a result, a different graphical display of forecast
FX Seviyelerini Keşfedin: Ticarette Başarı için Nihai Destek ve Direnç Göstergeniz FX Levels bir destek ve direnç göstergesinden daha fazlasıdır; döviz çiftleri, endeksler, hisse senetleri veya emtialar olsun, tüm ticaret sembollerinde hassasiyet, güvenilirlik ve sorunsuz işlevsellik isteyen ciddi tüccarlar için oyunun kurallarını değiştirir. Kanıtlanmış Lighthouse yöntemi üzerine inşa edilen ve dinamik, gerçek zamanlı uyarlanabilirlik ile geliştirilen FX Levels, hassas kar hedefleri belirleme
Bu gösterge paneli, seçilen semboller için mevcut en son   harmonik kalıpları   gösterir, böylece zamandan tasarruf edersiniz ve daha verimli olursunuz /   MT4 sürümü . Ücretsiz Gösterge:   Basic Harmonic Pattern Gösterge sütunları Symbol :   seçilen semboller görünecektir Trend:   yükseliş veya düşüş Pattern :   desen türü (gartley, kelebek, yarasa, yengeç, köpekbalığı, cypher veya ABCD) Entry :   giriş fiyatı SL:   zararı durdur fiyatı TP1:   1. kar alma fiyatı TP2:   2. kar alma fiyatı
Atomic Analyst MT5
Issam Kassas
4.28 (18)
Öncelikle belirtmek gerekir ki bu Ticaret Göstergesi Yeniden Çizim Yapmaz, Gecikmez ve Gecikme Göstermez, bu da hem manuel hem de robot ticareti için ideal hale getirir. Kullanıcı kılavuzu: ayarlar, girişler ve strateji. Atom Analisti, Piyasada Daha İyi Bir Avantaj Bulmak İçin Fiyatın Gücünü ve Momentumunu Kullanan PA Fiyat Hareketi Göstergesidir. Gürültüleri ve Yanlış Sinyalleri Kaldırmaya ve Ticaret Potansiyelini Artırmaya Yardımcı Olan Gelişmiş Filtrelerle Donatılmıştır. Birden fazla katmanl
Quantum TrendPulse
Bogdan Ion Puscasu
5 (3)
SuperTrend   ,   RSI   ve   Stochastic'in   gücünü tek bir kapsamlı göstergede birleştirerek işlem potansiyelinizi en üst düzeye çıkaran nihai işlem aracı olan   Quantum TrendPulse'u   tanıtıyoruz. Hassasiyet ve verimlilik arayan yatırımcılar için tasarlanan bu gösterge, piyasa trendlerini, momentum değişimlerini ve en uygun giriş ve çıkış noktalarını güvenle belirlemenize yardımcı olur. Temel Özellikler: SuperTrend Entegrasyonu:   Güncel piyasa trendlerini kolayca takip edin ve karlılık dalgası
TrendMaestro5
Stefano Frisetti
note: this indicator is for METATRADER4, if you want the version for METATRADER5 this is the link:  https://www.mql5.com/it/market/product/108106 TRENDMAESTRO ver 2.4 TRENDMAESTRO recognizes a new TREND in the bud, he never makes mistakes. The certainty of identifying a new TREND is priceless. DESCRIPTION TRENDMAESTRO identifies a new TREND in the bud, this indicator examines the volatility, volumes and momentum to identify the moment in which there is an explosion of one or more of these data a
Top indicator for MT5   providing accurate signals to enter a trade without repainting! It can be applied to any financial assets:   forex, cryptocurrencies, metals, stocks, indices .  Watch  the video  (6:22) with an example of processing only one signal that paid off the indicator! MT4 version is here It will provide pretty accurate trading signals and tell you when it's best to open a trade and close it. Most traders improve their trading results during the first trading week with the help of
Tanıtım       Quantum Breakout PRO   , Breakout Bölgeleri ile ticaret yapma şeklinizi değiştiren çığır açan MQL5 Göstergesi! 13 yılı aşkın ticaret tecrübesine sahip deneyimli tüccarlardan oluşan bir ekip tarafından geliştirilmiştir.       Kuantum Breakout PRO       yenilikçi ve dinamik koparma bölgesi stratejisiyle ticaret yolculuğunuzu yeni zirvelere taşımak için tasarlanmıştır. Kuantum Breakout Göstergesi, size 5 kar hedefi bölgesi ile kırılma bölgelerinde sinyal okları ve kırılma kutusuna
Matrix Arrow Indicator MT5
Juvenille Emperor Limited
5 (13)
Matrix Arrow Indicator MT5 ,   forex ,   emtialar ,   kripto   para birimleri ,   endeksler ,   hisse senetleri   gibi tüm sembollerde/araçlarda kullanılabilen   %100 yeniden boyamayan   çoklu zaman çerçevesi göstergesini izleyen benzersiz bir 10'u 1 arada trenddir.  Matrix Arrow Indicator MT5 , mevcut eğilimi erken aşamalarında belirleyecek ve aşağıdakiler gibi 10'a kadar standart göstergeden bilgi ve veri toplayacaktır: Ortalama Yönlü Hareket Endeksi (ADX) Emtia Kanal Endeksi (CCI) Klasik Hei
Golden Trend Indicator MT5
Noha Mohamed Fathy Younes Badr
5 (2)
Golden Trend indicator  is The best indicator for predicting trend movement this indicator never lags and never repaints and never back paints    and give  arrow buy and sell    before the candle appear  and it will help you and  will make your trading decisions clearer its work on all currencies and  gold and crypto and all time frame This unique  indicator uses very secret algorithms to catch the  trends, so you can trade using this indicator and see the trend clear on charts  manual guide and
TPA True Price Action indicator reveals the true price action of the market makers through 100% non-repainting signals strictly at the close of a candle! TPA shows entries and re-entries, every time the bulls are definitely stronger than the bears and vice versa. Not to confuse with red/green candles. The shift of power gets confirmed at the earliest stage and is ONE exit strategy of several. There are available now two free parts of the TPA User Guide for our customers. The first "The Basics"
Quantum Trend Sniper
Bogdan Ion Puscasu
4.71 (49)
Tanıtım       Kuantum Trend Keskin Nişancı Göstergesi   , trend tersine dönmeleri belirleme ve ticaret yapma şeklinizi değiştiren çığır açan MQL5 Göstergesi! 13 yılı aşkın ticaret tecrübesine sahip deneyimli tüccarlardan oluşan bir ekip tarafından geliştirilmiştir.       Kuantum Trend Keskin Nişancı Göstergesi       trend dönüşlerini son derece yüksek doğrulukla belirlemenin yenilikçi yolu ile ticaret yolculuğunuzu yeni zirvelere taşımak için tasarlanmıştır. ***Kuantum Trend Keskin Nişancı Gö
AT Forex Indicator MT5
Marzena Maria Szmit
5 (5)
The AT Forex Indicator MT5 is a sophisticated trading tool designed to provide traders with a comprehensive analysis of multiple currency pairs. This powerful indicator simplifies the complex nature of the forex market, making it accessible for both novice and experienced traders. AT Forex Indicator uses advanced algorithms to detect trends, patterns and is an essential tool for traders aiming to enhance their forex trading performance. With its robust features, ease of use, and reliable signal
Bill Williams Advanced
Siarhei Vashchylka
5 (8)
Bill Williams Advanced is designed for automatic chart analysis using Bill Williams' "Profitunity" system. The indicator analyzes four timeframes at once. Manual (Be sure to read before purchasing) Advantages 1. Automatically analyzes the chart using the "Profitunity" system of Bill Williams. The found signals are placed in a table in the corner of the screen. 2. Equipped with a trend filter based on the Alligator indicator. Most of the system signals are recommended to be used only accordi
IX Power MT5
Daniel Stein
4.17 (6)
IX Power ile tanışın - ticaret hassasiyetinizi güçlendirmek için nihai araç! FX Power ile aynı rakipsiz doğrulukla tasarlanan IX Power, endeksler ve hisse senetlerinden emtialara, ETF'lere ve hatta kripto para birimlerine kadar her türlü işlem sembolünde uzmanlaşmanızı sağlar. Tüm favori varlıklarınızdaki kısa, orta ve uzun vadeli trendler hakkında kesin bilgilerle ticaretinizi yükseltmeye hazır olun. Neden IX Power'ı Seçmelisiniz? IX Power ile zamanlamanız keskinleşir ve daha akıllı, daha hı
PZ Day Trading MT5
PZ TRADING SLU
2.83 (6)
Effortless trading: non-repainting indicator for accurate price reversals Special Offer: Purchase now to receive free bonuses worth $60! (Read more for details) This indicator detects price reversals in a zig-zag fashion, using only price action analysis and a donchian channel. It has been specifically designed for short-term trading, without repainting or backpainting at all. It is a fantastic tool for shrewd traders aiming to increase the timing of their operations. [ Installation Guide | Upd
Şimdi 147 $ (birkaç güncellemeden sonra 499 $ 'a yükseliyor) - Sınırsız Hesaplar (PC'ler veya Mac'ler) RelicusRoad Kullanım Kılavuzu + Eğitim Videoları + Özel Discord Grubuna Erişim + VIP Durumu PİYASAYA BAKMAK İÇİN YENİ BİR YOL RelicusRoad, forex, vadeli işlemler, kripto para birimleri, hisse senetleri ve endeksler için dünyanın en güçlü ticaret göstergesidir ve yatırımcılara kârlı kalmaları için ihtiyaç duydukları tüm bilgileri ve araçları sağlar. Başlangıç ​​seviyesinden ileri seviyey
SS7Trader'ın Neural FX Indicator ile yapay zekanın gücünü keşfedin! Bu ileri düzey, yapay sinir ağlarıyla desteklenen araç, Forex, Hisse Senetleri, Kripto Para Birimleri, Endeksler ve XAUUSD gibi birçok piyasada işlemlerinizi optimize etmek için tasarlanmıştır. Güçlü göstergemiz, sabit kalan ve yeniden çizilmeyen net Alım ve Satım sinyalleri sunarak gerçek zamanlı olarak kendinize güvenerek karar almanızı sağlar. Neural FX Indicator , yalnızca MetaTrader 5 (MT5) platformunda kullanılabilir ve dü
Elliott Wave Trend was designed for the scientific wave counting. This tool focuses to get rid of the vagueness of the classic Elliott Wave Counting using the guideline from the template and pattern approach. In doing so, firstly Elliott Wave Trend offers the template for your wave counting. Secondly, it offers Wave Structural Score to assist to identify accurate wave formation. It offers both impulse wave Structural Score and corrective wave Structure Score. Structural Score is the rating to sh
Advanced Supply Demand MT5
Bernhard Schweigert
4.5 (14)
Herhangi bir Acemi veya Uzman Tüccar için En İyi Çözüm! Bu gösterge benzersiz, yüksek kaliteli ve uygun fiyatlı bir ticaret aracıdır çünkü bir dizi tescilli özelliği ve yeni bir formülü bir araya getirdik. Bu güncelleme ile çift zaman dilimi dilimlerini gösterebileceksiniz. Yalnızca daha yüksek bir TF gösteremeyeceksiniz, aynı zamanda TF grafiğini ve ARTIK daha yüksek TF'yi de gösterebileceksiniz: YUVARLAK BÖLGELERİ GÖSTERMEK. Tüm Arz Talebi tüccarları buna bayılacak. :) Önemli Bilgiler Açıkland
Legacy of Gann for MT5
Pavel Zamoshnikov
5 (5)
The indicator very accurately determines the levels of the possible end of the trend and profit fixing. The method of determining levels is based on the ideas of W.D.Gann, using an algorithm developed by his follower Kirill Borovsky. Extremely high reliability of reaching levels (according to K. Borovsky  - 80-90%) Indispensable for any trading strategy – every trader needs to determine the exit point from the market! Precisely determines targets on any timeframes and any instruments (forex, met
Berma Bands
Muhammad Elbermawi
The Berma Bands (BBs) indicator is a valuable tool for traders seeking to identify and capitalize on market trends. By analyzing the relationship between the price and the BBs, traders can discern whether a market is in a trending or ranging phase. Berma Bands are composed of three distinct lines: the Upper Berma Band, the Middle Berma Band, and the Lower Berma Band. These lines are plotted around the price, creating a visual representation of the price movement relative to the overall trend.
Quantum Heiken Ashi PRO MT5
Bogdan Ion Puscasu
4.44 (9)
Quantum Heiken Ashi PRO ile   tanışın Pazar eğilimleri hakkında net bilgiler sağlamak üzere tasarlanan Heiken Ashi mumları, gürültüyü filtreleme ve yanlış sinyalleri ortadan kaldırma yetenekleriyle ünlüdür. Kafa karıştırıcı fiyat dalgalanmalarına veda edin ve daha sorunsuz, daha güvenilir bir grafik sunumuna merhaba deyin. Quantum Heiken Ashi PRO'yu gerçekten benzersiz kılan şey, geleneksel şamdan verilerini okunması kolay renkli çubuklara dönüştüren yenilikçi formülüdür. Kırmızı ve yeşil çubukl
Blahtech Supply Demand MT5
Blahtech Limited
4.54 (13)
Was: $299  Now: $99   Supply Demand uses previous price action to identify potential imbalances between buyers and sellers. The key is to identify the better odds zones, not just the untouched ones. Blahtech Supply Demand indicator delivers functionality previously unavailable on any trading platform. This 4-in-1 indicator not only highlights the higher probability zones using a multi-criteria strength engine, but also combines it with multi-timeframe trend analysis, previously confirmed swings
Fibonacci retracement is a method of technical analysis for determining support and resistance levels. The TSO Fibonacci Chains Indicator is different from a simple Fibonacci Retracements indicator in that it provides the targets for each retracement level. In other words, there is an Extension Level (D) for every Retracement Level (C). In addition, if an Extension Level is reached, then a new Fibonacci setup is created automatically. These consecutive Fibonacci setups create a chain that reveal
Yazarın diğer ürünleri
Currency Strength Meter is the easiest way to identify strong and weak currencies. This indicator shows the relative strength of 8 major currencies + Gold: AUD, CAD, CHF, EUR, GBP, JPY, NZD, USD, XAU. Gold symbol can be changed to other symbols like XAG, XAU etc. By default the strength value is normalised to the range from 0 to 100 for RSI algorithm: The value above 60 means strong currency; The value below 40 means weak currency; This indicator needs the data of all 28 major currency pairs
Currency Strength Meter is the easiest way to identify strong and weak currencies. This indicator shows the relative strength of 8 major currencies + Gold: AUD, CAD, CHF, EUR, GBP, JPY, NZD, USD, XAU. Gold symbol can be changed to other symbols like XAG, XAU etc. By default the strength value is normalised to the range from 0 to 100 for RSI algorithm: The value above 60 means strong currency; The value below 40 means weak currency; This indicator needs the data of all 28 major currency pairs
Currency Strength Meter is the easiest way to identify strong and weak currencies. This indicator shows the relative strength of 8 major currencies + Gold: AUD, CAD, CHF, EUR, GBP, JPY, NZD, USD, XAU. Gold symbol can be changed to other symbols like XAG, XAU etc. By default the strength value is normalised to the range from 0 to 100 for RSI algorithm: The value above 60 means strong currency; The value below 40 means weak currency; This indicator needs the history data of all 28 major currency
Trend Power for MT4
ALEKSANDR SHUKALOVICH
4.67 (3)
Trend Power Indicator is an indicator which helps to identify trend direction and its power by using moving averages ZigZag pattern and correlations of tradable instruments. It provides trend power data with user-friendly interface which can be read easily and fast.   This indicator by default is configured for trading of Adam Khoo's ( Piranhaprofit ) strategies. It saves mass of time for searching of tradable pairs by his strategies. It indicates when all required moving averages are alignment
Currency Strength Meter is the easiest way to identify strong and weak currencies. This indicator shows the relative strength of 8 major currencies + Gold: AUD, CAD, CHF, EUR, GBP, JPY, NZD, USD, XAU. Gold symbol can be changed to other symbols like XAG, XAU etc. By default the strength value is normalised to the range from 0 to 100 for RSI algorithm: The value above 60 means strong currency; The value below 40 means weak currency; This indicator needs the data of all 28 major currency pairs
News Scalping Executor is an advisor which helps to trade news with high impact and huge volatility. This advisor helps to create two opposite orders with risk management. It moves automatically stop loss level to avoid losses as much as possible by using many different algorithms. It helps to avoid trading the news if spread suddenly becomes very huge. To be profitable with this type of trading you should choose the most volatile types of news such as: GDP, CPI, Unemployment Claims, Intere
News Scalping Executor Pro is an advisor which helps to trade news with high impact and huge volatility. This advisor helps to create two opposite orders with risk management and profit protection. It moves automatically stop loss level to avoid losses as much as possible by using many different algorithms. It helps to avoid trading the news if spread suddenly becomes very huge. It can lock profit by moving stop loss or partially closing of orders. To be profitable with this type of trading
Currency Strength Meter is the easiest way to identify strong and weak currencies. The indicator shows the relative strength of 8 major currencies: AUD, CAD, CHF, EUR, GBP, JPY, NZD, USD. By default the strength value is normalised to the range from 0 to 100 for RSI algorithm: The value above 60 means strong currency; The value below 40 means weak currency; The indicator is created and optimized for using it externally at an Expert Advisors or as a Custom Indicator inside your programs. For
Chart State Saver for MT4 is utility which helps to save states of all your charts even if they will be closed. And then all saved charts' states can be easily loaded back to charts. It stores templates for each particular currency pair and automatically applies them to charts once they will be opened at next time. Also they can be applied to the charts by your own needs. Thus you can close any chart at your MT4 without scaring to lose chart's data like drawls, messages, chart styling and so
The MA Bounce Strategy is a strategy that seeks to long FX pairs on a strong uptrend as they bounce off their MA support and shorting FX pairs on a strong downtrend as they bounce off MA resistance. The best suitable periods of moving averages for that strategy are 18, 30, 50. This indicator helps to identify and find place for potential market entry by MA bounce strategy. Read   More information about  MA Bounce Strategy . By default MA Bounce Strategy indicator is configured for trading of M1
News Scalping Executor is an utility which helps to trade high impact and huge volatility   news . This utility helps to create two opposite orders with risk management and profit protection. It moves automatically stop loss level to avoid losses as much as possible by using many different algorithms. It helps to avoid trading the news if spread suddenly becomes very huge. It can lock profit by moving stop loss or partially closing of orders. To be profitable with this type of trading you sh
News Scalping Executor Pro is an utility which helps to trade high impact and huge volatility news . This utility helps to create two opposite orders with risk management and profit protection. It moves automatically stop loss level to avoid losses as much as possible by using many different algorithms. It helps to avoid trading the news if spread suddenly becomes very huge. It can lock profit by moving stop loss or partially closing of orders. To be profitable with this type of trading you
Currency Strength Meter is the easiest way to identify strong and weak currencies. This indicator shows the relative strength of 8 major currencies + Gold: AUD, CAD, CHF, EUR, GBP, JPY, NZD, USD, XAU. Gold symbol can be changed to other symbols like XAG, XAU etc. By default the strength value is normalised to the range from 0 to 100 for RSI algorithm: The value above 60 means strong currency; The value below 40 means weak currency; This indicator needs the history data of all 28 major curren
Currency Strength Meter is the easiest way to identify strong and weak currencies.   The   indicator shows the relative strength of 8 major currencies: AUD, CAD, CHF, EUR, GBP, JPY, NZD, USD. By default the strength value is normalised to the range from 0 to 100 for RSI algorithm: The value above 60 means strong currency; The value below 40 means weak currency; The indicator is created and optimized for using it externally at an Expert Advisors or as a Custom Indicator inside your programs.
Trend Power for MT5
ALEKSANDR SHUKALOVICH
5 (1)
Trend Power Indicator is an indicator which helps to identify trend direction and its power by using moving averages ZigZag pattern and correlations of tradable instruments. It provides trend power data with user-friendly interface which can be read easily and fast.   This indicator by default is configured for trading of   Adam Khoo's   ( Piranhaprofit ) strategies. It saves mass of time for searching of tradable pairs by his strategies. It indicates when all required moving averages are align
Chart State Saver for MT5 is utility which helps to save states of all your charts even if they will be closed. And then all saved charts' states can be easily loaded back to charts. It stores templates for each particular currency pair and automatically applies them to charts once they will be opened at next time. Also they can be applied to the charts by your own needs. Thus you can close any chart at your MT5 without scaring to lose chart's data like drawls, messages, chart styling and so
The MA Bounce Strategy is a strategy that seeks to long FX pairs on a strong uptrend as they bounce off their MA support and shorting FX pairs on a strong downtrend as they bounce off MA resistance. The best suitable periods of moving averages for that strategy are 18, 30, 50. This indicator helps to identify and find place for potential market entry by MA bounce strategy.  More information about  MA Bounce Strategy can be read by this link  https://www.mql5.com/en/blogs/post/743037 .  By defaul
Filtrele:
İnceleme yok
İncelemeye yanıt
Sürüm 7.0 2023.12.18
Improved CCI algorithm and its coordinate system is converted to dimension from 0 to 100 values.
Improved RVI algorithm and its coordinate system is converted to dimension from 0 to 100 values.
Improved Momentum algorithm and its coordinate system is converted to dimension from 0 to 100 values.
Improved DeMarker algorithm.
Improved MACD algorithm.
Added ADX algorithm for instruments' volatility measurement (not to measure strength, the higher the value, the higher the volatility of the instrument).
Changed default table's cell width for simple table from 60 to 62 to accommodate time at info cell.
Log level changed from "Disabled" to "Error" (if you do not need logs messages you have to change property "Log level" to "Disabled").
"Update on every tick " now updates CSM data if new quote would be received for any of monitoring pairs.
Fixed blinking of tables on dashboard.
Fixed clicking on grid of table's headers cells.
Added information cell on table's header which can show different types of information or be as a "Button" to do some work.
Updated contact information at indicator's "About" property tab.
Added possibility to get alerts separately for all found tradable pairs.
Added seconds to notification's time in notifications signals.
Improved logging.
Added possibility to move dashboard to main window and any sub-window of a chart.
Fixed incorrect focus of dashboard's controls if there are several sub windows on a chart.
Added possibility to use "." and ";" symbols as a separator for timeframes formula for average value calculation of simple and sorted dashboard tables.
Recompiled with new MQL compiler and others minor improvements and fixes.
Sürüm 6.10 2023.02.28
Added possibility to change number of decimals for simple table, sorted table, graph labels and graph lines libels.
Sürüm 6.0 2023.02.17
Added sessions time for throwing notifications.
Added possibility to choose show or not show cross lines notification for instruments' for which symbol does not exist.
Improved support of partial strength calculation if not all required history data is available.
Improved indicator work stability.
Improved trace messages.
Fixed mistype at trace messages.
Fixed algorithm of moving average value calculation.
Fixed tradable pairs searching with moving average algorithm in some cases.
Fixed not throwing of cross lines notification if at least one of 28 symbols does not exists.
Fixed out of range error in some cases.
Sürüm 5.41 2022.10.18
Fixed indicator loading if some history data is missed for MACD algorithm.
Sürüm 5.40 2022.10.17
Added MACD algorithm for currencies' strength value calculation.
Added LM (max level boundary) algorithm for tradable pairs searching.
Sürüm 5.30 2022.09.29
Added better support of x0.5 scaling.
Window's title icon, Window's caption text and Window's main buttons icons are aligned by center.
Sürüm 5.22 2022.09.11
Added possibility to show label for history line with history line's date and time.
Sürüm 5.12 2022.08.30
Workaround incorrect GBP symbols parsing by IG broker.
Sürüm 5.11 2022.08.23
Workaround incorrect symbol parsing by IG broker.
Sürüm 5.10 2022.07.25
Improved strength value calculation if new candle for some pairs of 28 is appeared and for some pairs of 28 new candle is not appeared yet (haven't received new ticks for some pairs of 28 at time when new candle should be formed).
Sürüm 5.0 2022.06.19
Added possibility to change table header text color for all tables.
Added possibility to change text color of table cells for weak, strong and neutral currencies strengths.
Added "Disabled" log level and it's used by default.
Added possibility to change symbol of current chart by clicking instruments names on headers of simple table rows on dashboard.
Added possibility to change timeframe of current chart by clicking on timeframes on header of simple table columns on dashboard.
Added possibility to change timeframe of current chart by clicking on timeframes on header of sorted table columns on dashboard.
Updated GUI Processor with many graphical improvements and bug fixes of UI processor.
Improved strength calculation speed.
Improved calculation speed of indicator processors for "Time based process" (if possible it passes calculation to "Index base process" which is much faster than "Time based process").
Improved initialization speed of CorrelatedIndicatorProcessor for MT5.
Improved log messages and added new messages to log.
Workaround incorrect symbol parsing by XM broker.
Fixed not updating indicator strength values in some cases (when history time equals to 0, transmitting to "Index base" calculation).
Fixed slow loading data of simple table on dashboard.
Fixed wrong average strength value calculation in some cases.
Refactoring and many other improvements.
Sürüm 4.0 2021.12.31
Added possibility to run many instances of indicator to the same chart window.
Added application source description for all notifications, it helps to identify from which instance of indicator a notification was thrown.
Added possibility to change the names of tradable pairs table's columns.
Added tracing for terminal information, broker information, MQL program information and input parameters information.
Added "Get instruments from" property for Simple Table, Sorted Table and Tradable Pairs Table to show strength only for specified instruments.
Added possibility to show Cross Lines Notification for instruments from specified symbols or specified instruments.
Added possibility to show Cross Level Notification for instruments from specified symbols or specified instruments.
Added possibility to show Tradable Pairs Notification for instruments from specified symbols or specified instruments.
Added possibility to show Currencies Strength State Notification for instruments from specified symbols or specified instruments.
Added possibility to change table head color for all tables (Simple table, Sorted table, Tradable pairs table).
Added possibility to highlight tables' timeframes cell for current chart timeframe by different color.
Added possibility to highlight tables' instruments cells for current chart symbol by different color.
Added cross level notifications for average strength from multiple timeframes.
Added cross lines notifications for average strength from multiple timeframes.
Added possibility to search crosses lines for cross lines notifications on different timeframe together at the same time (works as AND condition) like it was done for crosses levels notifications.
Added new filtering algorithm for tradable pairs searching. It's called "Symbols". It allows to search tradable pairs with pairs which are listed by user or ignore pairs which are listed by user.
Changed MA algorithm rules for search of tradable pairs (If you are using custom tradable pairs expression do not forget to update your expression according new rules for MA algorithm).
Improved indicator initialization stability.
Fixed not getting tradable pairs notifications.
Fixed not showing last tradable pair at tradable pairs table if all pairs should be shown by condition.
Fixed typo mistakes at input parameters of indicator.
Sürüm 3.3 2021.08.21
Optimized of CSM values calculation by caching values for every update circle (7 times faster, load of CPU for CSM values calculation is reduced for 85 percent).
Added several algorithms for processing of TradablePair table's cell clicking (open pair at new chart, open pair at other chart or new one if it is not opened yet).
Added scrolling of chart to history line time if it is out of view (it allows do not lose history line).
Fixed DeMarker algorithm name.
Speed up of tradable pairs searching with MA algorithm at indicator init time and switching timeframes.
Sürüm 3.2 2021.06.26
Added 5 properties for tradable pairs expression (this properties are concatenated together and it allows to avoid MQL limits for property length of 226 chars, now it's possible to use expression with 1130 chars length).
Sürüm 3.1 2021.06.23
Added possibility to enable tradable pairs notifications only for specified columns.
Sürüm 3.0 2021.06.07
Added possibility to backtest history data with history line at specified time with one minute accuracy (not only with close time of candle).
Added possibility to change Gold symbol. It allows to use any different symbol not only gold but XAG, XAU etc.
Added Bullish or Bearish direction of tradable pairs in tradable pairs notification message.
Sorting of tradable pairs alphabetically.
Adding history line object to visible list of chart objects.
Keeping history line state on chart even if indicator's properties have changed.
Momentum algorithm values for strength calculation is multiplied by 100.
RVI algorithm values for strength calculation is multiplied by 100.
Disabled ray property of history line.
Sürüm 2.11 2021.03.31
Fixed tradable pairs finder for MA alignment algorithm if Gold is enabled.
Sürüm 2.10 2021.03.29
Added navigation through tradable pairs by left mouse click on calls of tradable pairs table.
Added bearish and bullish coloring of tradable pairs table according to expression at indicator properties.
Added possibility to change color for bearish and bullish of tradable pairs cells.
Added bearish or bullish description next to tradable pair for Currency Strength State Notification.
Added new DM (Difference max between currencies' strength) algorithm for tradable pair search engine.
Added Moving Averages Alignment algorithm for tradable pair search engine.
Fixed D (Min Difference between currencies' strength) algorithm for tradable pair search engine for (CCI, RVI and Momentum algorithms).
Fixed indicator initialization if cross level expression is empty at indicator properties.
Sürüm 2.2 2020.12.31
Added possibility to use multiple tradable pairs finders.
Added tradable pairs state to Currency Strength State Notification.
Added possibility to change visible rows count for tradable pairs table.
Sürüm 2.1 2020.11.20
Fixed sending Tradable Pairs notification.
Sürüm 2.0 2020.11.17
Added high resolution screens support (4K).
Added User Interface (UI) scaling and Font scaling.
Added support of strength identification for Gold.
Added expression based tables columns visibility, It allows to customize tables columns.
Added possibility to get notification once N period candle is closed.
Added expression based notification for levels crossing, which allows to get notifications when there is a cross on many different timeframes all at once.
Added averaging CSM values for different timeframe for tradable pairs finder.
Added support for all timeframes (M1,M2,M3,M4,M5,M6,M10,M12,M15,M20,M30,H1,H2,H3,H4,H6,H8,H12,D1,W1,MN1,Current).
Added new Currencies Strength State Notification which shows strength of all currencies as N period candle is closed.
Added averaging CSM values for Currencies Strength State Notification.
Improved history data loading. It allows to show indicator data more faster if history data is missed.
Improved logging at notifications area.
Fixed delay of dashboard data updating after timeframe switching.
Fixed updating indicator data when market is closed, when there is not any ticks.
Fixed not sending of notifications on some conditions.
Fixed typo mistakes.
Sürüm 1.10 2020.07.09
Added auto detection of symbols suffix.
Added scale ration parameter for RSI algorithm.
Restore dashboard state when change chart symbol, timeframe, reconnection to the server and changing indicator properties.
Sürüm 1.1 2020.05.05
Fixed chart scrolling when indicator is added.