Candle Retracements
- Göstergeler
- Flavio Javier Jarabeck
- Sürüm: 1.4
- Güncellendi: 6 Haziran 2020
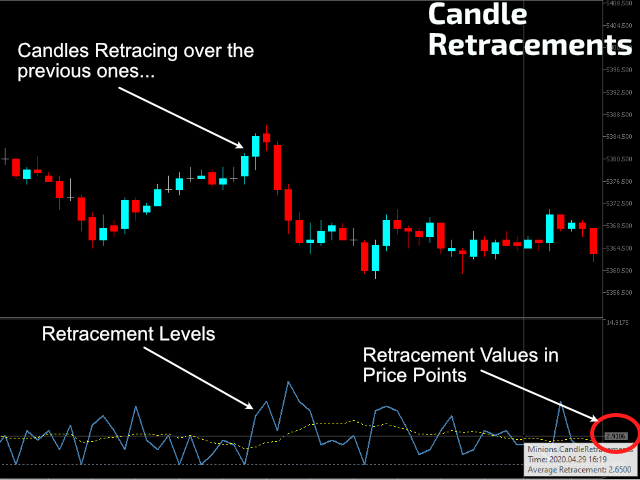
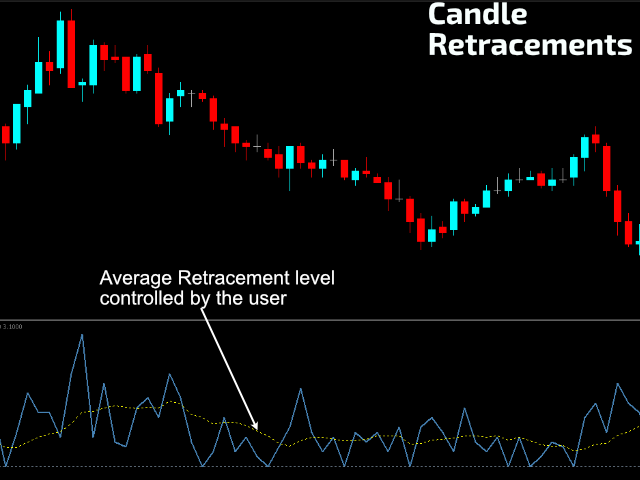
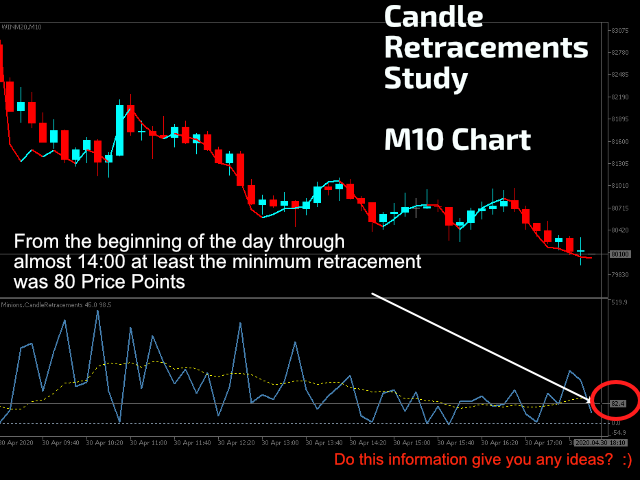
Do you want to know how much, how frequent and at what level a candlestick retraces over the previous one, just drop Candles Retracement over your chart and see it visually! Just choose your desired timeframe and the indicator will show it graphically. As simple as that... In addition you have the option to calibrate a Moving Average over this sub-window chart monitor. This indicator could be used to study candle retracements levels so you can comfortably expect during a trade what to expect from Price.
The measuring mechanism is simple:
SETTINGS
- Moving Average period to apply
If you like this indicator, all I am asking is a little Review (not a Comment, but a REVIEW!)...
This will mean A LOT to me... And this way I can continue to give away Cool Stuff for Free...
With No Strings Attached! Ever!
Live Long and Prosper!
;)


Неплохой индикатор, спасибо автору.