• Genel bakış
  • İncelemeler (7)
  • Yorumlar (22)

Bermaui RSI Candles

5

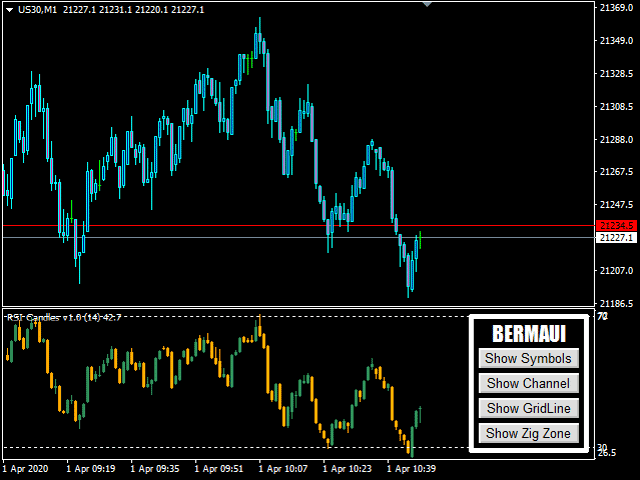
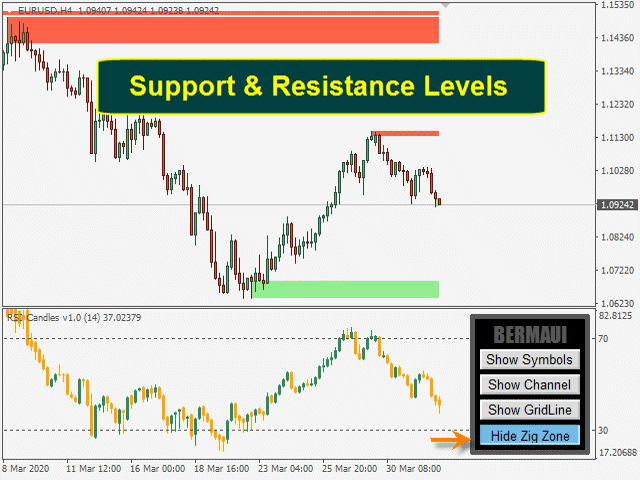
Bu göstergenin fikri, alım ve satım sinyalleri oluşturmak için fiyat çizelgeleri ile karşılaştırılabilecek mum şeklinde RSI çizmektir. Gösterge benim buluşum değil. Birkaç yıl önce internette kurdum. Kodu güncelledim, uyarı işlevleri ekledim, Bermaui Utilities araç grubunu ekledim.

Gösterge, mum çubukları çizmek için kullanılan tüm fiyatların RSI'sını hesaplar (açık, yüksek, düşük ve kapalı RSI). RSI mumlarını yüksek fitili çekmek için en yükseklerini ve RSI mumlarını düşük fitili çekmek için en düşüklerini kullanır. RSI mumlarının gövdesi, en yüksek ve en düşük seviyeleri arasında yer alır. Açılışın RSI'si kapanışın RSI'sından düşükse, RSI Mumunun yükseliş olduğu kabul edilir. Açılışın RSI'si kapanışın RSI'sinden yüksekse, RSI Mumunun düşüş eğiliminde olduğu kabul edilir.

Bu nasıl kullanılır

  • Momentum fiyatı yönlendirdiği için fiyat grafiğinde trende öncülük edecek olan RSI Mumları göstergesinde trend çizgileri kırılması ticareti yapabilirsiniz.
  • RSI Mumları göstergesinde herhangi bir klasik grafik deseni şekli çizebilir ve orijinal RSI ile yaptığınız gibi ticaret yapabilirsiniz.
  • Klasik bir RSI olarak kullanılabilir. Aşırı alımı (%70) geçerse sat, aşırı satımı (%30) geçerse satın al.
  • Alım satım sinyallerinizi doğrulamak için RSI Mumları ve fiyat çizelgeleri arasındaki farkı kullanabilirsiniz.

RSI Mumları Özellikleri

  • Sonuçlarını yeniden boyamaz veya yeniden hesaplamaz.
  • Kripto para birimleri, hisse senedi, endeks, petrol, altın ve tüm zaman dilimlerinde çalışır.
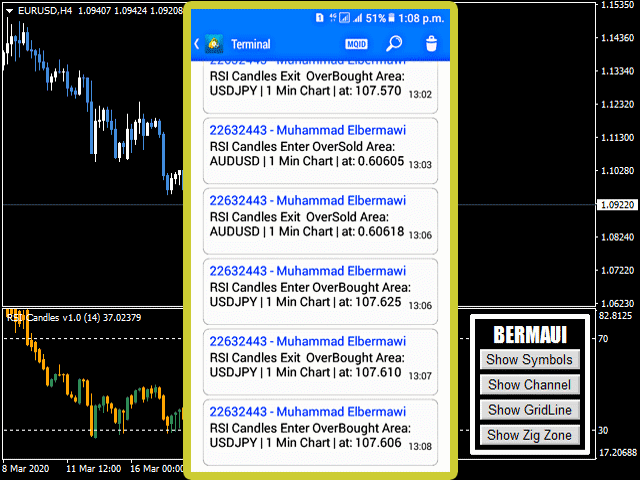
  • Ses, e-posta uyarıları ve Mobil Bildirim.
  • Grafikte aşırı alım ve aşırı satım sinyallerini gösteren Dikey Çizgiler.
  • Kullanıcının aralarında kolayca gezinmesine yardımcı olacak iyi tasarlanmış parametreler.
  • Kendi uzman danışmanlarınızı oluşturmak için arabellek.
  • Aralarından seçim yapabileceğiniz dört farklı renk listesi.

RSI Mum Parametreleri

(1) GÖSTERGE PARAMETRELERİ

  • RSI Dönemi.Varsayılan 14'tür.
  • Aşırı Satıldı Seviyesi.Varsayılan %30'dur
  • Satın Alma Seviyesinin Üzerinde.Varsayılan %70

(2) V HATLARI VE UYARILAR

  • Dikey Çizgiyi Göster.Eğer doğruysa, RSI Mumları aşırı alım veya aşırı satım alanlarına girdiğinde/çıktığında grafikte dikey çizgiler çizecektir. Varsayılan yanlıştır.
  • Ses Alarmi.Varsayılan doğrudur.
  • Eposta gönder.Varsayılan yanlıştır.
  • Mobil Bildirim Gönder.Varsayılan yanlıştır.
(3) UYGULAMA AYARLARI
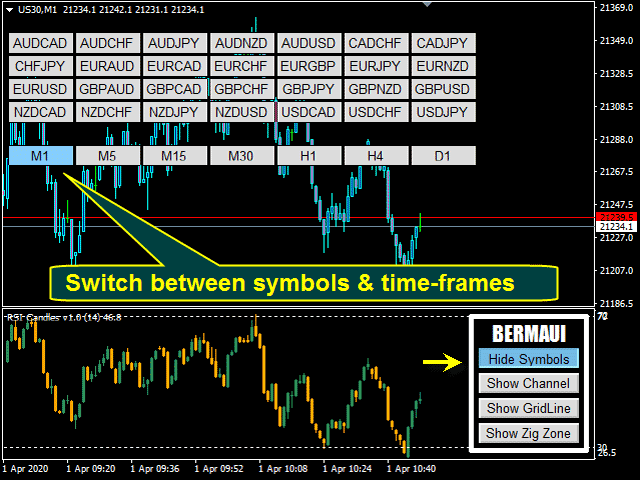
  • Semboller Kaynaktan. Özel Sembol Listesindenveya Piyasaİzleme'den semboller alın.
  • Sembol listesi (";" ile ayrılmış)Özel bir listeden sembol seçerseniz, semboller arasında ";" ile ayırın.
  • Düğme Yazı Tipi Boyutu. Varsayılan on'dur.
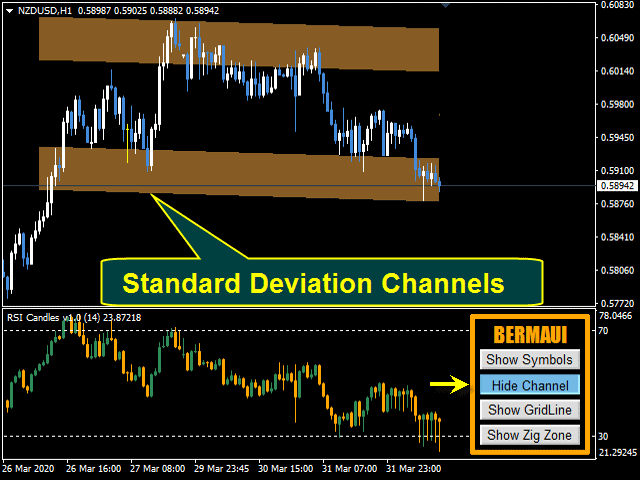
  • Kanal Uzunluğu [> 1]Kanal hesaplamasında kullanılan mum sayısı. Varsayılan değer 100'dür.
  • Panel Görünüyor [Shift + Letter]Panelin görünmesini sağlamak için artı shift tuşuna basılacak harf. Varsayılan "A"
  • Panel Kaybolur [Shift + Letter]Panelin kaybolmasını sağlamak için basılacak harf artı shift. Varsayılan "D"
(4) GÖSTERGE TARZI
  • Tablo Renkleri Listesi:Kullanıcı kendi tablosu için dört farklı renk listesi arasından seçim yapabilir veya kendi listesini kullanmak istiyorsa (Hiçbir Şey Yapma) seçeneğini seçebilir.


Herhangi bir sorunuz varsa lütfen özel mesaj yoluyla bana ulaşın veya yorum bölümüne yazın.
Muhammed Al Bermaui, CMT

İncelemeler 7
pornchai_p
505
pornchai_p 2023.06.04 04:21 
 

This is the best RSI indicator. HIghly recommnended. Please kindly send me the free Stochastic indicator. Thank you.

Hisham Ghoneim
301
Hisham Ghoneim 2022.08.18 10:39 
 

Great work as usual

Suvashish Halder
27087
Suvashish Halder 2022.04.07 05:58 
 

Best RSI indicator in this market and it's a real deal. Thank you for your work ❤

Önerilen ürünler
GeoWprPro
Georgij Komarov
WPR by Profile, or WPR for Professionals Geo_WprPro is one of the well-known currency profile indicators. It simultaneously displays two WPR indicators with different parameters in the matrix form on all timeframes of multiple currency pairs forming the currency profile . As follows from the description, " WPR is a leading indicator that often goes ahead of the price chart. The oscillator frequently reaches extreme values before the price reversal as if anticipating that event: it almost always
The principle of this indicator is very simple: detecting the trend with Moving Average, then monitoring the return point of graph by using the crossing of Stochastic Oscillator and finally predicting BUY and SELL signal with arrows, alerts and notifications. The parameters are fixed and automatically calculated on each time frame. Example: If you install indicator on EURUSD, timeframe M5: the indicator will detect the main trend with the Moving Average on this timeframe (for example the Moving
Binary Options Support Resistance Indicator This indicator is designed for binary options trading and effectively shows retracements from support and resistance levels. Signals appear on the current candle. A red arrow pointing downwards indicates a potential selling opportunity, while a blue arrow pointing upwards suggests buying opportunities. All that needs adjustment is the color of the signal arrows. It is recommended to use it on the M1-M5 timeframes as signals are frequent on these timef
MACD Divergence Finder Indicator will help you to find Divergences between your typical MACD values and the Chart Prices as potential points of actual Trend Reversion or Pull Backs to increase your positions as per the current Trend. Indicator Windows draws MACD value and Divergence arrows but not MACD Signal as it is not considered relevant to detect this kind of Classic Divergences. In some computer/VPS with old microprocessors or low RAM size, when you launch this Indicator (attach it, change
Indicator for binary options arrow is easy to use and does not require configuration works on all currency pairs, cryptocurrencies buy signal blue up arrow sell signal red down arrow tips do not trade during news and 15-30 minutes before their release, as the market is too volatile and there is a lot of noise it is worth entering trades one or two candles from the current period (recommended for 1 candle) timeframe up to m 15 recommended money management fixed lot or fixed percentage of the depo
Owl smart levels
Sergey Ermolov
4.58 (55)
MT5 versiyonu  |  FAQ Owl Smart Levels Indicator ,   Bill Williams'ın gelişmiş fraktalları , piyasanın doğru dalga yapısını oluşturan Valable ZigZag ve kesin giriş seviyelerini gösteren   Fibonacci seviyeleri   gibi popüler piyasa analiz araçlarını içeren tek gösterge içinde eksiksiz bir ticaret sistemidir. pazara ve kar elde edilecek yerlere. Stratejinin ayrıntılı açıklaması Gösterge ile çalışma talimatı Baykuş Yardımcısı ticaretinde Danışman Yardımcısı Kullanıcıların özel sohbeti -> Satın ald
ROYAL DUTCH SKUNK USES THE TREND WAVE INDICATOR AND IT CAN IDENTIFY THE BEGINNING AND THE END OF A NEW WAVE TREND MOVEMENT. AS AN OSCILLATOR, THE INDICATOR IDENTIFIES THE OVERBOUGHT AND OVERSOLD ZONES. IT WORKS GREAT TO CATCH THE SHORT TERM PRICE REVERSALS AND USES A MARTINGALE STRATEGY TO CLOSE ALL TRADES IN PROFIT. USE DEFAULT SETTINGS ON H1 OR HIGHER TIME FRAME ON ANY PAIR FOR MORE ACCURATE TRADES WHY THIS EA : Smart entries calculated by 6 great strategies The EA can be run on even a $20000
VR Cub
Vladimir Pastushak
VR Cub , yüksek kaliteli giriş noktaları elde etmenin bir göstergesidir. Gösterge, matematiksel hesaplamaları kolaylaştırmak ve bir pozisyona giriş noktalarının aranmasını basitleştirmek için geliştirildi. Göstergenin yazıldığı ticaret stratejisi uzun yıllardan beri etkinliğini kanıtlamaktadır. Ticaret stratejisinin basitliği, acemi yatırımcıların bile başarılı bir şekilde ticaret yapmasına olanak tanıyan büyük avantajıdır. VR Cub, pozisyon açılış noktalarını ve Kâr Al ve Zararı Durdur hedef sev
This indicator Master XR indicator.Indicator displays trend movement. Indicator calculates automatically line. Features FiltPer - displays indicator period. deviation - displays indicator deviation. deviation2 - displays indicator deviation. How to understand the status: If (Timeframe M1-H1) FiltPer = 100; If ( Timeframe H4-MN) FiltPer = 5-20; ////////////////////////////////////////////////////////////////////////////////////////////////////////////////////////////////////////////////////// /
Multi Trend Analyzer MT4 indicator provides signals from the following technical trading indicators: RSI, STOCH, STOCHRSI, MACD, ADX, Williams % R, ATR, Oscillator, ROC and Bull/Bear Power. It supports all time frames, from the 1 minute up to the monthly charts. You can change all indicator inputs. Indicator provide total trend summary. We can easily analysis and study market movement .
Trend PA
Mikhail Nazarenko
5 (3)
The Trend PA indicator uses   Price Action   and its own filtering algorithm to determine the trend. This approach helps to accurately determine entry points and the current trend on any timeframe. The indicator uses its own algorithm for analyzing price changes and Price Action. Which gives you the advantage of recognizing, without delay, a new nascent trend with fewer false positives. Trend filtering conditions can be selected in the settings individually for your trading style. The indicator
GG TrendBar Indicator
Biswarup Banerjee
5 (1)
GG TrendBar Indicator - Your Multitimeframe ADX Trading Solution Experience the power of multi-timeframe trading with the "GG TrendBar Indicator." This versatile tool, built upon the ADX indicator, offers precise insights by considering multiple timeframes, ensuring you make well-informed trading decisions. Basic Details : Indicator Type : GG TrendBar Indicator (Multi-Timeframe ADX) Key Metrics : Real-time ADX analysis across multiple timeframes. Customization : Enable or disable specific timefr
Xmaster göstergesinin yeni, daha doğru versiyonu. Dünyanın dört bir yanından 200'den fazla tüccar, en etkili ve doğru formülü elde etmek için bu göstergenin farklı kombinasyonlarının 15.000'den fazla testini bilgisayarlarında gerçekleştirdi. Ve burada size doğru sinyalleri gösteren ve yeniden boyamayan "Xmaster formül göstergesi forex yeniden boyama yok" göstergesini sunuyoruz. Bu gösterge aynı zamanda tüccara e-posta ve push yoluyla sinyaller gönderir. Her yeni tick'in gelmesiyle birlikte, 75'
Forex Indicator HTF Ichimoku for MT4 Ichimoku indicator is   one of the most powerful trend indicators .  H TF means -   H igher Time Frame This indicator is excellent for Trend Traders as well as combination with Price Action entries. HTF Ichimoku  Indicator allows you to attach Ichimoku from Higher time frame to your current chart. Up trend   - red line above blue one (and both lines are above cloud) /   Down trend   - red line below blue one  (and both lines are below cloud) Open BUY orders
Strong Retracement Points Pro demo edition! SRP (Strong Retracement/Reversal Points) is a powerful and unique support and resistance indicator. It displays the closest important levels which we expect the price retracement/reversal! If all level are broken from one side, it recalculates and draws new support and resistance levels, so the levels might be valid for several days depending on the market! If you are still hesitating to start using this wonderful tool, you can check this link to see h
Market Structure Zig Zag
Lesedi Oliver Seilane
4.81 (26)
Free Market structure zig zag to assist in price action trading the screenshots describe how to use and how to spot patterns new version comes with alerts, email alert and  push notification alert can be used on all pairs  can be used on all timeframes  you can add additional confirmation indicators the indicator shows you your higher high and low highs as well as your lower lows and lower highs  the indication makes price action analysis easier to spot.
FREE
В основе индикатора EasyBands лежит тот же принцип, что и при построении Bollinger Band. Однако, данная модификация индикатора использует вместо стандартного отклонения средний торговый диапазон (Average True Range). Соответственно, с данным индикатором абсолютно аналогично можно использовать все стратегии, которые применяются с Bollinger Band. В данной версии индикатора используется двенадцать уровней и средняя линия (белый цвет). Индикация тренда выполнена в виде окраски свечей в зависимости
Deal Trading SPT
Sukunthakan Ngernbamrung
Deal Trading SPT (Super Trend) is an indicator, shows the market trend direction, entry position, take profit level, stop loss level and trend strength. Utility Help to further filter and develop strategy to trade Market overview on the chart Stop loss and take profit calculation with market volatility Resistance and support for trialing stop No repaint after the finished bar Works in any timeframe and financial instrument, including forex, CFD and crypto etc. Message pop-up, notification wi
ADX Pointer is an indicator which is based on "Average Directional Index" and draws three numbers in chart window depending on the value of ADX. In ADX Pointer you can set "ADX_Period" which is of course period of Average Directional Index and you can also set 3 levels. When ADX value exceed first level ("ADX_Level1") in chart window appears number "1", when ADX exceed second level ("ADX_Level2") appears "2" and when ADX exceed third level ("ADX_Level3") appears "3". Simple. ADX Pointer works on
Forex Gump
Andrey Kozak
2.83 (6)
Forex Gump is a fully finished semi-automatic trading system. In the form of arrows, signals are displayed on the screen for opening and closing deals. All you need is to follow the instructions of the indicator. When the indicator shows a blue arrow, you need to open a buy order. When the indicator shows a red arrow, you need to open a sell order. Close orders when the indicator draws a yellow cross. In order to get the most effective result, we recommend using the timeframes H1, H4, D1. There
Apollo Fiyat Hareket Sistemi, tamamen Fiyat Hareketi ilkesine dayalı bir göstergedir. Gösterge, göstergenin stratejisine göre piyasaya giriş koşulları oluştuğu anda alım veya satım sinyali verir. Gösterge, temel bir ticaret sistemi olarak veya kendi ticaret sisteminize ek olarak kullanılabilir. Bu göstergenin kullanımı çok kolaydır. Sadece sinyalleri takip etmeniz gerekiyor. Gösterge, grafikteki trend çizgilerinin yanı sıra pazara giriş noktalarını ve Zarar Durdurma seviyesini gösterir. Kârı sab
The indicator detects and displays Shark harmonic pattern (see the screenshot). The pattern is plotted by the extreme values of the ZigZag indicator (included in the resources, no need to install). After detecting the pattern, the indicator notifies of that by a pop-up window, a mobile notification and an email. The indicator highlights the process of the pattern formation and not just the complete pattern. In the former case, it is displayed in the contour triangles. After the pattern is comple
Noize Absorption Index MT4
Ekaterina Saltykova
5 (1)
Noize Absorption Index - is the manual trading system that measures the difference of pressure between bears forces and bulls forces. Green line - is a noize free index that showing curent situation. Zero value of index shows totally choppy/flat market.Values above zero level shows how powerfull bullish wave is and values below zero measures bearish forces.Up arrow appears on bearish market when it's ready to reverse, dn arrow appears on weak bullish market, as a result of reverse expectation. S
ZhiBiCCI MT4
Qiuyang Zheng
5 (1)
[ZhiBiCCI] indicators are suitable for all cycle use, and are also suitable for all market varieties. [ZhiBiCCI] Green solid line is a reversal of bullish divergence. The green dotted line is a classic bullish divergence. [ZhiBiCCI] The solid line to the red is a reverse bearish divergence. The red dotted line is a classical bearish divergence. [ZhiBiCCI] can be set in the parameters (Alert, Send mail, Send notification), set to (true) to send instant signals to the alarm window, email, in
The Four Moving Averages Message indicator ( please see the description and video ), a version of Four Moving Averages , concurrently displays four Moving Averages with default settings in the main chart window: Green and Red ones represent a short-term trend, Red and Blue ones - mid-term trend, while Blue and Yellow ones - long-term trend. You can change the moving average settings and colors. However, these parameters have been configured so that to allow trading on all time frames. The built-
Rainbow Ribbon - Rainbow MA bands - Useful for spotting trend changes - Useful for spotting trend slopes - Useful for spotting trend acceleration - Ability to choose ribbon colors, moving averages, and distances - Provides colorful rainbow ribbons to show an array of moving averages Rainbow Ribbon is an extremely useful indicator, it has been designed to make it easy to spot the trend and also changes within the trend before they occur. It can be used many different ways and provides the abil
The Penta-O is a 6-point retracement harmonacci pattern which usually precedes big market movements. Penta-O patterns can expand and repaint quite a bit. To make things easier this indicator implements a twist: it waits for a donchian breakout in the right direction before signaling the trade. The end result is an otherwise repainting indicator with a very reliable trading signal. The donchian breakout period is entered as an input. [ Installation Guide | Update Guide | Troubleshooting | FAQ | A
The Vortex Indicator was inspired by the work of an Austrian inventor, Viktor Schauberger, who studied the flow of water in rivers and turbines. Etienne Botes and Douglas Siepman developed the idea that movements and flows within financial markets are similar to the vortex motions found in water. The Vortex Indicator was also partly inspired by J. Welles Wilder's concept of directional movement, which assumes the relationship between price bars gives clues as to the direction of a market. This i
Scalping Modulator is a scalping trading system. The indicator consists of several analytical modules. It automatically analyzes the market and shows the trader all the necessary information for trading. Scalping Modulator draws two trend lines on the chart. One line shows the long-term direction of the price, the second line shows the medium-term direction of the price. The indicator also draws red and blue dots on the chart. They indicate a likely change in price movement. In order to open a
Trend Flasher Trend is your friend is the age old saying quote in trading arena, there are though many ways to gauge the trend and its direction, more scientific measure and logically meaningful will be an ATR break outs to identify and spot the trend and its acceleration, so we created this easy to use trend identification panel and optimized super trend based multi time frame panel entry system to aid and help the traders to make their trading decision. Unique Features of Trend Flasher 1
Bu ürünün alıcıları ayrıca şunları da satın alıyor
Gann Made Easy
Oleg Rodin
4.88 (100)
Gann Made Easy , bay teorisini kullanarak ticaretin en iyi ilkelerine dayanan, profesyonel ve kullanımı kolay bir Forex ticaret sistemidir. WD Gann. Gösterge, Zararı Durdur ve Kâr Al Seviyeleri dahil olmak üzere doğru SATIN AL ve SAT sinyalleri sağlar. PUSH bildirimlerini kullanarak hareket halindeyken bile işlem yapabilirsiniz. Lütfen satın aldıktan sonra benimle iletişime geçin! Alım satım ipuçlarımı ve harika bonus göstergelerini ücretsiz olarak sizinle paylaşacağım! Muhtemelen Gann ticaret y
Trend Punch
Mohamed Hassan
4.92 (24)
This indicator is unstoppable when combined with our other indicator called  Support & Resistance . After purchase, send us a message and you will get it   for  FREE as a BONUS! Introducing Trend Punch , the revolutionary forex trend indicator that will transform the way you trade! Trend Punch is uniquely designed to provide precise buy and sell arrows during strong market trends, making your trading decisions clearer and more confident. Whether you're trading major currency pairs or exotic sym
Gold Stuff
Vasiliy Strukov
4.9 (270)
Gold Stuff, özellikle altın için tasarlanmış bir trend göstergesidir ve herhangi bir finansal enstrümanda da kullanılabilir. Gösterge yeniden çizilmez ve gecikmez. Önerilen zaman dilimi H1. Bu göstergede tam otomatik Uzman Danışman EA Gold Stuff çalışır. Profilimde bulabilirsiniz. Ayarları ve kişisel bir bonusu almak için satın alma işleminden hemen sonra benimle iletişime geçin!  Güçlü Destek ve Trend Tarayıcı göstergemizin ücretsiz bir kopyasını pm'den alabilirsiniz. Ben! AYARLAR Ok Ç
FX Power MT4 NG
Daniel Stein
5 (13)
Sabah Brifingimiz burada mql5 ve on Telegram! FX Power MT4 NG , uzun zamandır çok popüler olan döviz gücü ölçerimiz FX Power'ın yeni neslidir. Peki bu yeni nesil güç ölçer ne sunuyor? Orijinal FX Power hakkında sevdiğiniz her şey PLUS GOLD/XAU güç analizi Daha da hassas hesaplama sonuçları Ayrı ayrı yapılandırılabilir analiz dönemleri Daha da iyi performans için özelleştirilebilir hesaplama limiti Özel çokluDaha fazlasını görmek isteyenler için örnek ayarlar Her grafikte en sevdiğiniz renkler i
ÜRÜNÜ SATIN ALMADAN ÖNCE LÜTFEN AŞAĞIDAKİ BİLGİLERİ OKUYUNUZ! Apollo Pips PLUS SP benzersiz bir üründür! YENİ "APOLLO PIPS" GÖSTERGEMİ ARTI TÜM İŞLEM GÖSTERGELERİME ERİŞİM İLE "SÜPER PAKET" BONUSUNU ALMAK İSTEYENLER İÇİN! Apollo Pips PLUS SP ürününü satın alarak aslında Apollo Pips göstergemin tamamen yeni bir versiyonunu satın almış oluyorsunuz. Göstergenin bu sürümü, geliştirilmiş bir algoritmaya ve kullanımı kolay bir parametreye sahiptir; bu, size göstergeyi herhangi bir piyasada ve herhangi
TPSproTREND PrO
Roman Podpora
4.79 (19)
TPSpro TREND PRO,   piyasayı otomatik olarak analiz eden, trend ve değişimlerinin her biri hakkında bilgi sağlayan, ayrıca yeniden çizmeden işlemlere girme sinyalleri veren bir trend göstergesidir! Gösterge her mumu ayrı ayrı analiz ederek kullanır. farklı dürtülere atıfta bulunur - yukarı veya aşağı dürtü. Para birimleri, kripto paralar, metaller, hisse senetleri ve endeksler için işlemlere tam giriş noktaları! Sürüm MT5                   GÖSTERGENİN TAM AÇIKLAMASI       Bunu -   RFI SEVİYELER
Trend Pulse
Mohamed Hassan
5 (5)
Please contact me after purchase to immediately get your PDF strategy + documentation for Trend Pulse !  Official release price of $89  (2 /50 copies left). Next price is $199 . Introducing Trend Pulse , a unique and robust indicator capable of detecting bullish, bearish, and even ranging trends! Trend Pulse uses a special algorithm to filter out market noise with real precision. If the current symbol is moving sideways, Trend Pulse will send you a ranging signal, letting you know that it'
Scalper Inside PRO
Alexey Minkov
4.75 (60)
An exclusive indicator that utilizes an innovative algorithm to swiftly and accurately determine the market trend. The indicator automatically calculates opening, closing, and profit levels, providing detailed trading statistics. With these features, you can choose the most appropriate trading instrument for the current market conditions. Additionally, you can easily integrate your own arrow indicators into Scalper Inside Pro to quickly evaluate their statistics and profitability. Scalper Inside
Atomic Analyst
Issam Kassas
5 (3)
Öncelikle belirtmek gerekir ki bu Ticaret Göstergesi Yeniden Çizim Yapmaz, Gecikmez ve Gecikme Göstermez, bu da hem manuel hem de robot ticareti için ideal hale getirir. Kullanıcı kılavuzu: ayarlar, girişler ve strateji. Atom Analisti, Piyasada Daha İyi Bir Avantaj Bulmak İçin Fiyatın Gücünü ve Momentumunu Kullanan PA Fiyat Hareketi Göstergesidir. Gürültüleri ve Yanlış Sinyalleri Kaldırmaya ve Ticaret Potansiyelini Artırmaya Yardımcı Olan Gelişmiş Filtrelerle Donatılmıştır. Birden fazla katma
Trend Screener
STE S.S.COMPANY
4.82 (92)
Trend Göstergesi, Trend Alım Satım ve Filtreleme için Çığır Açan Benzersiz Çözüm, Tüm Önemli Trend Özellikleriyle Tek Bir Araç İçinde Yerleştirildi! Forex, emtialar, kripto para birimleri, endeksler ve hisse senetleri gibi tüm sembollerde/araçlarda kullanılabilen %100 yeniden boyamayan çoklu zaman çerçevesi ve Çoklu para birimi göstergesidir. Trend Screener, grafikte noktalarla ok trend sinyalleri sağlayan etkili bir trend trend göstergesidir. Trend analizörü göstergesinde bulunan özellikler: 1.
Currency Strength Wizard , başarılı ticaret için size hepsi bir arada çözüm sağlayan çok güçlü bir göstergedir. Gösterge, birden çok zaman dilimindeki tüm para birimlerinin verilerini kullanarak şu veya bu forex çiftinin gücünü hesaplar. Bu veriler, şu veya bu para biriminin gücünü görmek için kullanabileceğiniz, kullanımı kolay para birimi endeksi ve para birimi güç hatları biçiminde temsil edilir. İhtiyacınız olan tek şey, işlem yapmak istediğiniz tabloya göstergeyi eklemektir ve gösterge size
- Real price is 80$ - 40% Discount ( It is 49$ now ) Contact me for instruction, any questions! Introduction The breakout and retest strategy is traded support and resistance levels. it involves price breaking through a previous level.  The break and retest strategy is designed to help traders do two main things, the first is to avoid false breakouts. Many false breakouts start with a candlestick that breaks out of a level but ends with an immediate candlestick that brings the price back into t
Şu anda %20 İNDİRİMLİ! Herhangi bir Acemi veya Uzman Tüccar için En İyi Çözüm! Bu gösterge paneli yazılımı 28 döviz çifti üzerinde çalışıyor. Ana göstergelerimizden 2'sine (Gelişmiş Para Birimi Gücü 28 ve Gelişmiş Para Birimi Dürtüsü) dayanmaktadır. Tüm Forex piyasasına harika bir genel bakış sağlar. Gelişmiş Para Birimi Gücü değerlerini, para birimi hareket hızını ve tüm (9) zaman dilimlerinde 28 Forex çifti için sinyalleri gösterir. Trendleri ve / veya scalping fırsatlarını belirlemek içi
Clear Breakout
Martin Alejandro Bamonte
5 (1)
"Breakout Buy-Sell" göstergesi, farklı piyasa seansları (Tokyo, Londra ve New York) sırasında fiyat kırılmalarına dayalı olarak potansiyel alım ve satım fırsatlarını belirlemek ve vurgulamak için tasarlanmıştır. Bu gösterge, traderların alım ve satım bölgelerini, ayrıca kâr alma (TP) ve zarar durdurma (SL) seviyelerini net bir şekilde görselleştirmelerine yardımcı olur. Kullanım Stratejisi Gösterge şu şekilde kullanılabilir: İlk Kurulum : Piyasa seansını seçin ve GMT farkını ayarlayın. Piyasa Gö
ŞU ANDA %26 INDIRIMLI Yeni Başlayanlar veya Uzman Tüccarlar için En İyi Çözüm! Bu Gösterge benzersiz, yüksek kaliteli ve uygun fiyatlı bir ticaret aracıdır çünkü bir dizi tescilli özellik ve yeni bir formül ekledik. Sadece BİR grafik ile 28 Forex çifti için Döviz Gücünü okuyabilirsiniz! Yeni bir trendin veya scalping fırsatının tam tetik noktasını belirleyebildiğiniz için ticaretinizin nasıl gelişeceğini hayal edin? Kullanım kılavuzu: buraya tıklayın Bu ilk olan, orijinal! Değersiz bir
PRO Renko Sistemi, RENKO grafikleri ticareti için özel olarak tasarlanmış son derece hassas bir ticaret sistemidir. Bu, çeşitli ticaret araçlarına uygulanabilen evrensel bir sistemdir. Sistemi etkin piyasa sana doğru ters sinyallerine erişim hakkı denilen ses nötralize eder. Göstergenin kullanımı çok kolaydır ve sinyal üretiminden sorumlu tek bir parametreye sahiptir. Aracı, seçtiğiniz herhangi bir ticaret aracına ve renko çubuğunun boyutuna kolayca uyarlayabilirsiniz. Yazılımımla karlı b
Gold Channel is a volatility-based indicator, developed with a specific timing algorithm for the XAUUSD pair, which consists of finding possible corrections in the market. This indicator shows two outer lines, an inner line (retracement line) and an arrow sign, where the theory of the channel is to help identify overbought and oversold conditions in the market. The market price will generally fall between the boundaries of the channel. If prices touch or move outside the channel it is a tra
Öncelikle, bu Ticaret Aracının Non-Repainting, Non-Redrawing ve Non-Lagging Gösterge olduğunu vurgulamakta fayda var, bu da onu profesyonel ticaret için ideal hale getiriyor. Çevrimiçi kurs, kullanıcı kılavuzu ve demo. Akıllı Fiyat Hareketi Kavramları Göstergesi, hem yeni hem de deneyimli tüccarlar için çok güçlü bir araçtır. İleri ticaret fikirlerini, Inner Circle Trader Analizi ve Smart Money Concepts Ticaret Stratejileri gibi 20'den fazla kullanışlı göstergeyi bir araya getirerek bir araya g
ŞU ANDA %31 INDIRIMLI !!! Yeni Başlayanlar veya Uzman Tüccarlar için En İyi Çözüm! Bu gösterge benzersiz, yüksek kaliteli ve uygun fiyatlı bir ticaret aracıdır çünkü bir dizi tescilli özellik ve gizli bir formül ekledik. Yalnızca BİR grafikle 28 döviz çiftinin tümü için Uyarılar verir. Yeni bir trendin veya scalping fırsatının tam tetik noktasını belirleyebildiğiniz için ticaretinizin nasıl gelişeceğini hayal edin! Yeni temel algoritmalar üzerine inşa edilen bu sistem, potansiyel işlemler
NAM Order Blocks
NAM TECH GROUP, CORP.
5 (1)
MT4 Multi-timeframe Order Blocks detection indicator. Features - Fully customizable on chart control panel, provides complete interaction. - Hide and show control panel wherever you want. - Detect OBs on multiple timeframes. - Select OBs quantity to display. - Different OBs user interface. - Different filters on OBs. - OB proximity alert. - ADR High and Low lines. - Notification service (Screen alerts | Push notifications). Summary Order block is a market behavior that indicates order collection
RelicusRoad Pro
Relicus LLC
4.73 (141)
Şimdi 147 $ (birkaç güncellemeden sonra 499 $ 'a yükseliyor) - Sınırsız Hesaplar (PC'ler veya Mac'ler) RelicusRoad Kullanım Kılavuzu + Eğitim Videoları + Özel Discord Grubuna Erişim + VIP Durumu PİYASAYA BAKMAK İÇİN YENİ BİR YOL RelicusRoad, forex, vadeli işlemler, kripto para birimleri, hisse senetleri ve endeksler için dünyanın en güçlü ticaret göstergesidir ve yatırımcılara kârlı kalmaları için ihtiyaç duydukları tüm bilgileri ve araçları sağlar. Başlangıç ​​seviyesinden ileri seviyey
PZ Trend Trading
PZ TRADING SLU
4.8 (5)
Capture every opportunity: your go-to indicator for profitable trend trading Special Offer: Purchase now to receive free bonuses worth $159! (Read more for details) Trend Trading is an indicator designed to profit as much as possible from trends taking place in the market, by timing pullbacks and breakouts. It finds trading opportunities by analyzing what the price is doing during established trends. [ Installation Guide | Update Guide | Troubleshooting | FAQ | All Products ] Trade financial
TPSpro RFI Levels
Roman Podpora
4.83 (24)
Reversal First Impulse levels (RFI)    INSTRUCTIONS        RUS       -       ENG              R ecommended to use with an indicator   -   TPSpro  TREND PRO -  Version MT5 A key element in trading is zones or levels from which decisions to buy or sell a trading instrument are made. Despite attempts by major players to conceal their presence in the market, they inevitably leave traces. Our task was to learn how to identify these traces and interpret them correctly. Main functions: Displaying activ
Break and Retest
Mohamed Hassan
4.17 (18)
This Indicator only places quality trades when the market is really in your favor with a clear break and retest. Patience is key with this price action strategy! If you want more alert signals per day, you increase the number next to the parameter called: Support & Resistance Sensitivity.  After many months of hard work and dedication, we are extremely proud to present you our  Break and Retest price action indicator created from scratch. One of the most complex indicators that we made with ove
Order Block Hunter
Noha Mohamed Fathy Younes Badr
5 (2)
Order block hunter indicator is the best indicator for  hunt the order blocks that area where there has been a large concentration of limit orders waiting to be executed Order blocks are identified on a chart by observing previous price action and looking for areas where the price experienced significant movement or sudden changes in direction .This indicator does that for you by using very complicated codes and helps you to take the best areas To buy and sell because it make marks at the best a
Scalper Vault
Oleg Rodin
5 (29)
Scalper Vault , başarılı bir scalping için ihtiyacınız olan her şeyi size sağlayan profesyonel bir scalping sistemidir. Bu gösterge, forex ve ikili opsiyon tüccarları tarafından kullanılabilecek eksiksiz bir ticaret sistemidir. Önerilen zaman çerçevesi M5'tir. Sistem size trend yönünde doğru ok sinyalleri sağlar. Ayrıca size üst ve alt sinyaller ve Gann piyasa seviyeleri sağlar. Göstergeler, PUSH bildirimleri dahil her türlü uyarıyı sağlar. Göstergeyi satın aldıktan sonra lütfen benimle iletişim
IX Power MT4
Daniel Stein
5 (6)
IX Power nihayet FX Power'ın rakipsiz hassasiyetini Forex dışı sembollere getiriyor. En sevdiğiniz endeksler, hisse senetleri, emtialar, ETF'ler ve hatta kripto para birimlerindeki kısa, orta ve uzun vadeli eğilimlerin yoğunluğunu doğru bir şekilde belirler. Terminalinizin sunduğu her şeyi analiz edebilirsiniz. Deneyin ve işlem yaparken zamanlamanızın nasıl önemli ölçüde iyileştiğini deneyimleyin. IX Power Temel Özellikler 100 hassas, yeniden boyanmayan hesaplama sonuçları - terminalini
M1 Arrow
Oleg Rodin
4.73 (15)
Piyasanın iki temel ilkesine dayanan bir gün içi stratejisi. Algoritma, ek filtreler kullanarak hacimlerin ve fiyat dalgalarının analizine dayanmaktadır. Göstergenin akıllı algoritması, yalnızca iki piyasa faktörü bir araya geldiğinde bir sinyal verir. Gösterge, daha yüksek zaman çerçevesinin verilerini kullanarak M1 grafiğinde belirli bir aralıktaki dalgaları hesaplar. Ve dalgayı doğrulamak için gösterge, hacme göre analizi kullanır. Bu gösterge hazır bir ticaret sistemidir. Bir tüccarın ihtiya
Backtest and Read Overview before purchase. Chart patterns have been a topic of debate among traders; some believe they are reliable signalers, while others do not. Our Chart Patterns All-in-One indicator displays various chart patterns to help you test these theories for yourself. The profitability of these patterns is not a reflection of the indicator's effectiveness but rather an evaluation of the patterns themselves. The Chart Patterns All-in-One indicator is an excellent tool for visualizin
Advanced Supply Demand
Bernhard Schweigert
4.9 (314)
CURRENTLY 26% OFF !! Best Solution for any Newbie or Expert Trader! This indicator is a unique, high quality and affordable trading tool because we have incorporated a number of proprietary features and a new formula. With this update, you will be able to show double timeframe zones. You will not only be able to show a higher TF but to show both, the chart TF, PLUS the higher TF: SHOWING NESTED ZONES. All Supply Demand traders will love it. :) Important Information Revealed Maximize the potenti
Yazarın diğer ürünleri
MASR Bands
Muhammad Elbermawi
4.64 (11)
Ya da E Oving bir verage S upport R esistance Gruplar. MASR Bantları göstergesi, destek ve direnç seviyeleri olarak birlikte çalışan iki bantla çevrili hareketli bir ortalamadır. İstatistiksel olarak, MASR Bantları zamanın %93'ünde fiyat mumları içerir. Adımlarda şu şekilde hesaplanır: 1. İlk adım, bir X dönemi için en yüksek yüksek (HHV) ve en düşük düşük (LLV) hesaplamaktır. 2. İkinci adım, aralarındaki mesafenin yüzde olarak ne kadar geniş olduğunu bulmak için HHV'yi LLV'ye bölmektir.
Bermaui Manual EA
Muhammad Elbermawi
5 (12)
Bu, ızgara sistemi ticareti yapan yarı otomatik bir uzman danışmandır. Buradaki fikir, piyasada kademeli olarak farklı pozisyonlar almak ve daha sonra onlar için başa baş seviyesini hesaplamaktır. Fiyatlar bu başabaş noktasını önceden belirlenmiş bir mesafe kadar aştığında, açılan tüm emirler kapanır. Önemli bilgi İşte kullanıcı kılavuzu:   https://www.mql5.com/en/blogs/post/730567 Bu EA'yı diğer ürünlerimden herhangi biriyle burada deneyebilirsiniz: https://www.mql5.com/en/users/bermaui314/
True Direction Oscillator
Muhammad Elbermawi
4.89 (494)
Veya "Saf Momentum " ilkesini kullanarak fiyat değişim oranını ölçen bir endeks olan (TDO). Bir menkul kıymet fiyatı 10'dan 15'e yükseldiğinde, fiyat değişim oranı %150'dir, ancak 15'ten 10'a düştüğünde, fiyat değişim oranı sadece %33.3'tür. Bu nedenle, "Fiyat Değişim Oranı" (ROC) veya "Momentum" gibi teknik analiz göstergeleri, artan fiyat hareketleri için azalan hareketlere göre daha yüksek değerler verir. TDO, yatırımcıların momentumu doğru okumalarına yardımcı olmak için bu sorunu düzeltir
Bermaui Bands
Muhammad Elbermawi
4.94 (90)
Bermaui Bantları (BB), değişen ve trend olan fiyat hareketleri arasında filtrelemeye yardımcı olan bir teknik analiz aracıdır. Bu göstergenin arkasındaki fikir, sonraki adımlarda açıklanabilir: 0 ile 100 arasında hareket eden bir osilatör olarak Standart Sapmayı hesaplayın. Ben buna Bermaui Sapma yüzdesi (BD %) adını vereceğim. "BD %" sıfıra yakınsa, oynaklık en uç noktadadır. Ayrıca "BD %" 100'e yakınsa oynaklık çok düşüktür. Yüksek oynaklık, trend olan bir piyasa için büyük bir olasılık anlamı
Bermaui Deviation Percent
Muhammad Elbermawi
4.94 (130)
Veya oynaklığı puan yerine yüzde olarak ölçen bir oynaklık endeksi olan ( BD% ). BD% fikri, yüzde 0 ile 100 arasında hareket eden Klasik Standart Sapma'ya (CSD) bağlı bir endeks yapmaktır. Farklı zaman dilimlerinde veya farklı zaman dilimlerinde aynı güvenlik için oynaklığı karşılaştırmak için BD%'yi kullanabilirsiniz. Ayrıca, farklı piyasalardaki farklı menkul kıymetler arasındaki oynaklığı puan yerine yüzde cinsinden karşılaştırmak için BD%'yi kullanabilirsiniz. "BD%" NASIL KULLANILIR
Bermaui Pin Bars
Muhammad Elbermawi
5 (22)
Bermaui Pim Çubukları Veya (BPB), grafikte Pin Bar fiyat hareket modelini bulan bir göstergedir. Pin Barlar, Hammer, Inverted-Hammer, Hanging Man, Shooting Star, Dragon Fly Doji veya Grave Stone Doji gibi uzun üst veya alt gölgeli ve çok küçük gövdeli Japon şamdanlarına alternatif olan klasik bir çubuk deseni olan "Pinokyo Çubukları" için bir kısayoldur. . Bermaui Pin Bars göstergesi, sonraki adımlarda açıklanabilecek bir formüle bağlı olarak bu kalıbı bulur: İlk BPB'de mum gövdesinin merkez
BACD Cloud
Muhammad Elbermawi
4.57 (7)
Ya da yüzde olarak göstermektedir eğilim yönü ve önlemler gücünü olduğu bir osilatördür B ermaui bir verage Cı onvergence D ivergence bulut. BACD Bulut hesaplaması aşağıdaki gibidir: 1- İki üstel hareketli ortalamayı hesaplayın. Bunlardan biri diğerinden daha hızlıdır. İlkini (Hızlı) ve ikincisini (Yavaş) arayacağım 2- Aralarındaki merkezi bulun, burada: Merkez MA = (Hızlı + Yavaş) / 2 3- BACD Çizgisini aşağıdaki gibi hesaplayın: BACD = 100 * (Hızlı / Merkez MA) 4- BACD'nin üstel hareke
Classic Keltner Channel
Muhammad Elbermawi
4.9 (40)
Veya CKC. Bu gösterge, Chester W. Keltner (1909–1998) tarafından tanımlanan klasik on günlük hareketli ortalama kuralına bağlı olarak çalışır. Tüm parametreler varsayılan olarak Keltner sisteminin klasik versiyonuna ayarlanmıştır, kullanıcı isterse bunları değiştirebilir. Önemli bilgi CKC Kılavuzunu okuyun: https://www.mql5.com/en/blogs/post/736577 CKC Uzman Danışman Örneği: https://www.mql5.com/en/blogs/post/734150 Keltner Kanal Formülü Hakkında 1. Merkez Çizgiyi, Tipik Fiyattan (= (Yüks
Or DBD%. The indicator consists of colored tape that shows trading signals depending on two Bermaui Deviation Oscillator (BD%) and two moving averages. Bermaui Deviation Percent is a volatility index that measures volatility in percent rather than points. The idea of BD% is to make an index depending on Classic Standard Deviation (CSD) that moves between 0 and 100 percent. Important Information DBD% expert advisor example:  https://www.mql5.com/en/blogs/post/731145 If you want to know mor
Bermaui Channel
Muhammad Elbermawi
5 (27)
This is a price channel that shows five important price levels on the chart. Those levels are: 1. The Highest High (HH) of the previous x bars. 2. The Highest Low (HL) of the previous x bars. 3. The Center Line. 4. The Lowest High (LH) of the previous x bars. 5. The Lowest Low (LL) of the previous x bars. How does Bermaui Channels Captures Overbought  area Think of the distance between HH and HL levels as an overbought area. When the price candles or bars crosses the HL to the upside this
Moving Average Cloud
Muhammad Elbermawi
4.93 (14)
Veya "MAC". Bu, trendi yakalamanıza ve takas etmenize yardımcı olmak için tasarlanmış bir göstergedir. Bu göstergenin arkasındaki fikir, sonraki adımlarda açıklanabilir: Hızlı hareket eden bir ortalama Zarf çizin. Yavaş hareket eden bir ortalama Zarf çizin. MAC Üst Bandı, her iki Zarfın en yükseği arasındaki en yüksek değerdir. MAC Alt Bandı, her iki Zarfın alt kısmı arasındaki en düşük değerdir. MAC Histogram Bulutu, yön değişikliğinizi göstermek için iki bant arasındaki mesafeyi doldurur. M
Horus EA
Muhammad Elbermawi
3.67 (3)
MT4 için Horus EA Binlerce yıl önce, eski Mısırlılar topraklarını ölçmek ve mallarını tartmak için kullandıkları bir sayma sistemi icat ettiler. Bu sistem " Horus'un Gözü " olarak biliniyordu. Horus'un Gözü, tanrı Osiris efsanesiyle ilişkilendirildi ve firavunların kutsal sembollerinden biri oldu. Ünlü "Martingale Sistemi"nden %89 daha güvenli olan negatif ilerlemeli bir para yönetim sistemi oluşturmak için Horus'un Gözü'ndeki Fibonacci dizisiyle matematiksel denklemleri kullandım. EA'nın te
Filtrele:
pornchai_p
505
pornchai_p 2023.06.04 04:21 
 

This is the best RSI indicator. HIghly recommnended. Please kindly send me the free Stochastic indicator. Thank you.

Hisham Ghoneim
301
Hisham Ghoneim 2022.08.18 10:39 
 

Great work as usual

Suvashish Halder
27087
Suvashish Halder 2022.04.07 05:58 
 

Best RSI indicator in this market and it's a real deal. Thank you for your work ❤

Muhammad Elbermawi
52385
Geliştiriciden yanıt Muhammad Elbermawi 2022.04.07 08:20
You are welcome. Suvashish 🙏
faithdefender
1726
faithdefender 2022.02.12 21:05 
 

This man is just plain honest! I own three of his indicators and I cant complain. Bermaui Bands, TDO and now RSI Candles. I may not be making money, but the indicators do what he says they would do. And the price is fair especially in the light of 1000 activations compared to many of the sleazy Vendors who only give 5. And then they (other Vendors) turn around and lie to you saying "we are following the rules set by MQL and are prohibited from giving more than 5. Apparently, Mr. Elbimawri didnt get the memo. Nevertheless, why the lengthy review? I just purchased a different RSI indicator (because it was 10 bucks cheaper) and I have nothing but regrets. It is called "RSI As Bar". I sent the complaint to the Vendor the first hour, , but he never responded. Not only that, but he has pulled his indicator. If I go to the page, I now have a note that says "Unfortunately, "RSI as Bar" is unavailable." He will probably repackage it with a new name and sell it again to the public. Why? Because he can do it and get away with it since there is no accountability on this platform. MQL loves the vendors because it brings people to this venue, but to think of the people who have been ripped off! I hope Mr Elbermawi continues to come up with new ideas. And thank you for your honesty in value and indicators.

Muhammad Elbermawi
52385
Geliştiriciden yanıt Muhammad Elbermawi 2022.02.13 12:27
Thanks a lot for all the great words 🙏
cvdestyfx
2702
cvdestyfx 2021.03.09 17:33 
 

The best RSI indicator!

Muhammad Elbermawi
52385
Geliştiriciden yanıt Muhammad Elbermawi 2021.03.10 12:09
Thanks a lot, cvdestyfx 🤗
Livio Yves Chathuant
883
Livio Yves Chathuant 2020.12.26 04:44 
 

Hi really happy with my purchase this indicator reveals to us and confirms the future price movements, I have this very complete tool for swing trading.thank you M. Muhammad

Baboloki Mathabe
604
Baboloki Mathabe 2020.10.31 14:31 
 

Author Mr Albermawi provides quality products this is an addition to the other tools got from him

Muhammad Elbermawi
52385
Geliştiriciden yanıt Muhammad Elbermawi 2020.10.31 18:14
Thanks a lot, Baboloki Mathabe 🤗
İncelemeye yanıt