Trend Screener Pro MT5
- Göstergeler
- STE S.S.COMPANY
- Sürüm: 21.10
- Güncellendi: 3 Haziran 2024
- Etkinleştirmeler: 10
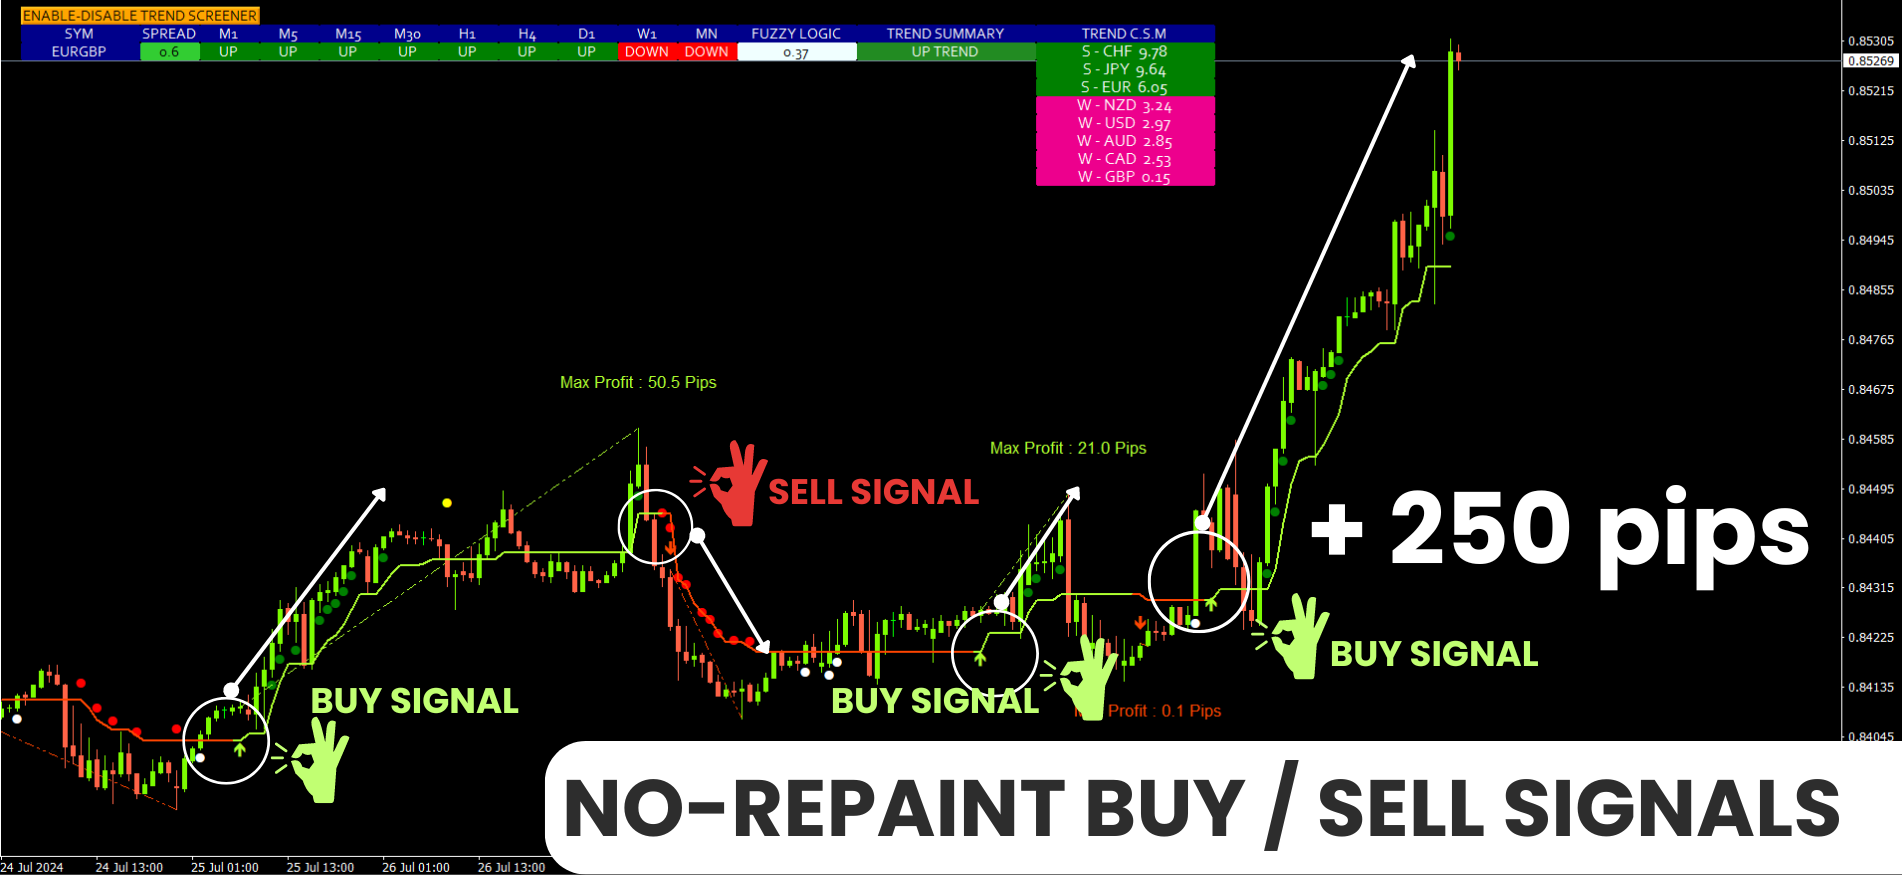
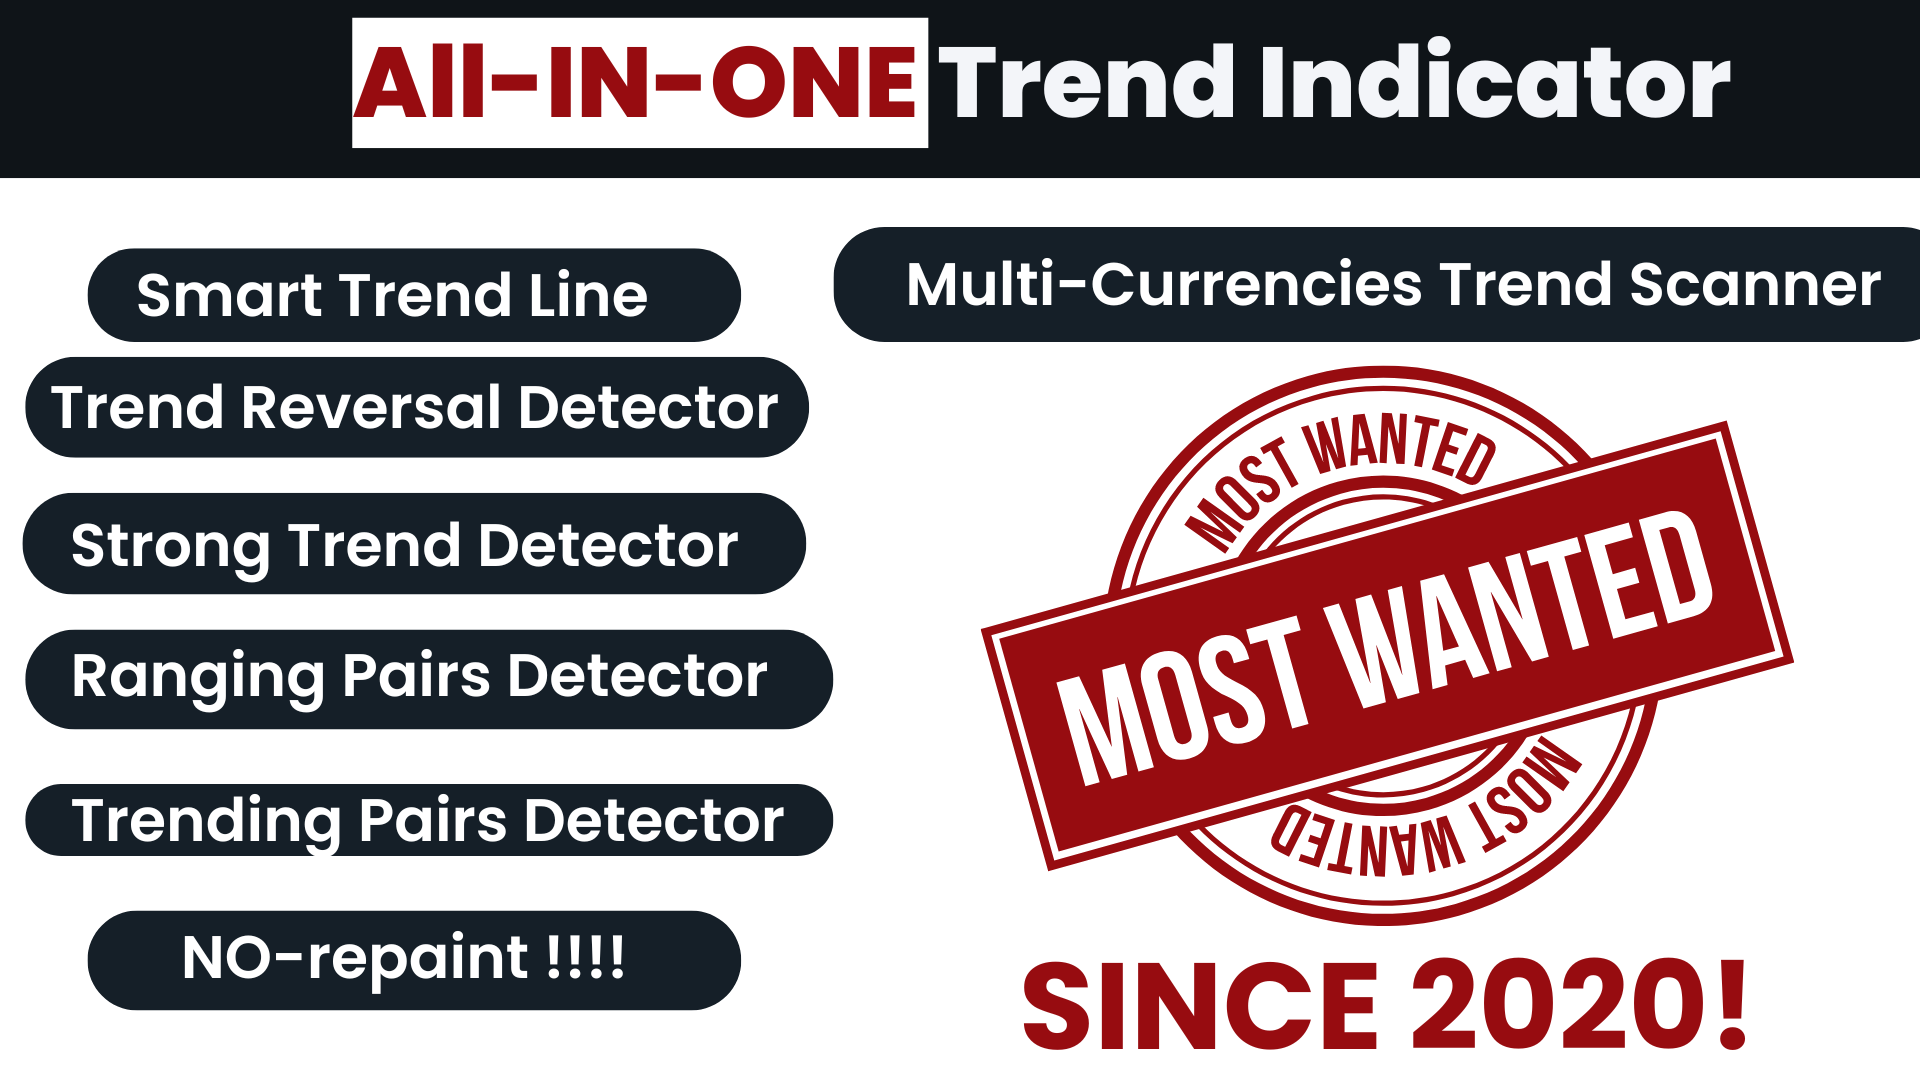
Trend Göstergesi, Trend Alım Satım ve Filtreleme için Çığır Açan Benzersiz Çözüm, Tüm Önemli Trend Özellikleriyle Tek Bir Araç İçinde Yerleştirildi! Forex, emtialar, kripto para birimleri, endeksler ve hisse senetleri gibi tüm sembollerde/araçlarda kullanılabilen %100 yeniden boyamayan çoklu zaman çerçevesi ve Çoklu para birimi göstergesidir.
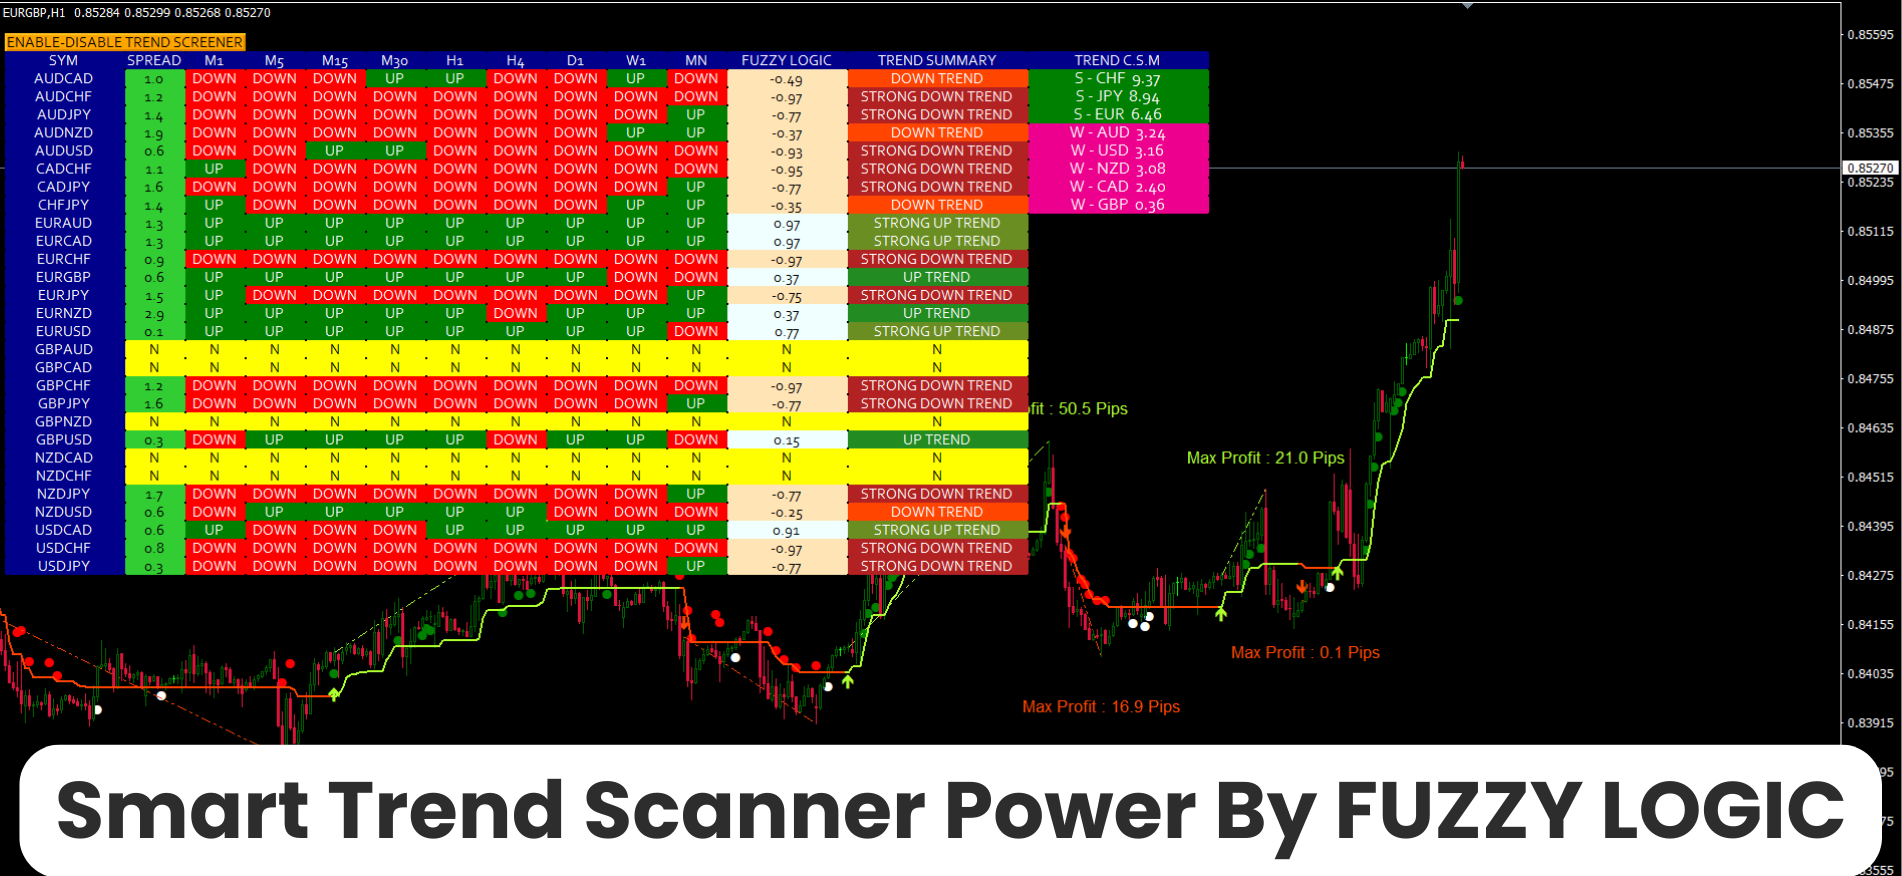
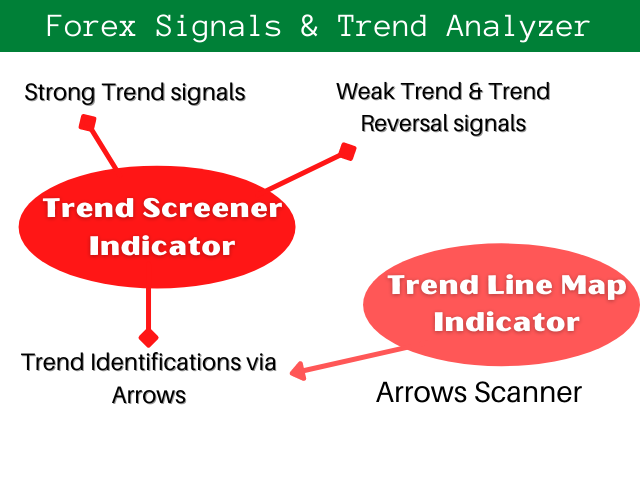
Trend Screener, grafikte noktalarla ok trend sinyalleri sağlayan etkili bir trend trend göstergesidir. Trend analizörü göstergesinde bulunan özellikler:
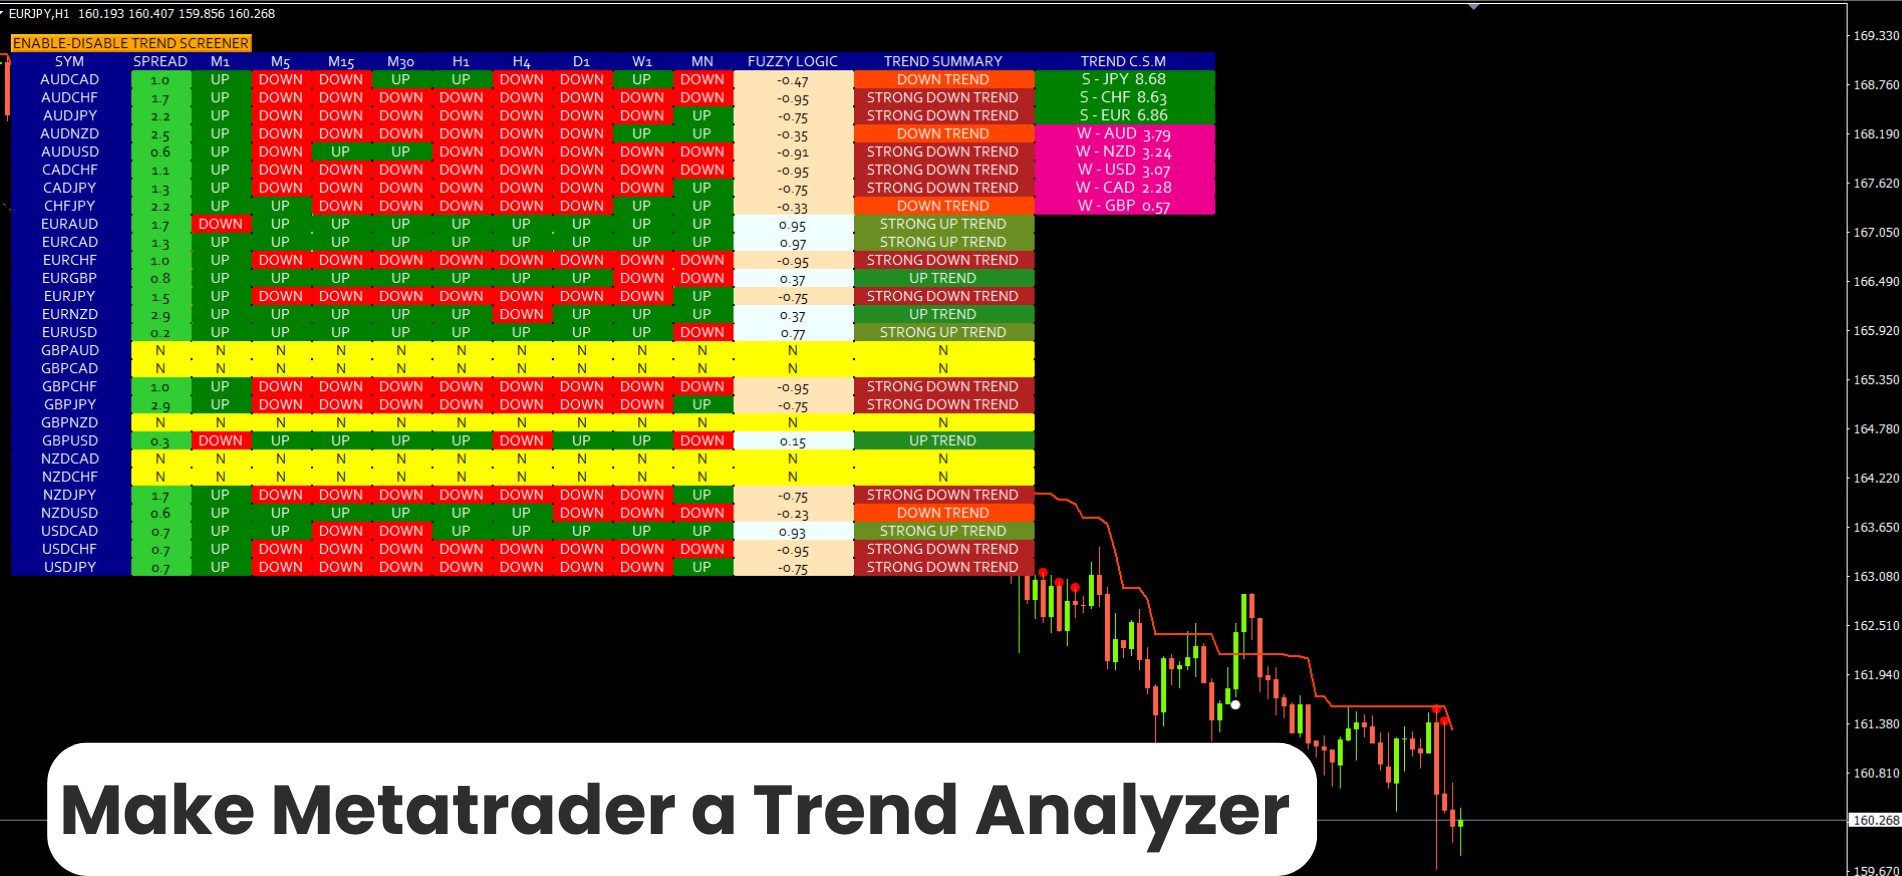
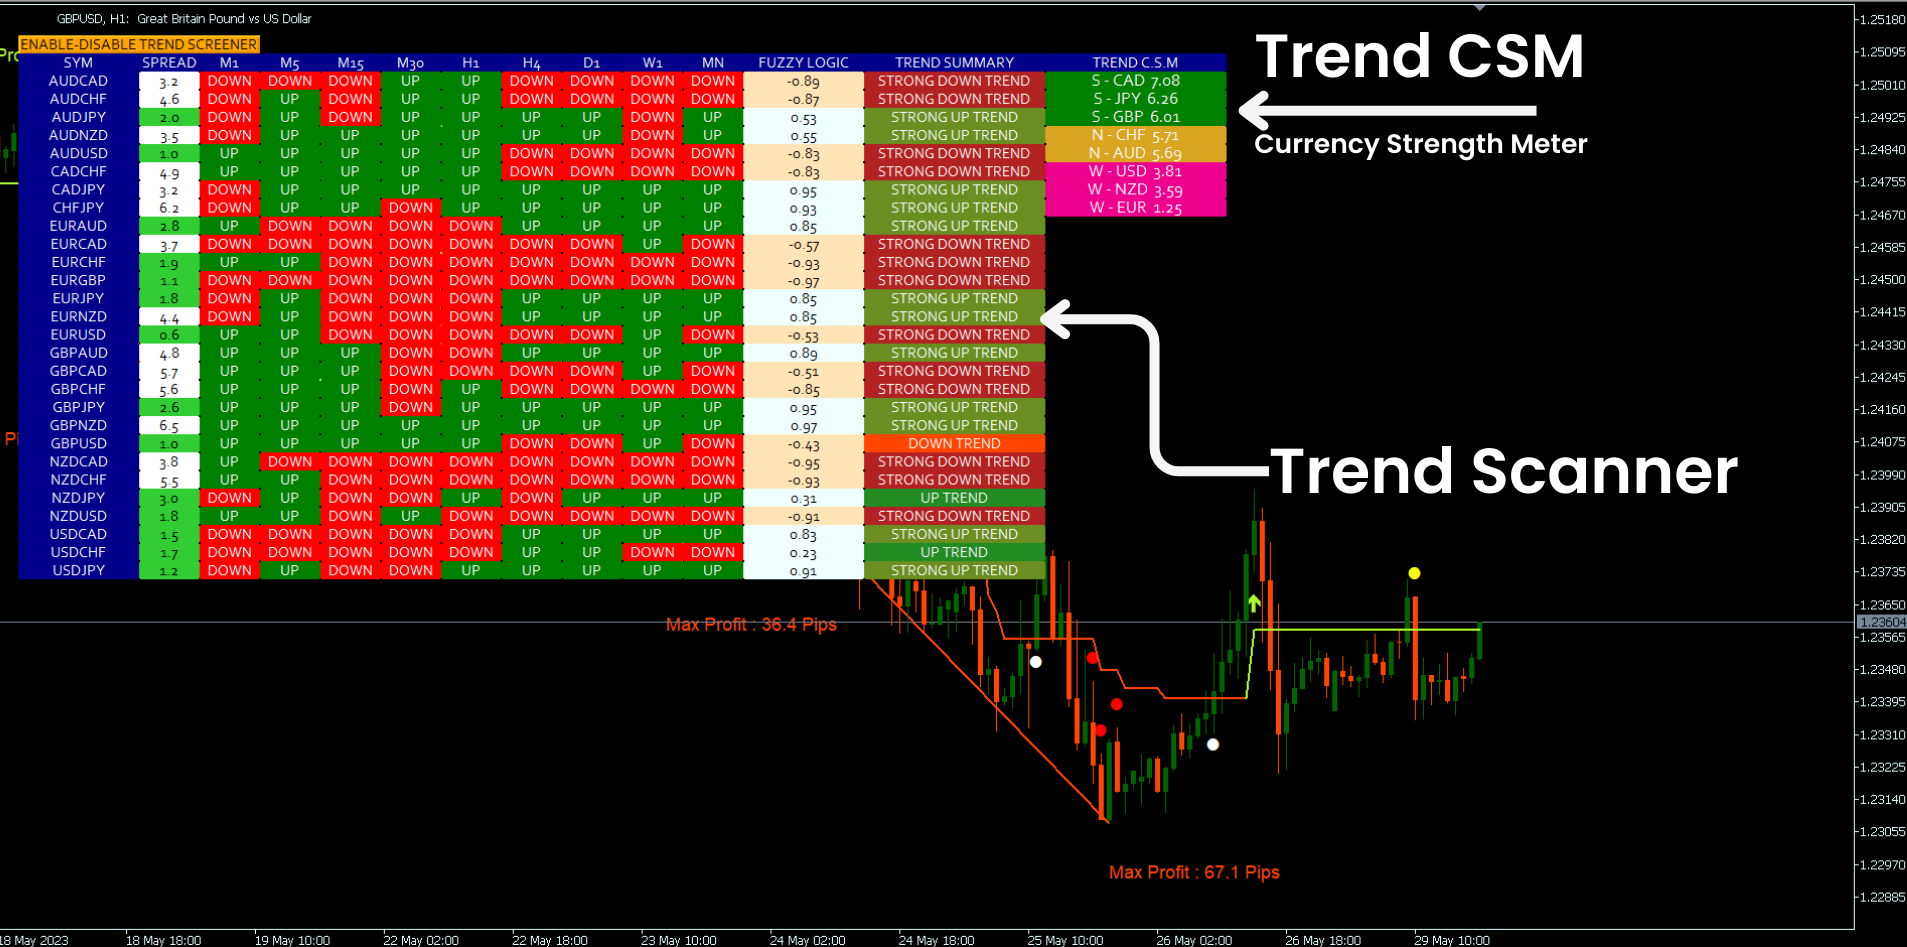
1. Trend Tarayıcı.
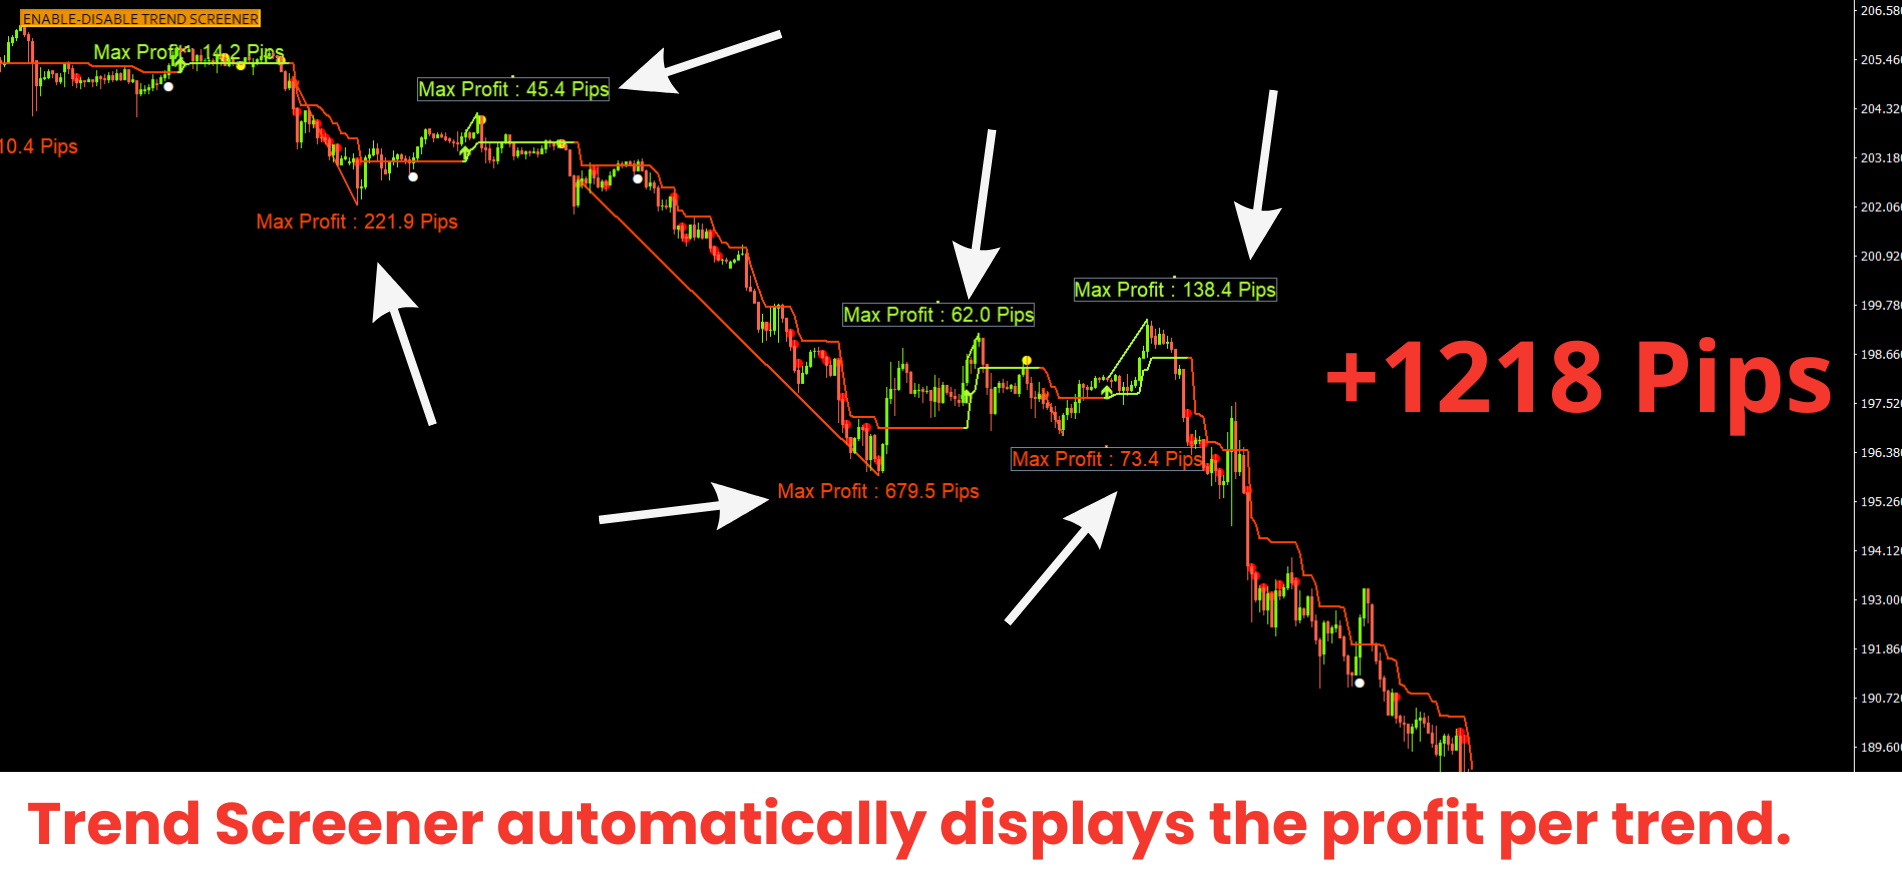
2. Maksimum kar analizi ile Trend Çizgisi.
3. Trend Para Birimi Gücü Ölçer.
4. Uyarılar ile Trend Ters noktalar.
5. Uyarılarla Güçlü Trend noktaları.
6. Eğilim Okları
Trend İzleyici Göstergemiz ile günlük analiz örnekleri, Günlük Sinyal Performansı...vb, burada bulunabilir: Buraya Tıklayın
SINIRLI SÜRELİ TEKLİF : Trend Tarayıcı Göstergesi yalnızca 50 $ ve ömür boyu kullanılabilir. (Orijinal fiyat 125$ )
Göstergemizi Metatrader Backtester kısıtlaması olmadan denemek ister misiniz, Demo sürümünü indirmek için buraya tıklayın.
MQL5 Blogumuza erişerek, tüm premium göstergelerimizi analiz örnekleri, Günlük Sinyal Performansı...vb. bulabilirsiniz. : Buraya tıklayın
Trend Screener MT4 sürümü burada mevcuttur: https://www.mql5.com/en/market/product/46303
2 Göstergeden oluşan Trend sistemimiz:
1. Trend Screener Indicator: Trend Panosu'nu, grafikte Trend Çizgisini, Giriş noktalarını...vb. görüntüleyin.
2. Trend Line Map Indicator: Al ve Sat'ı bir gösterge panosu olarak görüntüler, aktif sinyaller kar/zarar...vb.
Trend Çizgisi Haritası Göstergesini İndirin
Youtube videoları eğiticileri
Ana Özellikler
- Trend gücü analizörü.
- Çoklu zaman çerçevesi ve çoklu para birimi trend analizörü.
- Trend panosu
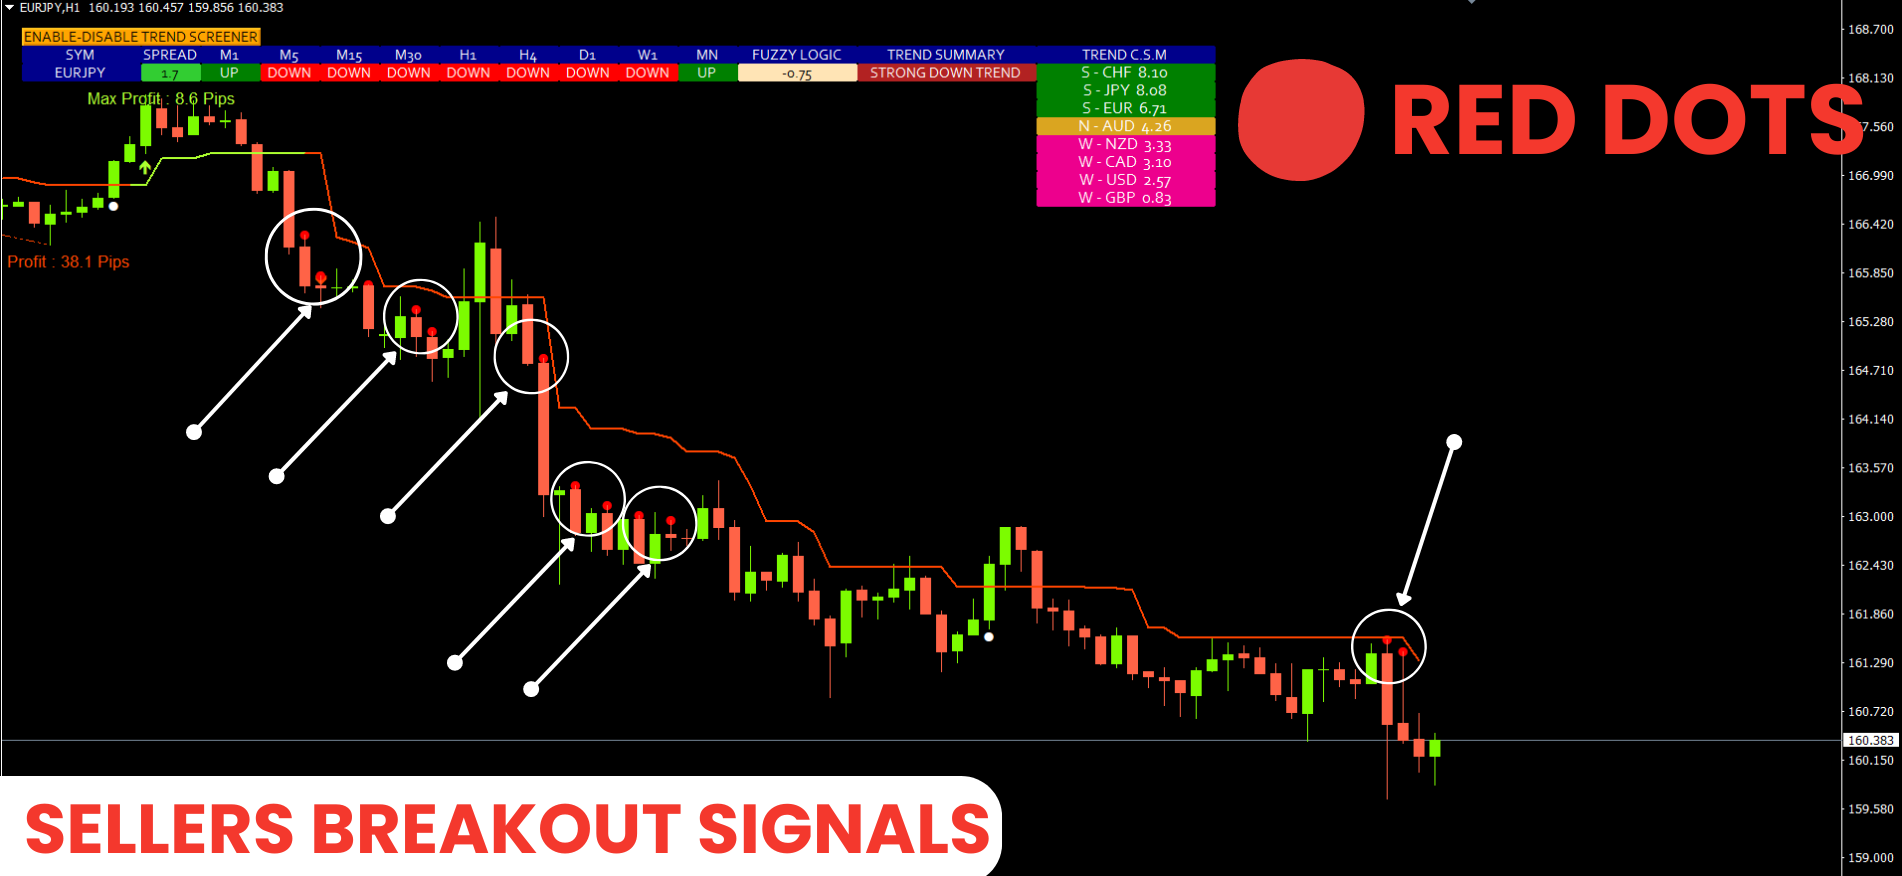
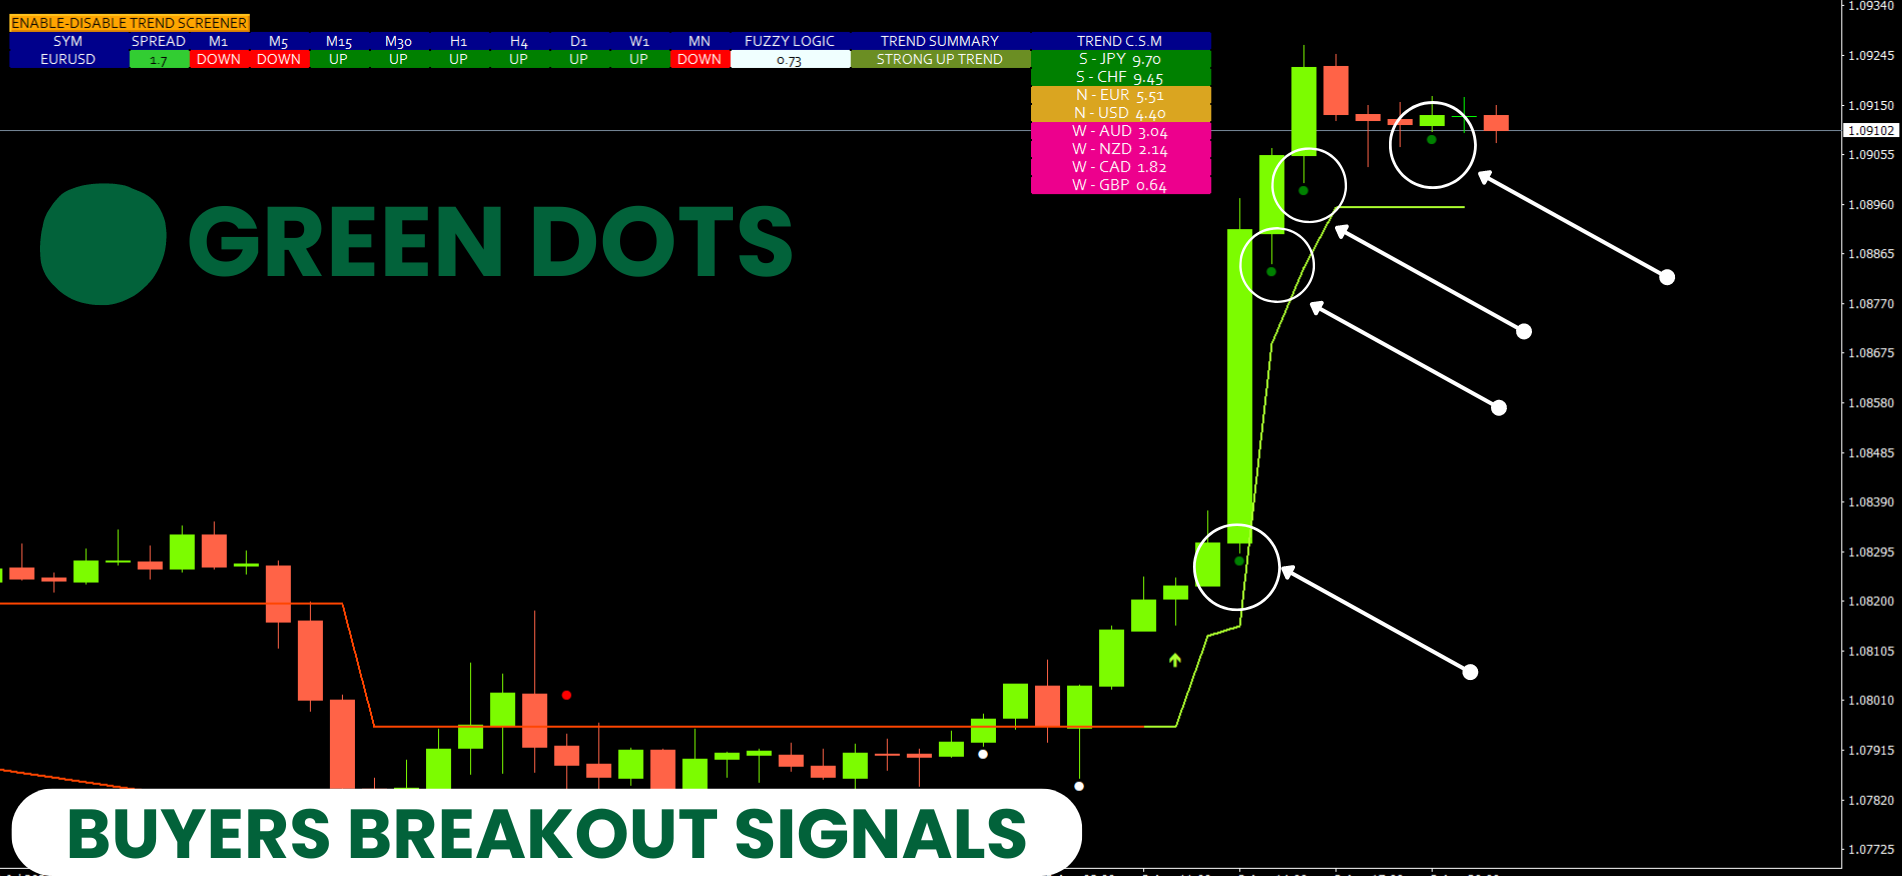
- Trend dönüş sinyalleri. ( Nokta Sinyalleri )
- Güçlü Trend Sinyalleri. ( Nokta Sinyalleri )
- Trend Çizgisi
Belgeler ( Talimatlar )
Tüm Trend Screener belgeleri (Talimatlar) ve strateji ayrıntıları MQL5 Blogumuzdaki bu gönderide mevcuttur: Buraya Tıklayın.
Temas
Herhangi bir sorunuz varsa veya yardıma ihtiyacınız varsa, Özel Mesaj yoluyla bana ulaşın.
Yazar
SAYADI ACHREF , fintech yazılım mühendisi ve Finansya'nın kurucusu. 


I love both indicators Trend screener Pro and Support and Resistance Screener Pro but you can't use them blindly. You need to understand market structure. I always try to trade a strong currency versus a weaker one. I then trade with the trend after price makes corrections. The Support and resistance indicator helps see how close price is from support or resistance. On uptrend I buy at support levels and downtrend I buy at resistance levels of price corrections. Together these indicators is all you need to make informed decisions. I do my analysis on the 1H time Frame and then I enter my trades using the 1min or 5min time frames. Thanks for these indicators. They really safe me allot of time.