MovingFlatBreakout
- Göstergeler
- Stanislav Korotky
- Sürüm: 1.1
- Güncellendi: 19 Kasım 2021
- Etkinleştirmeler: 5
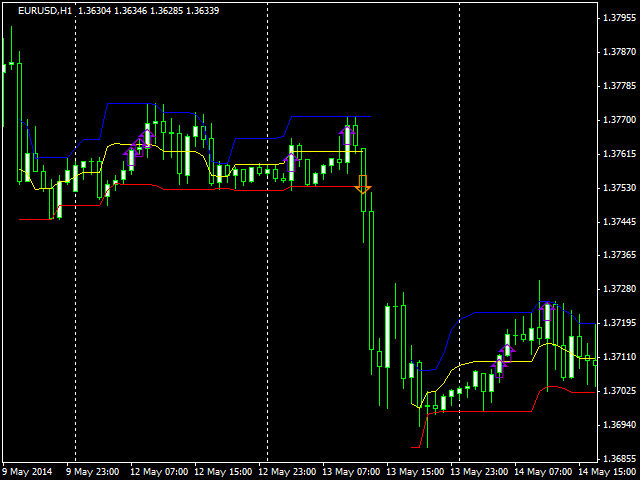
This indicator monitors the market for a flat state and possible breakout. The flat state is detected as a predefined number of consecutive bars during which price fluctuates inside a small range. If one of the next bars closes outside the range, breakout is signaled.
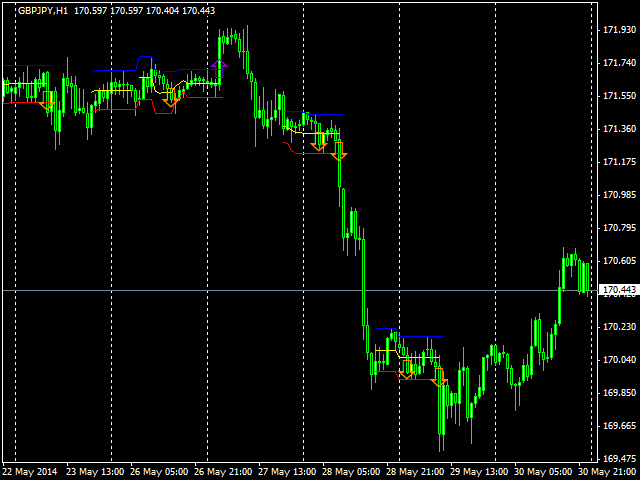
The indicator shows 3 lines: blue - upper bound of flat ranges AND consecutive breakout areas; red - lower bound of flat ranges AND consecutive breakout areas; yellow - center of flat ranges (NOT including breakout areas). When a bar in breakout area closes outside flat range, an arrow up or down is shown - these are 2 indicator buffers that can be used from Expert Advisors.
Parameters:
- FlatDetect - number of consecutive bars that should form flat range; default value - 7;
- BreakDetect - number of next bars after the flat bars, during which breakout is being monitored; breakout is signaled if one of BreakDetect bars closes outside current range formed on left-side FlatDetect adjacent bars; default value - 3;
- MaxDelta - maximal range in points that can be treated as flat; only FlatDetect bars whose highs and lows do not exceed MaxDelta points delta are considered as flat; default value - 250.
Please note that indicator shows a "moving" flat, that is every next bar can widen or narrow flat range (which is shown to the left of the bar!) or truncate it if new range is larger than MaxDelta. While "moving" bar by bar, indicator may overwrite former breakout areas with more recent flat ranges, but breakout signals are persistent. You may want to run the indicator in the tester in visual mode in order to get the notion.


