True SSRC nrp MT5
- Göstergeler
- Sergey Efimenko
- Sürüm: 1.1
- Güncellendi: 24 Ekim 2020
- Etkinleştirmeler: 10
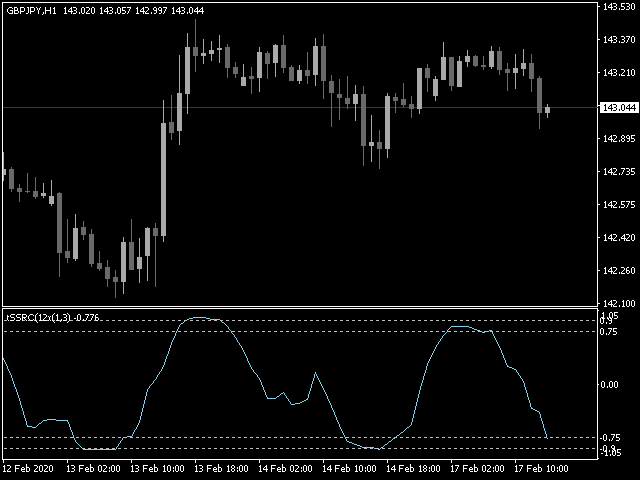
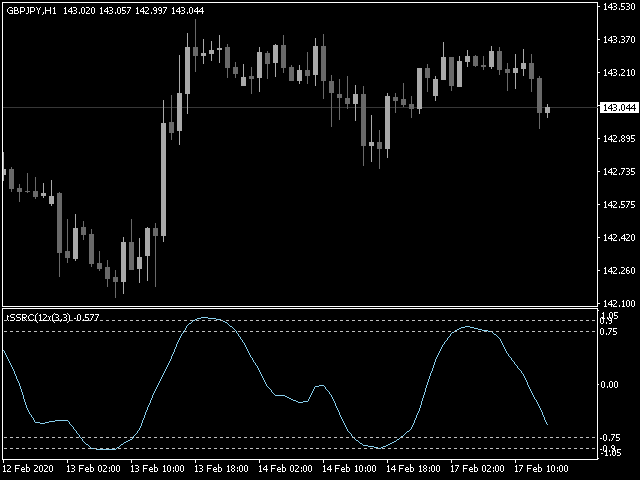
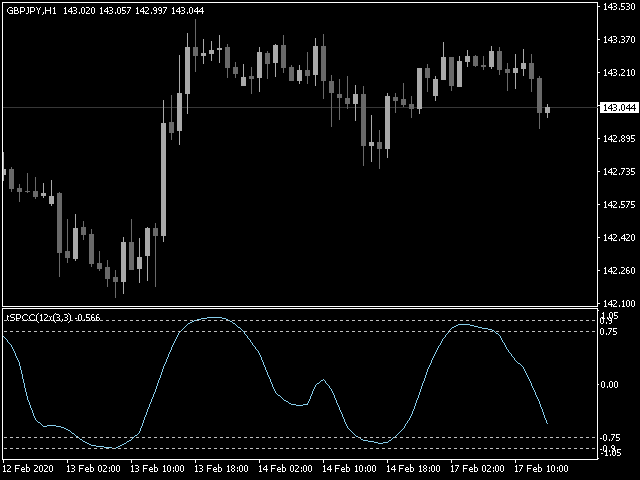
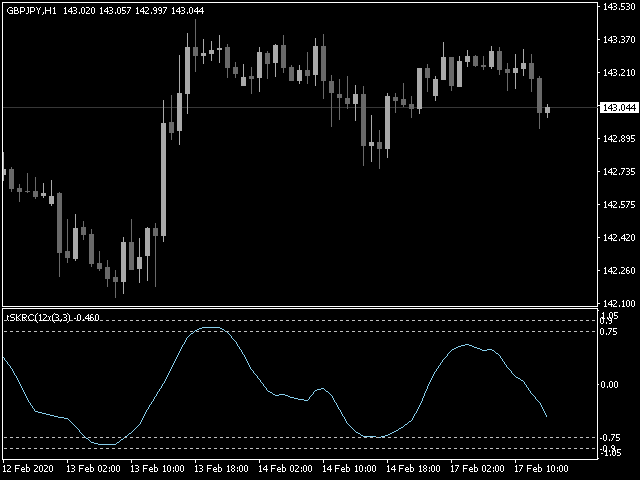
Gösterge şunları gösterir (isteğe bağlı): Spearman'ın sıra korelasyon katsayısı, Pearson'ın doğrusal korelasyon katsayısı, Kendall'ın sıra korelasyon katsayısı ve Fechner'in işaret korelasyon katsayısı. Bu osilatör, fiyat aşırı alım ve aşırı satım seviyelerinin ötesine geçtiğinde olası piyasa dönüş noktalarını gösterir.
Elde edilen değerlerin ek filtrelenmesi için 4 yöntem vardır: basit, üstel, düzleştirilmiş, doğrusal ağırlıklı.
Bar kapatıldıktan sonra değerler sabitlenir ve yeniden boyanmaz.
Spearman hesaplamasını kullanırken, bilinen SSRC'yi elde ederiz, ancak bu göstergede gerçek katsayı hesaplanır ve değerlerin yeniden boyanmasını önleyen hesaplamanın sonucuna yumuşatma uygulanır.
Parametreler:
- Calculation mode/period/price - mod/dönem/korelasyon katsayısını hesaplamak için kullanılan fiyat
- Smoothing period/method - periyot/sonuç değerini yumuşatma metodu