Pyramids trend line
- Göstergeler
- David Ayad
- Sürüm: 1.20
- Güncellendi: 24 Mart 2020
- Etkinleştirmeler: 5
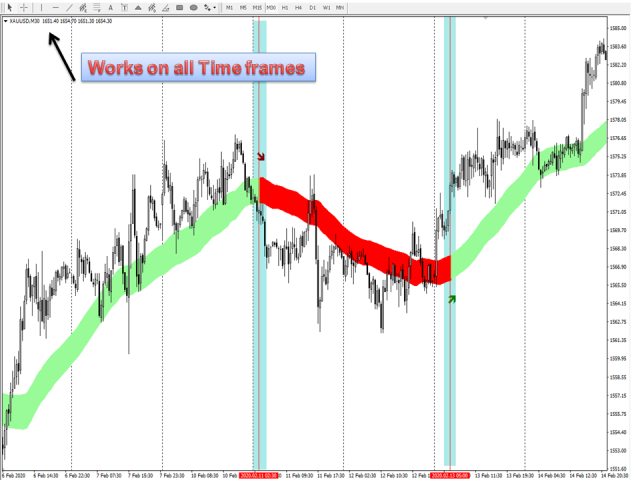
The "Pyramids trend line" is a trading and a Filtering tool too, it is based on a combination of important indicators in one tool.
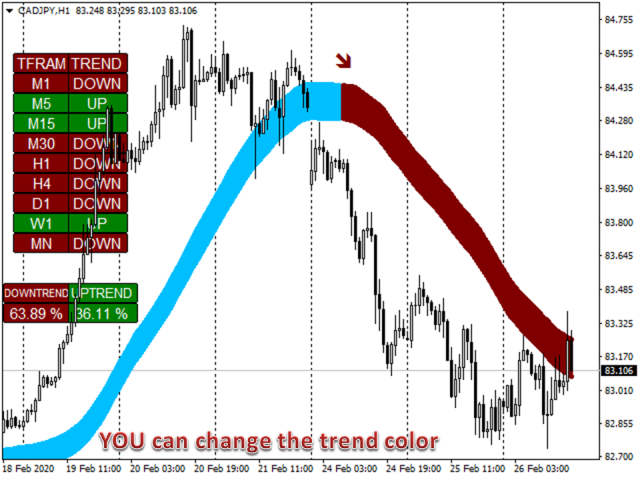
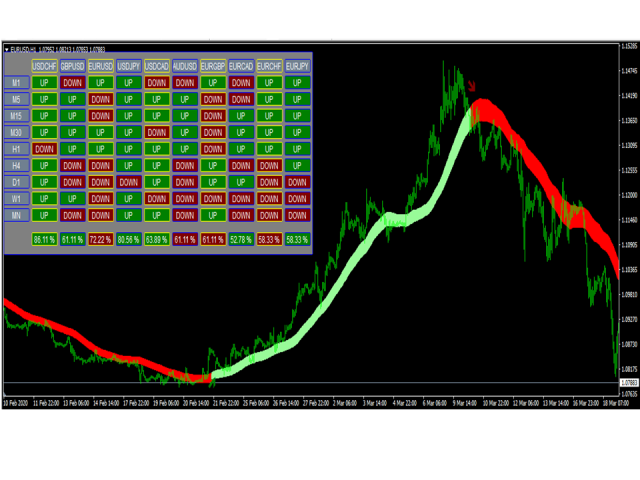
We programmed a dashboard that helps you know the current direction for each time frame, to avoid wasting time searching for it.
We also put a percentage of the trend to know its current strength (using all time frames).
- It is easy to know the trend in all time frame.
- It is easy to know the strength of the trend.
- It gives you the opportunity to trade with the general trend.
- It gives you an opportunity to filter and improve your trading method.
- Never repaints, never back paints, never recalculates.
- It works with all Currencies, Stocks, Crypto Currencies ... etc
- It has an alert when the direction changes.
Input Parameters
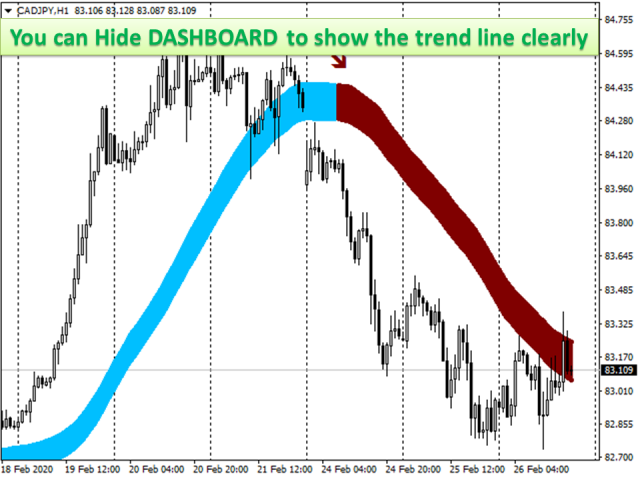
- Enable DASHBOARD '' (Optional) '' = true\ false
- Enable Alert '' (Optional) = true\ false
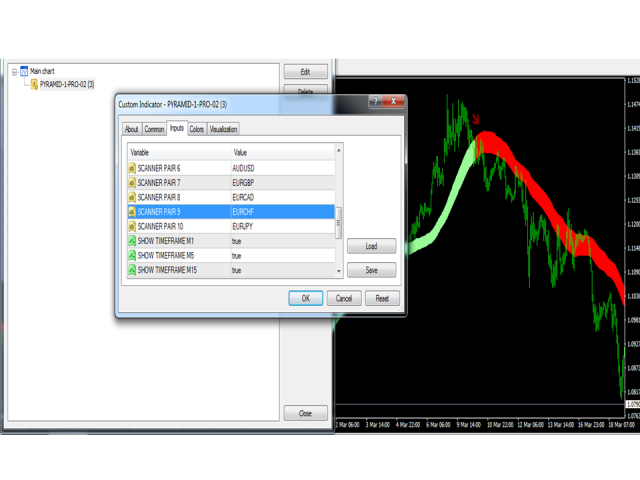
- color uptrend = Green
- color downtrend = Red
How to use it
No complicated rules just follow 2 simple steps!
Step 1: if the trend line green "uptrend" and the strength of direction for uptrend > 60%
- Go for long "BUY" position.
Step 2: if the trend line red "downtrend" and the strength of direction for downtrend > 60%
- Go for short "SELL" position.

