Touch VWAP MT5
- Göstergeler
- Danrlei Hornke
- Sürüm: 1.0
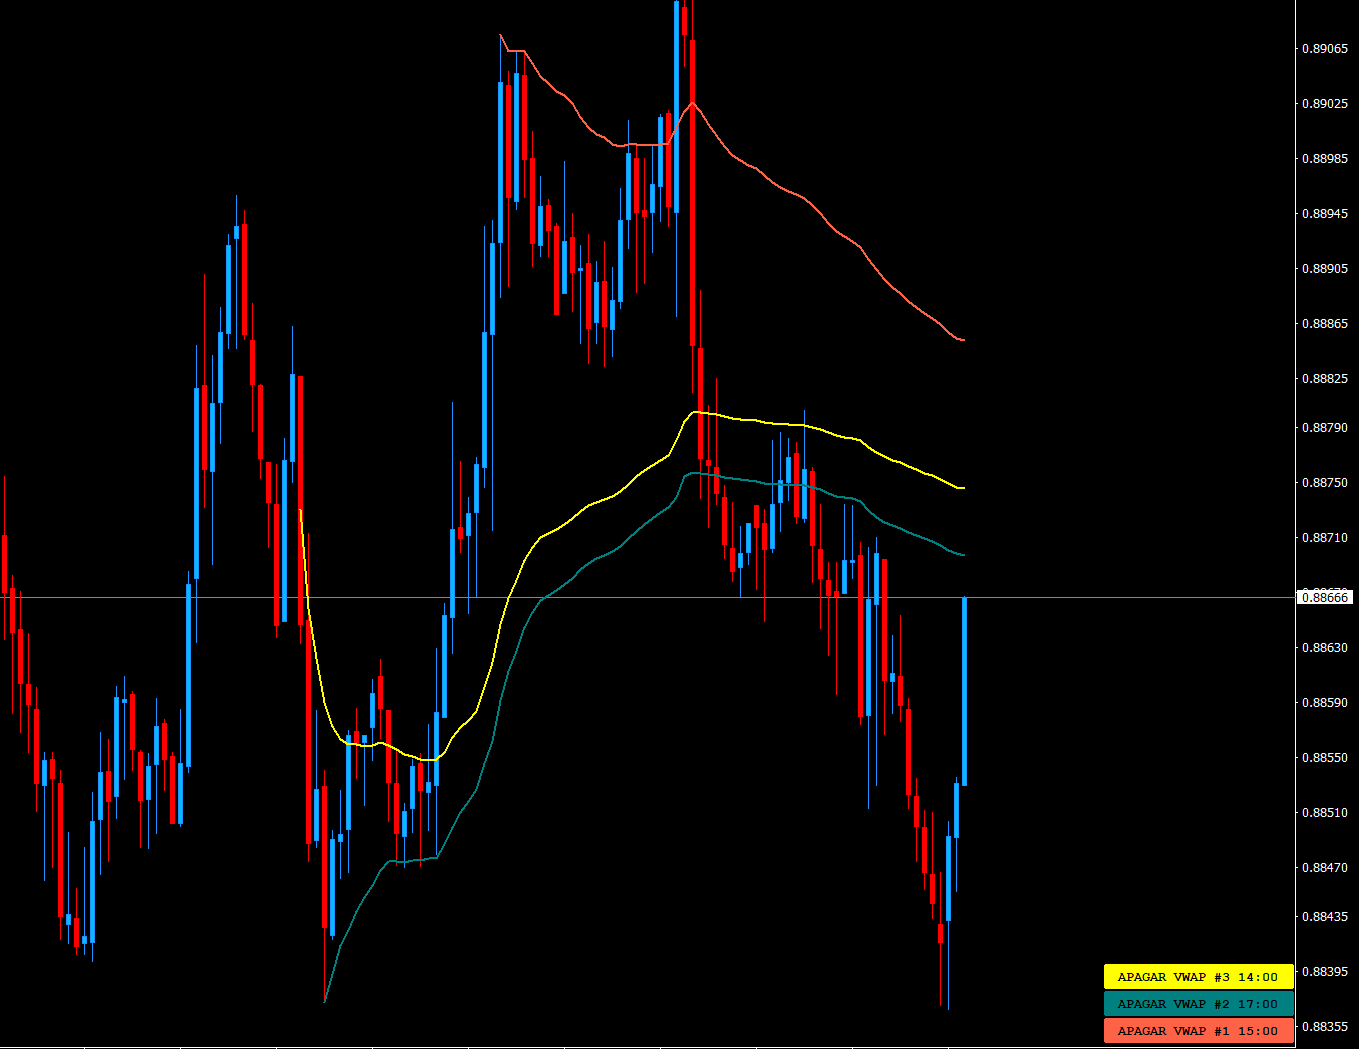
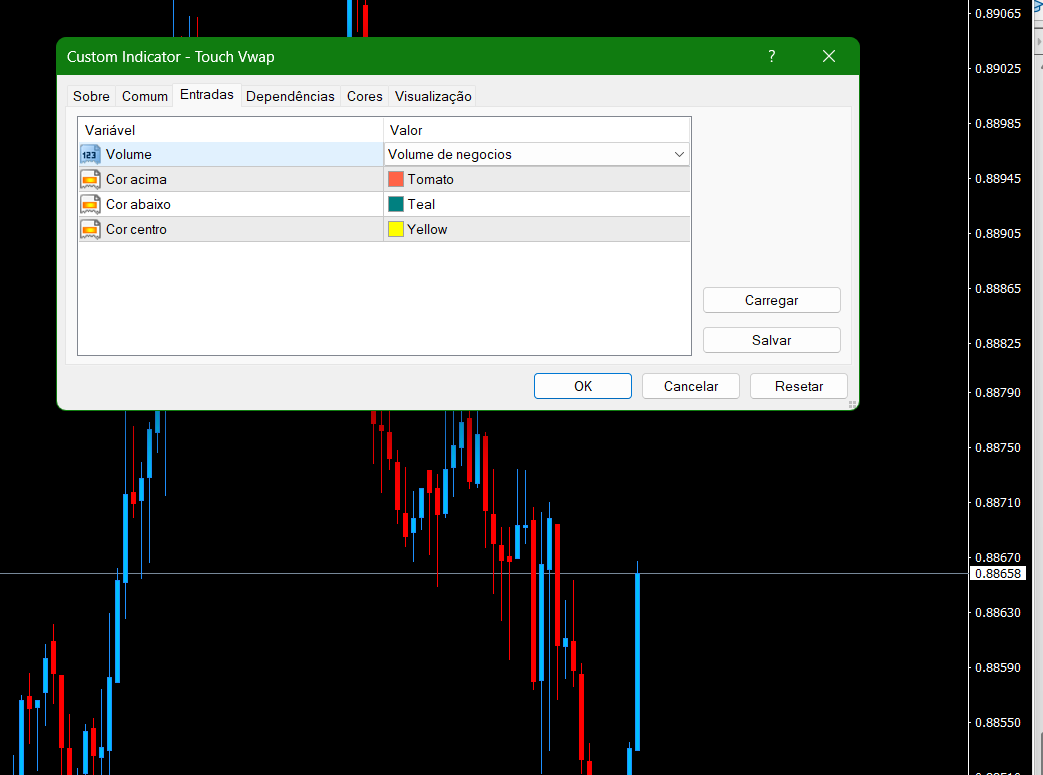
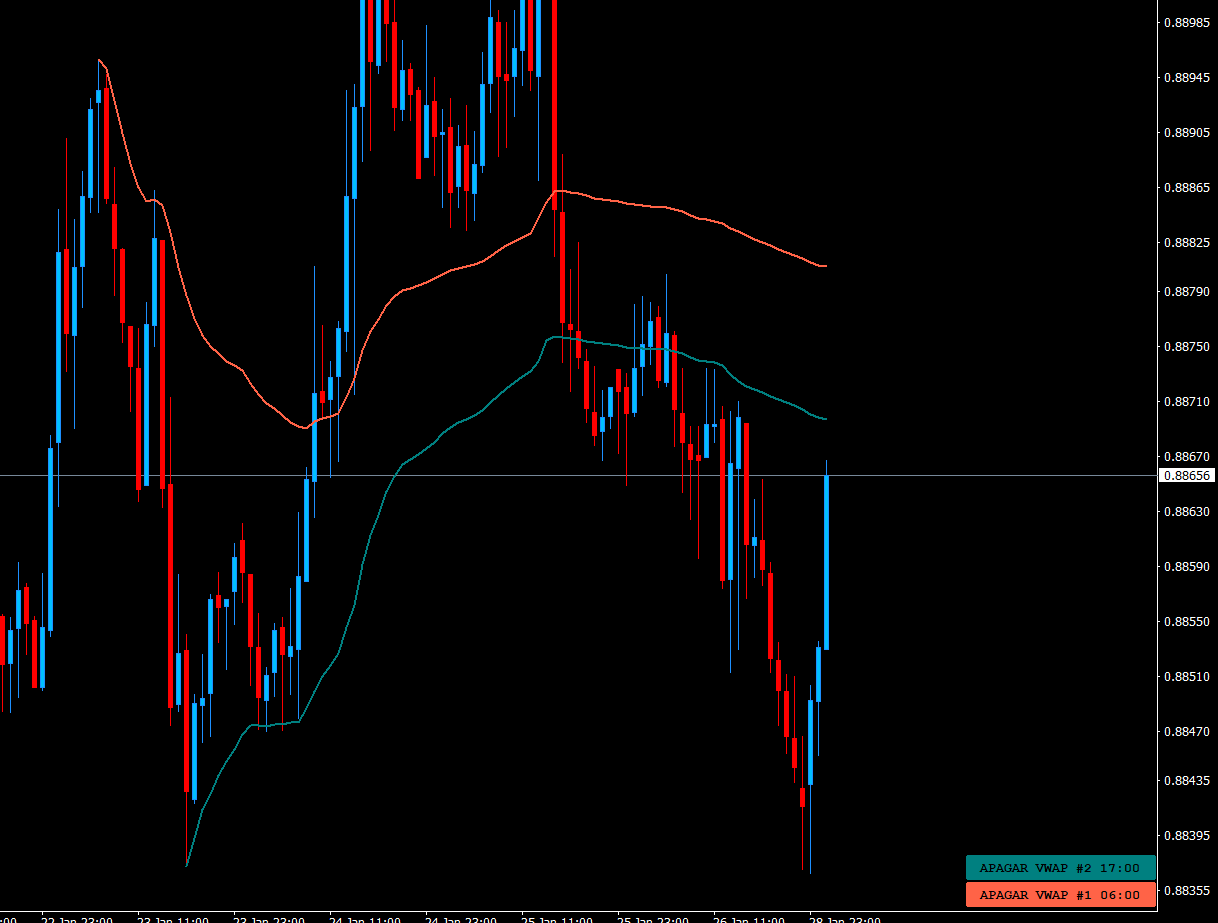
O Touch VWAP é um indicador que permite calcular uma Média Ponderada por Volume (VWAP) apenas apertando a tecla 'w' no seu teclado e após clicando no candle do qual deseja realizar o calculo, clicando abaixo do candle é calculada a VWAP baseado na minima dos preços com o volume, clicando sobre o corpo do candle é calculado uma VWAP sobre o preço medio com o volume e clicando acima do candle é calculado uma VWAP baseado na máxima dos preços com o volume, voce tambem tem a opção de remover a VWAP apenas clicando no botão de apagar.
MT4: https://www.mql5.com/pt/market/product/44923


I was looking for a free AVWAP here on MT5 and I nearly gave up. Then I came across this one. Had to use Google Translate. Anyways, downloaded it and I love the easiness of use. Deleting and adding an anchor goes really smoothly. I do have 2 questions though: 1. Is there a way to set the thickness to my liking soni don't have to make that change every single time I plot the AVWAP? 2. Once I anchor a VWAP on a chart and I switch time frames, the anchoring is gone too. Is that on purpose or do I need to do something in order for it to anchor on all time frames? Muito obrigado for your time and expertise to put this together.