ResistanceAndSupportDensityFunction
- Göstergeler
- Stanislav Korotky
- Sürüm: 1.2
- Güncellendi: 23 Kasım 2021
- Etkinleştirmeler: 5
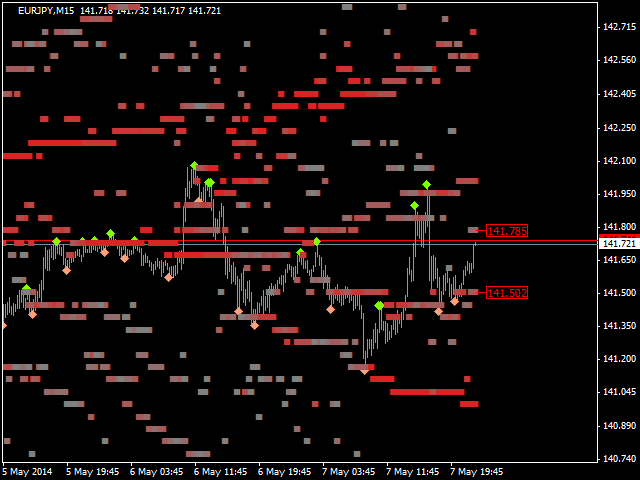
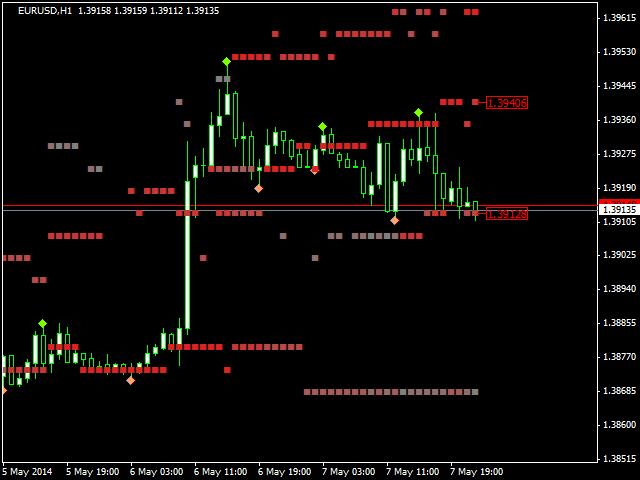
Most of traders use resistance and support levels for trading, and many people draw these levels as lines that go through extremums on a chart. When someone does this manually, he normally does this his own way, and every trader finds different lines as important. How can one be sure that his vision is correct? This indicator helps to solve this problem.
It builds a complete set of virtual lines of resistance and support around current price and calculates density function for spatial distribution of these lines. Most prominent maximums of the density function are displayed then on chart. So, the result is unbiased, impersonal, and universal. Also indicator places price marks for 2 nearest levels above and below current price on the last bar.
Parameters:
- Limit - number of bars to find extremums and build virtual lines on; by default - 500;
- Offset - number of first bar to start processing of Limit bars; by default - 0; use this parameter to analyze indicator data on history;
- Order - order of fractals which should be treated as extremums; by default - 5, that is extremum bar must be surrounded by 5 bars with lower highs or higher lows in each direction;
- HSize - the size of histogram table for density function in price axis; by default - 50; the larger the number - the better resolution of resulting picture, but the lesser generalization, that is more noise;
- Range - percent of current price to use as a range for analysis; by default - 1 (OK for M15, H1); the larger work timeframe - the larger this parameter should be;
- Smoothing - boolean flag for whether to smooth the histogram or not; by default - true; uses SMA(3);
- RoundUpStabilization - boolean flag, which controls whether indicator normalize data or not; when it's true, calculations are rounded a bit to make resulting levels more stable when indicator moves from bar to bar; by default - true;
- Color - base color for indicator buffers; by default - Red;
Due to its specific features, the indicator is repainted on each bar.


