• Genel bakış
  • İncelemeler
  • Yorumlar

ChzhshchMACD

Zen MACD göstergesi hakkında konuşmak

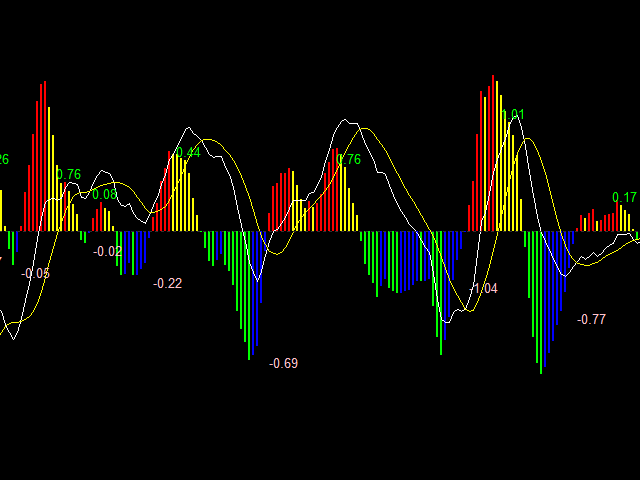
Dört renkli iki telli MACD

Sütunun alanının toplamını göster

InpFastMA=12; // Hızlı EMA dönemi

InpSlowMA=26; // Yavaş EMA dönemi

InpSignalMA=9; // Sinyal SMA periyodu

InpAppliedPrice=PRICE_CLOSE;// Uygulanan fiyat

InpMaMethod=MODE_EMA; //Ma_Method

input bool ChArea = false; //chzhshch Alanı

Hızlı EMA dönemi hızlı hat parametreleri

Yavaş EMA dönemi yavaş hat parametreleri

Sinyal SMA periyodu sinyal hattı parametreleri

Uygulama fiyatı isteğe bağlı

Büküm teorisinde tanımlanan trend kuvvetini karşılaştırın, iki trendi karşılaştırın ve kolon alanının toplamını karşılaştırın

Bu gösterge ilgili alanı hesaplar ve karşılaştırmayı kolaylaştırır
Önerilen ürünler
The DYJ SignalSourceOfMACD is based on the MACD indicator. Generally, signals are generated when crossing the MACD and SIGNAL lines of the MACD indicator.  Signals to buy   are generated if the MACD line crosses over the SIGNAL line in the negative area below the MACD open level. The negative area is where the values of MACD and SIGNAL lines are below zero. The MACD open level parameter is set in pips. However, in the code it is converted as follows: MACD Open level * Instrument.PipSize. For exa
Buy CTS scalping indicator, provide buying and selling signals, automatic channeling and sending signals to mobile phones Using technical analysis and price action methods and modern methods, CTS indicator can draw price channels and recognize price trends with high accuracy and issue entry and exit signals according to them. Traders can easily fluctuate using this indicator in different time frames and in different markets. With the CTS indicator, you can signal in different ways. This indicato
Технический индикатор Universal Oscillator является комбинацией торговых сигналов самых популярных и широко используемых осцилляторов. Индикатор представлен гистограммами, а также линиями fast и slow MA, что позволяет расширить список получаемых торговых рекомендаций и работать как по тренду, так и в боковом движении рынка. Таким образом, гистограммы позволяют определить момент пробоя ценовых значений и движение в новой фазе рынка, а линии указывают на зоны перекупленности и перепроданности.  Ос
Volality Index Scalper
Lesedi Oliver Seilane
5 (1)
Volality Index scalper indicator  Meant for Volality pairs such as Volality 10, 25, 50, 75 and 100 The indicator works on all timeframes from the 1 minute to the monthly timeframe the indicator is non repaint the indicator has 3 entry settings 1 color change on zero cross 2 color change on slope change 3 color change on signal line cross Orange line is your sell signal Blue line is your buy signal.
Implements a channel based on the moving average indicator with improved functionality. Moving average, moving average (English Moving average, MA) is a general name for a family of functions, the values ​​of which at each point of determining the level of some average value of the original function for the previous period. The channel moves up and down relative to the moving average by a specified number of points. This indicator is suitable for those who are interested in the classic calcul
MACDivergence MTF MT5
Pavel Zamoshnikov
4 (5)
Advanced ideas of the popular MACD indicator: It detects and displays classic and reverse divergences (two methods of detecting divergences). It uses different color to highlight an uptrend and a downtrend. Two methods of determining a trend: а) MACD crosses the 0 level (classic signal); б) MACD crosses its own average (early signal). This is a multi-timeframe indicator: it can display MACD data from other timeframes. Two methods of drawing: classic histogram and line. It generates sound and vis
KT Renko Patterns MT5
KEENBASE SOFTWARE SOLUTIONS
KT Renko Patterns scans the Renko chart brick by brick to find some famous chart patterns that are frequently used by traders across the various financial markets. Compared to the time-based charts, patterns based trading is easier and more evident on Renko charts due to their uncluttered appearance. KT Renko Patterns features multiple Renko patterns, and many of these patterns are extensively explained in the book titled Profitable Trading with Renko Charts by Prashant Shah. A 100% automated
Noize Absorption Index - is the manual trading system that measures the difference of pressure between bears forces and bulls forces. Green line - is a noize free index that showing curent situation. Zero value of index shows totally choppy/flat market.Values above zero level shows how powerfull bullish wave is and values below zero measures bearish forces.Up arrow appears on bearish market when it's ready to reverse, dn arrow appears on weak bullish market, as a result of reverse expectation.
Tendencia Crash300
Ignacio Agustin Mene Franco
Professional Pack Crash 300 Indicators, On this occasion I present the trend indicator that is for the crash index 300 (Deriv Broker) The indicator consists of a strategy where trends are caught in periods of 15 minutes, very clearly the indicator shows the purchase marking the tip of red until the trend develops, and then mark the green point of purchase, it is very simple to use, It is recommended to use in that temporality since it serves to catch longer trends and increase profit, the indica
SolarTrade Suite Finansal Göstergesi: Jüpiter Piyasa Göstergesi - Finans Piyasaları Dünyasında Güvenilir Rehberiniz! Bu, değerini hesaplamak için özel yenilikçi ve gelişmiş algoritmalar kullanan ve ayrıca göze hoş gelen bir tasarıma sahip bir trend göstergesidir. Bu göstergenin okumalarını anlamak çok kolaydır: mavi renk - al, kırmızı - sat. Açıklamanın alt kısmında SolarTrade Suite serisindeki diğer ürünlerimize göz atın. Yatırım ve finans piyasaları dünyasında güvenle gezinmek ister misin
Superb Trend
Sukhvinder Singh
Get the best out of your forex trading experience with our Superb Trend   indicator! Our revolutionary technology helps you make smarter and more successful trades, no matter your skill level. With a simple and intuitive interface, you'll be able to analyze trends and make wiser decisions in no time. Stop gambling with your money; start leveraging our Superb Trend Indicator to outperform the market! Trend Signals: Bullish trend will show as Green line. Bearish trend will show as Red line. Supe
Cumulative delta indicator As most traders believe, the price moves under the pressure of market buying or selling. When someone redeems an offer standing in the cup, the deal is a "buy". If someone pours into the bid standing in the cup - the deal goes with the direction of "sale". The delta is the difference between purchases and sales. A cumulative delta - the difference between the cumulative sum of purchases and sales for a certain period of time. It allows you to see who is currently contr
OPTMIZE EA BEFORE BACKTEST AND USE. United States Stock Market Index US500 trades the 5 minute charts.  The EA uses RSI and Stochastics  for entries and ATR for exits.  The building period was  From 2021-03-19 to 2022-08-18. Continually optimize the EA to find best settings and don't forget to account for spreads and slippage in optimization .  The EA does not use martingale and has a sl and tp on each trade with a fixed lot input.  Try it out in the back test, optimize for settings.  Risk Dis
This multi time frame and multi symbol indicator for MT5 alerts about Heiken Ashi Smoothed color changes. As a bonus it can also scan for Hull Moving Average color (trend) changes. Combined with your own rules and techniques, this indicator will allow you to create (or enhance) your own powerful system. Features Can monitor all symbols visible in your Market Watch window at the same time. Apply the indicator to just one chart and instantly monitor the entire market. Can monitor every time frame
MACD indicator, first indicator, loading 3 cycles, 3 windows, 5-minute, 1-hour, 1-day chart, accurate comparison ,Can be used in conjunction with my EMA metrics, The other moving average indicator I sell on MQL5 can prevent volatile market conditions, The signal line needs to be fixed after the color changes, and then the signal direction can be confirmed,For example, for a 5-minute chart, you need to wait until the next 5 minutes to confirm that the signal direction is good
The Jackson Auto Candlestick Pattern . It a powerful price action tool which auto detect and alert a hided powerful candlestick patterns . It came with few different chart skins. You can use this indicator alone to make profit, but it powerful when you combine it with trendlines, You can download The Jackson Auto Trendlines for free Link : UCRW695l9Wgg2ucnnf5DL5Vw  List of Candlestick Pattern it detect   1. Bullish & Bearish Engulfing's 2. Top and Bottom Tweezer 3. Bullish and Bearish Harams 4.
Introduction The "Two Moving Average Crossover" indicator for MetaTrader 5 (MT5) is a technical analysis tool that displays two moving averages and notifies when the moving averages cross each other. The indicator calculates and plots two moving averages, one of which is faster and the other is slower. When the faster moving average crosses above the slower moving average, it is considered a bullish signal, indicating a potential trend reversal or the start of a new uptrend. Conversely, when th
The Hull  Butterfly  Oscillator (HBO) is an oscillator constructed from the difference between a regular  Hull Moving Average  (  HMA  ) and another with coefficients flipped horizontally . Levels are obtained from cumulative means of the absolute value of the oscillator. These are used to return dots indicating potential reversal points . This indicator draw line in separate window, plus blue dot (for buy signal) when hull oscillator is peak and red when sell signal. It  also includes integrate
PipFinite Trend PRO MT5
Karlo Wilson Vendiola
4.84 (551)
Breakthrough Solution For Trend Trading And Filtering With All Important Features Built Inside One Tool! Trend PRO's smart algorithm detects the trend, filters out market noise and gives entry signals with exit levels. The new features with enhanced rules for statistical calculation improved the overall performance of this indicator. Important Information Revealed Maximize the potential of Trend Pro, please visit www.mql5.com/en/blogs/post/713938 The Powerful Expert Advisor Version Automatin
Price Breakout pattern Scanner is the automatic scanner for traders and investors. It can detect following patterns automatically from your chart. Head and Shoulder - Common tradable pattern. Reverse Head and Shoulder - This pattern is the reverse formation of the Head and Shoulder. Double Top - When the price hits resistance level twice and decline toward the support level, the trader can anticipate sudden bearish breakout through the support level. Double Bottom - The double bottom pattern is
Mega Spikes Max
Niccyril Chirindo
5 (1)
Are you tired of missing out on the biggest opportunities in Boom and Crash trading? Mega Spikes Max is your ultimate tool for dominating the markets, giving you the precision and confidence you need to succeed. Why Choose Mega Spikes Max? Stay Ahead with Real-Time Alerts Never miss a profitable trade again. Get instant notifications directly to your mobile or desktop when a spike is imminent, even if you're away from your screen. Accurate Spike Detection Engineered for pinpoint accuracy, Mega
Visual EMA PriceSync Indicator
AL MOOSAWI ABDULLAH JAFFER BAQER
Visual EMA PriceSync Indicator Price: $65 Discover a cutting-edge trading indicator designed to synchronize price action with EMA (Exponential Moving Average) trends. The Visual EMA PriceSync Indicator is your ultimate tool for identifying precise market entry and exit points, making it an essential addition to any trader’s arsenal. What does it do? The indicator detects crossover signals between the price and EMA, which signify potential trend reversals or market corrections. These sign
Your Trend Friend
Luigi Nunes Labigalini
5 (1)
The trend is your friend! Look at the color of the indicator and trade on that direction. It does not  repaint. After each candle is closed, that's the color of the trend. You can focus on shorter faster trends or major trends, just test what's most suitable for the symbol and timeframe you trade. Simply change the "Length" parameter and the indicator will automatically adapt. You can also change the color, thickness and style of the lines. Download and give it a try! There are big movements w
Fibonacci Auto
Makarii Gubaydullin
Automatically plots Fibo levels, based on the High & Low prices from the specified time frame Multiple bars   may be united: e.g. you can get a Fibo based on the 10-days Highs and Lows My   #1   Utility : 65+ features, including this indicator  |   Contact me  for any questions  |    MT4 version Helps to see potential reversal levels; Patterns formed at the Fibo levels tend to be stronger; Significantly   reduces   the   time   spent   on   manual  plotting ; Settings: Timeframe to calculate the
This is a smooth and responsive accelerometer which reveals the market trend and strength. [ Installation Guide | Update Guide | Troubleshooting | FAQ | All Products ] Two moving averages indicate trend direction The histogram represents strength of the price movement It draws buy and sell zones as colored vertical lines Should be used as a confirmation indicator Customizable line widths and colors It implements alerts of all kinds This indicator is similar to MACD but aims to react faster to
DYJ SuperGamingTrend EA DYJ ChameleonTrend göstericisine dayalı çalışıyor. dyj chameleon trend chameleon trend çizgi rengini uzun ve kısa pozisyon açılması sinyalini kontrol etmek için kullanır. Ve hızlı annemle, orta annemle yavaş annemle yanlış sinyalleri filtremek için işbirliği yap. EA, yanlış sinyal açılması yüzünden kaybedenleri düzeltmek için, karşılıklı ve zararları düzeltmek için kullanır. Eğer EA çalıştığında gösterici dyj chameleonterinin trend renk değiştirme eğri göstermek istiyors
Owl Smart Levels MT5
Sergey Ermolov
4.07 (28)
MT4 versiyonu  |  FAQ Owl Smart Levels Indicator , Bill Williams'ın gelişmiş fraktalları , piyasanın doğru dalga yapısını oluşturan Valable ZigZag ve kesin giriş seviyelerini gösteren Fibonacci seviyeleri gibi popüler piyasa analiz araçlarını içeren tek gösterge içinde eksiksiz bir ticaret sistemidir. pazara ve kar elde edilecek yerlere. Stratejinin ayrıntılı açıklaması Gösterge ile çalışma talimatı Baykuş Yardımcısı ticaretinde Danışman Yardımcısı Kullanıcıların özel sohbeti -> Satın aldıktan
MACD with fast and slow EMA. Moving average convergence divergence (MACD) is a trend-following momentum indicator that shows the relationship between two moving averages of a security's price . The MACD is calculated by subtracting the fast-period exponential moving average (EMA) from the slow-period EMA. Setup options: Fast EMA period Slow EMA period Signal EMA period Applied price Indicator window height Color MACD Color Signal Color Histogram
Bear Bull
Ignacio Agustin Mene Franco
Bear Bull! It is an indicator that marks with Heikin Ashi candles but modified, the sales and purchases long and short trend! with 2 colors green marks the purchase, purple marks the sale, works for any type of temporality, works for forex markets and synthetic indices! ideal for any pair, it also works for crypto pairs, Good profit! World Investor - World Inversor - 
Renko Gold
Ignacio Agustin Mene Franco
Renko Gold! clearly indicates the floors and ceilings where it goes from 4 lines, the line below that marks the floor in green confirming with the thinnest line clarifies the purchase entry, the same is for sale, the top line marks the ceiling and the thinnest red line marks the sale, This indicator works for all temporalities! For Forex and Synthetic Indices markets! It also works for crypto markets! Good profit! World Investor.
Bu ürünün alıcıları ayrıca şunları da satın alıyor
Trend Screener Pro MT5
STE S.S.COMPANY
4.89 (72)
Trend Göstergesi, Trend Alım Satım ve Filtreleme için Çığır Açan Benzersiz Çözüm, Tüm Önemli Trend Özellikleriyle Tek Bir Araç İçinde Yerleştirildi! Forex, emtialar, kripto para birimleri, endeksler ve hisse senetleri gibi tüm sembollerde/araçlarda kullanılabilen %100 yeniden boyamayan çoklu zaman çerçevesi ve Çoklu para birimi göstergesidir. Trend Screener, grafikte noktalarla ok trend sinyalleri sağlayan etkili bir trend trend göstergesidir. Trend analizörü göstergesinde bulunan özellikler: 1.
Golden Trend Indicator MT5
Noha Mohamed Fathy Younes Badr
4.86 (14)
Golden Trend indicator  is The best indicator for predicting trend movement this indicator never lags and never repaints and never back paints    and give  arrow buy and sell    before the candle appear  and it will help you and  will make your trading decisions clearer its work on all currencies and  gold and crypto and all time frame This unique  indicator uses very secret algorithms to catch the  trends, so you can trade using this indicator and see the trend clear on charts  manual guide and
FX Volume MT5
Daniel Stein
4.82 (17)
FX Volume: Bir Broker’ın Perspektifinden Gerçek Piyasa Duyarlılığını Deneyimleyin Kısa Özet Trading yaklaşımınızı bir adım öteye taşımak ister misiniz? FX Volume , perakende traderlar ile brokerların nasıl konumlandığını gerçek zamanlı olarak sunar—COT gibi gecikmeli raporlardan çok daha önce. İster istikrarlı kazançları hedefliyor olun, ister piyasada daha güçlü bir avantaj arayın, FX Volume önemli dengesizlikleri belirlemenize, kırılmaları (breakout) doğrulamanıza ve risk yönetiminizi iyileş
FX Power MT5 NG
Daniel Stein
5 (10)
FX Power: Daha Akıllı Ticaret Kararları için Para Birimlerinin Gücünü Analiz Edin Genel Bakış FX Power , her piyasa koşulunda başlıca para birimlerinin ve altının gerçek gücünü anlamak için vazgeçilmez bir araçtır. Güçlü para birimlerini alıp zayıf olanları satarak, FX Power ticaret kararlarınızı basitleştirir ve yüksek olasılıklı fırsatları ortaya çıkarır. İster trendlere sadık kalın ister Delta'nın aşırı değerlerini kullanarak tersine dönüşleri öngörün, bu araç ticaret tarzınıza mükemmel bir
Quantum TrendPulse
Bogdan Ion Puscasu
5 (13)
SuperTrend   ,   RSI   ve   Stochastic'in   gücünü tek bir kapsamlı göstergede birleştirerek işlem potansiyelinizi en üst düzeye çıkaran nihai işlem aracı olan   Quantum TrendPulse'u   tanıtıyoruz. Hassasiyet ve verimlilik arayan yatırımcılar için tasarlanan bu gösterge, piyasa trendlerini, momentum değişimlerini ve en uygun giriş ve çıkış noktalarını güvenle belirlemenize yardımcı olur. Temel Özellikler: SuperTrend Entegrasyonu:   Güncel piyasa trendlerini kolayca takip edin ve karlılık dalgası
IX Power MT5
Daniel Stein
4.83 (6)
IX Power: Endeksler, Emtialar, Kripto Paralar ve Forex Piyasaları için İçgörüler Genel Bakış IX Power , endeksler, emtialar, kripto paralar ve forex sembollerinin gücünü analiz etmek için tasarlanmış çok yönlü bir araçtır. FX Power , tüm kullanılabilir döviz çiftlerinin verilerini kullanarak döviz çiftleri için maksimum doğruluk sağlarken, IX Power yalnızca temel sembolün piyasa verilerine odaklanır. Bu, IX Power 'ı forex dışındaki piyasalar için ideal ve daha basit forex analizleri için güven
FX Levels MT5
Daniel Stein
5 (2)
FX Levels: Tüm Piyasalar İçin Son Derece Hassas Destek ve Direnç Hızlı Bakış Döviz kurları, endeksler, hisseler veya emtialar gibi herhangi bir piyasada güvenilir destek ve direnç seviyeleri belirlemek mi istiyorsunuz? FX Levels geleneksel “Lighthouse” yöntemini ileri düzey bir dinamik yaklaşımla birleştirerek neredeyse evrensel bir doğruluk sağlar. Gerçek broker deneyimimize ve otomatik günlük güncellemeler ile gerçek zamanlı güncellemelerin birleşimine dayalı olarak, FX Levels size dönüş nok
TPSpro RFI Levels MT5
Roman Podpora
4.53 (19)
TALİMATLAR         RUS   -        ENG       Bir gösterge ile kullanılması   önerilir       -       TPSpro   TREND PRO -   Sürüm MT4         Ticarette önemli bir unsur, bir ticaret aracını satın alma veya satma kararlarının alındığı bölgeler veya seviyelerdir. Büyük oyuncuların piyasadaki varlıklarını gizleme girişimlerine rağmen, kaçınılmaz olarak izler bırakırlar. Bizim görevimiz bu izleri nasıl tanımlayacağımızı ve doğru şekilde nasıl yorumlayacağımızı öğrenmekti. Ana işlevler:: Satıcılar ve
TPSproTREND PrO MT5
Roman Podpora
4.47 (17)
TPSpro TREND PRO  - is a trend indicator that automatically analyzes the market and provides information about the trend and each of its changes, as well as giving signals for entering trades without redrawing! The indicator uses each candle, analyzing them separately. referring to different impulses - up or down impulse. Exact entry points into transactions for currencies, crypto, metals, stocks, indices!  ИНСТРУКЦИЯ RUS         INSTRUCTIONS  ENG       R ecommended to use with an indicator   -
RelicusRoad Pro MT5
Relicus LLC
4.78 (18)
Şimdi 147 $ (birkaç güncellemeden sonra 499 $ 'a yükseliyor) - Sınırsız Hesaplar (PC'ler veya Mac'ler) RelicusRoad Kullanım Kılavuzu + Eğitim Videoları + Özel Discord Grubuna Erişim + VIP Durumu PİYASAYA BAKMAK İÇİN YENİ BİR YOL RelicusRoad, forex, vadeli işlemler, kripto para birimleri, hisse senetleri ve endeksler için dünyanın en güçlü ticaret göstergesidir ve yatırımcılara kârlı kalmaları için ihtiyaç duydukları tüm bilgileri ve araçları sağlar. Başlangıç ​​seviyesinden ileri seviyeye ka
Support And Resistance Screener, MetaTrader için tek bir gösterge içinde birden fazla araç sağlayan tek bir Düzey göstergesindedir. Kullanılabilir araçlar şunlardır: 1. Piyasa Yapısı Eleme Aracı. 2. Geri Çekilme Bölgesi Boğa. 3. Geri Çekilme Bölgesi Ayı. 4. Günlük Pivot Noktaları 5. haftalık Pivot Noktaları 6. aylık Pivot Puanları 7. Harmonik Modele ve hacme dayalı Güçlü Destek ve Direnç. 8. Banka Seviyesi Bölgeleri. SINIRLI SÜRELİ TEKLİF : YG Destek ve Direnç Göstergesi sadece 50 $ ve ömür boyu
Bill Williams Advanced
Siarhei Vashchylka
5 (9)
Bill Williams Advanced is designed for automatic chart analysis using Bill Williams' "Profitunity" system. The indicator analyzes four timeframes at once. Manual (Be sure to read before purchasing) Advantages 1. Automatically analyzes the chart using the "Profitunity" system of Bill Williams. The found signals are placed in a table in the corner of the screen. 2. Equipped with a trend filter based on the Alligator indicator. Most of the system signals are recommended to be used only according t
Bu gösterge paneli, seçilen semboller için mevcut en son   harmonik kalıpları   gösterir, böylece zamandan tasarruf edersiniz ve daha verimli olursunuz /   MT4 sürümü . Ücretsiz Gösterge:   Basic Harmonic Pattern Gösterge sütunları Symbol :   seçilen semboller görünecektir Trend:   yükseliş veya düşüş Pattern :   desen türü (gartley, kelebek, yarasa, yengeç, köpekbalığı, cypher veya ABCD) Entry :   giriş fiyatı SL:   zararı durdur fiyatı TP1:   1. kar alma fiyatı TP2:   2. kar alma fiyatı TP
Öncelikle, bu Ticaret Aracının Non-Repainting, Non-Redrawing ve Non-Lagging Gösterge olduğunu vurgulamakta fayda var, bu da onu profesyonel ticaret için ideal hale getiriyor. Çevrimiçi kurs, kullanıcı kılavuzu ve demo. Akıllı Fiyat Hareketi Kavramları Göstergesi, hem yeni hem de deneyimli tüccarlar için çok güçlü bir araçtır. İleri ticaret fikirlerini, Inner Circle Trader Analizi ve Smart Money Concepts Ticaret Stratejileri gibi 20'den fazla kullanışlı göstergeyi bir araya getirerek bir araya
Top indicator for MT5   providing accurate signals to enter a trade without repainting! It can be applied to any financial assets:   forex, cryptocurrencies, metals, stocks, indices .  Watch  the video  (6:22) with an example of processing only one signal that paid off the indicator! MT4 version is here It will provide pretty accurate trading signals and tell you when it's best to open a trade and close it. Most traders improve their trading results during the first trading week with the help of
FX Dynamic: Özelleştirilebilir ATR Analiziyle Volatilite ve Trendleri Takip Edin Genel Bakış FX Dynamic , ortalama gerçek aralık (ATR) hesaplamalarını kullanarak günlük ve gün içi volatilite hakkında rakipsiz bilgiler sağlayan güçlü bir araçtır. 80%, 100%, 130% gibi net volatilite eşikleri ayarlayarak, piyasa olağan hareketlerinin ötesine geçtiğinde hızlı şekilde uyarı alabilir ve potansiyel kazanç fırsatlarını süratle tespit edebilirsiniz. FX Dynamic , brokerınızın zaman dilimine uyum sağlaya
Gold Stuff mt5
Vasiliy Strukov
4.92 (173)
Gold Stuff mt5, özellikle altın için tasarlanmış bir trend göstergesidir ve herhangi bir finansal enstrümanda da kullanılabilir. Gösterge yeniden çizilmez ve gecikmez. Önerilen zaman dilimi H1. Ayarları ve kişisel bir bonusu almak için satın alma işleminden hemen sonra benimle iletişime geçin!  Güçlü Destek ve Trend Tarayıcı göstergemizin ücretsiz bir kopyasını pm'den alabilirsiniz. Ben!   AYARLAR Ok Çiz - açık kapalı. grafik üzerinde oklar çizmek. Uyarılar - sesli uyarılar kapalı. E-posta b
Tanıtım       Quantum Breakout PRO   , Breakout Bölgeleri ile ticaret yapma şeklinizi değiştiren çığır açan MQL5 Göstergesi! 13 yılı aşkın ticaret tecrübesine sahip deneyimli tüccarlardan oluşan bir ekip tarafından geliştirilmiştir.       Kuantum Breakout PRO       yenilikçi ve dinamik koparma bölgesi stratejisiyle ticaret yolculuğunuzu yeni zirvelere taşımak için tasarlanmıştır. Kuantum Breakout Göstergesi, size 5 kar hedefi bölgesi ile kırılma bölgelerinde sinyal okları ve kırılma kutusuna da
Matrix Arrow Indicator MT5
Juvenille Emperor Limited
5 (13)
Matrix Arrow Indicator MT5 ,   forex ,   emtialar ,   kripto   para birimleri ,   endeksler ,   hisse senetleri   gibi tüm sembollerde/araçlarda kullanılabilen   %100 yeniden boyamayan   çoklu zaman çerçevesi göstergesini izleyen benzersiz bir 10'u 1 arada trenddir.  Matrix Arrow Indicator MT5 , mevcut eğilimi erken aşamalarında belirleyecek ve aşağıdakiler gibi 10'a kadar standart göstergeden bilgi ve veri toplayacaktır: Ortalama Yönlü Hareket Endeksi (ADX) Emtia Kanal Endeksi (CCI) Klasik Hei
Easy Breakout MT5
Mohamed Hassan
5 (3)
After your purchase, feel free to contact me for more details on how to receive a bonus indicator called VFI, which pairs perfectly with Easy Breakout for enhanced confluence!     Easy Breakout MT5   is a powerful price action trading system built on one of the most popular and widely trusted strategies among traders: the   Breakout strategy ! This indicator delivers crystal-clear Buy and Sell signals based on breakouts from key support and resistance zones. Unlike typical breakout indicators
Gartley Hunter Multi
Siarhei Vashchylka
5 (9)
Gartley Hunter Multi - An indicator for searching for harmonic patterns simultaneously on dozens of trading instruments and on all possible timeframes. Manual (Be sure to read before purchasing) | Version for MT4 Advantages 1. Patterns: Gartley, Butterfly, Shark, Crab. Bat, Alternate Bat, Deep Crab, Cypher 2. Simultaneous search for patterns on dozens of trading instruments and on all possible timeframes 3. Search for patterns of all possible sizes. From the smallest to the largest 4. All fou
Royal Scalping Indicator M5
Vahidreza Heidar Gholami
5 (6)
Royal Scalping Indicator is an advanced price adaptive indicator designed to generate high-quality trading signals. Built-in multi-timeframe and multi-currency capabilities make it even more powerful to have configurations based on different symbols and timeframes. This indicator is perfect for scalp trades as well as swing trades. Royal Scalping is not just an indicator, but a trading strategy itself. Features Price Adaptive Trend Detector Algorithm Multi-Timeframe and Multi-Currency Trend Low
Trade smarter, not harder: Empower your trading with Harmonacci Patterns Special Offer: Purchase now to receive free bonuses worth $165! (Read more for details) This is arguably the most complete harmonic price formation auto-recognition indicator you can find for the MetaTrader Platform. It detects 19 different patterns, takes fibonacci projections as seriously as you do, displays the Potential Reversal Zone (PRZ) and finds suitable stop-loss and take-profit levels. [ Installation Guide | Upd
Bu gösterge paneli, seçilen semboller için ticaret stratejinize bağlı olarak hem ölçeklendirme hem de uzun vadeli modda grafikteki   Arz ve Talep   bölgelerini keşfeder ve görüntüler. Ek olarak, gösterge tablosunun tarayıcı modu, istediğiniz tüm sembolleri bir bakışta kontrol etmenize ve uygun pozisyonları kaçırmamanıza yardımcı olur /   MT4 sürümü Ücretsiz gösterge:   Basic Supply Demand Özellikler Birden fazla döviz çiftinde   alım satım fırsatlarını görüntülemenize olanak tanıyarak, arz
QM Pattern Scanner MT5
Reza Aghajanpour
5 (4)
Contact me  to send you instruction and add you in group. QM (Quasimodo) Pattern is based on Read The Market(RTM) concepts. The purpose of this model is to face the big players of the market (financial institutions and banks), As you know in financial markets, big traders try to fool small traders, but RTM prevent traders from getting trapped. This style is formed in terms of price candles and presented according to market supply and demand areas and no price oscillator is used in it. RTM conc
Auto Order Block with break of structure based on ICT and Smart Money Concepts (SMC) Futures Break of Structure ( BoS )             Order block ( OB )            Higher time frame Order block / Point of Interest ( POI )    shown on current chart           Fair value Gap ( FVG ) / Imbalance   -  MTF      ( Multi Time Frame )    HH/LL/HL/LH  -  MTF      ( Multi Time Frame )  Choch  MTF      ( Multi Time Frame )  Volume Imbalance     ,  MTF          vIMB Gap’s Power of 3 Equal High / Low’s  
Volumatic VIDyA MT5
Duc Hoan Nguyen
5 (1)
Special offer : ALL TOOLS , just $35 each! New tools   will be   $30   for the   first week   or the   first 3 purchases !  Trading Tools Channel on MQL5 : Join my MQL5 channel to update the latest news from me Volumatic VIDYA (Variable Index Dynamic Average) , trendleri izlemek ve her trend aşamasında alım-satım baskısını analiz etmek için tasarlanmış gelişmiş bir göstergedir. Dinamik Ortalama Değişken Endeksi (Variable Index Dynamic Average) temel bir dinamik düzleştirme tekniği olarak kullan
Dark Absolute Trend   is an Indicator for intraday trading. This Indicator is based on   Trend Following  strategy but use also candlestick patterns and Volatility. We can enter in good price with this Indicator, in order to follow the main trend on the current instrument. It is advised to use low spread ECN brokers. This Indicator does   Not repaint   and   N ot lag . Recommended timeframes are M5, M15 and H1. Recommended working pairs: All. I nstallation and  Update Guide   -  Troubleshooting
CONTACT US  after purchase to get the Indicator Manual. Try Now—Limited 50% Discount for First 10 Buyers! Download the  Metatrader 4 Version Due to regulatory restrictions, our service is unavailable in certain countries such as India, Pakistan, and Bangladesh. William Delbert Gann (W.D. Gann) was an exceptional market analyst, whose trading technique was based on a complex blend of mathematics, geometry, astrology, and ancient mathematics which proved to be extremely accurate. A Note from t
Suleiman Levels
Suleiman Alhawamdah
5 (2)
Önemli Not: Ekran görüntülerinde gösterilen resim, benim 2 göstergem olan "Süleyman Seviyeleri" göstergesi ve "RSI Trend V" göstergesine aittir. "RSI Trend V1" göstergesiyle birlikte kullanılmasını önerdim, özellikle renkli bulutu doğrulamak ve eşleştirmek için, ayrıca ok sinyalleri için, bunun yanı sıra Fibonacci göstergesinin ve eklenen olağanüstü seviyelerinin önemini de vurguladım : https://www.mql5.com/en/market/product/132080 "Süleyman Seviyeleri" göstergesi, gelişmiş, hepsi bir arada pro
Yazarın diğer ürünleri
giriiş Bu, "Zhan Zhong Shuo Chan" teorisindeki ilk tür alış ve satış noktalarına karşılık gelen, trend farklılıklarını tespit etmek için tasarlanmış bir geri çekilme EA'sıdır. Olağanüstü yüksek kâr faktörüyle bu EA, uzun vadeli tutarlı kârlılık sağlar. Çeşitli piyasa koşullarına sorunsuz bir şekilde uyum sağlamasını sağlayan dinamik şebeke ticaretini kullanır. Yeni EA Promosyon Fiyatı: 99 $ → 149 $ Canlı Sinyal https://www.mql5.com/tr/signals/2196313 Dosyayı Ayarla https://c.mql5.com/6/954/Pro
Bu, zirveleri ve dipleri değerlendirmek için net bir göstergedir ve Salınımlı piyasa için iyi çalışır. Promosyon fiyatı 49$ → 59$ özellikler üstleri ve dipleri yargılamada iyi Yeniden çizme yok, sürüklenme yok Hızlı hesaplama, gecikme yok Zengin hatırlatma modu Birden fazla parametre ve renk ayarlanabilir parametre "======== Ana ========" YüksekDüşükDönem1 = 9 YüksekDüşükPeriyod2 = 60 YüksekDüşükPeriyod3 = 34 YüksekDüşükEMAPeriyodu = 4 MASignalPeriod = 5 "======== Bildir ========" UseAlertNo
Bu, geleneksel teknik göstergeleri kullanan ve uyarlanabilir EA için yapay zekayı kullanan, uzun vadeli istikrarlı ve kârlı bir altın ticareti EA'dır. Yeni EA Promosyon Fiyatı: 199$   →   $ 249 Karakteristik her seferinde bir sipariş sabit stoploss uyarlanabilir gece ticareti Kayma optimizasyonu haber filtresi FTMO, DARWINEX Zero'dan geçmek için uygun Diğer EA'lar ile kullanılabilir Nesne yönelimli programlama, program çerçevesi 5 yıldır test edilmiştir Sinyal https://www.mql5.com/tr/signals/22
tanıtmak Bu, 21:00-22:00 saatleri arasında ticaret yapan gece ticareti için bir EA'dır. Uzun vadeli firma teklifleri kârlıdır Bir seferde yalnızca bir emirle işlem yapın ve büyük bir kayba neden olmaz Her sipariş için zararı durdur ve kar al, grid, Martin veya diğer yüksek riskli fon yönetimini kullanmayın. Aynı anda birden fazla para birimi için kullanılabilir Varsayılan olarak saat dilimini otomatik olarak ayarla karakteristik Ticaret tablosu: M15 Takas edilebilir para birimleri: EURUSD,GBPSU
EEVCC Hedge Promosyon fiyatı: 59 $ Aktivasyon: 10 Tanıtım Bu, iki yönlü (aynı anda alım ve satım) bir şebekeden korunma işlemidir EA Uzun vadeli firma teklifleri kârlıdır Aynı anda birden fazla para biriminde kullanılabilir Güvenli kar hesaplama yöntemi karakteristik Ticaret grafiği: H1 Önerilen para birimi: EURGBP, EURUSD Minimum depozito: 3000USD, önerilen 10000USD, cent hesaplar için 100USD Önerilen brokerler: RofoForex, Exness ve yüksek kaldıraç ve cent hesaplarına sahip diğer platformlar Ba
1 day Promotional price: $49 Activation: 30 10 days promotional price: $59 activation: 20 Introduction Quick View Quickly check the profitability for a period of time and display the statistics Quickly filter historical transactions and make statistics based on time, magic number, currency, and comments Statistics include Net Profit, LotTotal, Profit Factor, Short Trades (win %), Long Trades (win %), Average Profit Trade, etc. Refresh statistical data in real time Calculation time is less
Introduction This is an indicator of daily profitability Characteristic Statistics can be based on currency, magic number, and notes Statistics can be based on time Available for all currencies, all periods There are white and black themes Reverse sort The refresh rate can be adjusted You can set the refresh time to the latest Parameter nD                     =  30;                                     // Number of days StartTime          =  D'2021.06.01 00:00:00';       //  StartTime EndTime 
Yarı Otomatik Martin Sistemi tanıtmak Bu araç, yarı otomatik Martin ticareti için kullanılır, sipariş vermek için panele tıklayın ve EA pozisyonu yönetecektir. Sadece işlemin yönüne karar verin ve gerisini EA yönetimine bırakın Otomatik Martin, ayarlanan ızgaraya göre depo ekleyin, bu işlevi de devre dışı bırakabilirsiniz Tek tıkla tasfiye Bir tuş kilidi işlevi zaman kontrolü Uyarı sesi istemi karakteristik Ticaret tablosu: herhangi biri Takas edilebilir para birimi: herhangi biri Otomatik
Introduce This is a trading assistant, information panel indicators, aggregate currency statistics, account statistics, position information, server and local time, currency strength, K-line remaining time, support and resistance lines, server time offset, currency fluctuations Rate and other functions. Can be used for all types of accounts and currencies. Excellent performance, very few resources You can customize the position, color, font size Any module can be individually displayed or disab
CZSC Fraktal tip indeksi Özellikler: Dahil etme ilişkisinin kapsamlı bir şekilde işlenmesini gerçekleştirdi "Stok Yapmayı Öğretmek 93: İki Tablo Arasındaki İlişki ve Trend Yapısının İçi 2" deki durumu ve üst-alt bir sınıflandırma olup olmadığını değerlendirmek için EA çağrısını kullanmak uygundur. Yukarıdan aşağıya sınıflandırmayı oklarla göster Olası kalemleri farklı renklerde göster İki bitişik K-çizgisinin dahil etme ilişkisi bir tanım verir: bir K-çizgisinin yüksek ve alçak noktaların
Bu kitaplık, anahtar ve değer dizilerini sıralamak için kullanılır, genellikle değerleri sıralamamız gerekir. piton dilinde olduğu gibi sorted(key_value.items(), key = lambda kv:(kv[ 1 ], kv[ 0 ])) içe aktarma işlevi Kullanım senaryoları örneği 1. Izgara EA siparişleri açılış fiyatına göre sıralanır void SortedByOpenPride()   {    long     OrderTicketBuffer[];    double   OpenPriceBuffer[];    for ( int i = PositionsTotal ()- 1 ; i>= 0 ; i--)      {        if (m_position.SelectByIndex(i))  
King of Dragon Kanalı, King of Dragon Göstergesi, King of Dragon Sistemi, King of Dragon MT5, King of Dragon klasik göstergesi, King of Dragon swiping sistemi, Ejderha Kralı Hepsi Bir Arada Klasik bir kanal ticaret sistemi olan King of Dragon kanal ticaret sistemi, birçok kullanıcı MT5 versiyonunu şiddetle talep ediyor. Bu program, birden çok sürümde performans için optimize edilmiştir ve zaten nispeten sorunsuz bir sistemdir. 49$ → 59$ Kırmızı alan, uzun trend, sadece uzun, kısa değil Yeşil a
Bu gösterge, fiyat ve göstergeler arasındaki farklılığı tespit etmek için klasik MACD ve Zigzag göstergelerini birleştirir. Ayrıca sapmanın geçerliliğini tespit etmek için gelişmiş yapay zeka (AI) teknolojisini de kullanır. MACD "göstergelerin kralı" olarak bilinir ve Zigzag da çok faydalı bir göstergedir. Bu iki göstergeyi birleştiren bu gösterge, her ikisinin de güçlü yanlarından yararlanır. Farklılığın tespiti olasılıksal bir problemdir. Çoğu zaman, farklılıklar yalnızca aynı yönde daha fa
Döviz Gücü Göstergesi Döviz Gücü Göstergesi trendleri belirlemek için güçlü bir araçtır. Farklı para birimlerinin gücünü ve zayıflığını karşılaştırır ve trend olan döviz çiftlerini bulmayı kolaylaştırır. Satış Fiyatı: 49$ Özellikler Güçlü ve zayıf para birimleri arasında etkili bir şekilde ayrım yapar Trend olan para birimlerini otomatik olarak tanımlar Çoklu zaman dilimi 28 döviz çifti yükler Performans optimize edildi Gösterge Kullanımı Güçlü para birimleri: 80'in üzerindeki para birimle
Bu, çok az risk içeren uzun vadeli istikrarlı ve karlı bir ticaret EA'sıdır. Uyarlanabilir EA için geleneksel teknik göstergeleri kullanır. Bu EA, parametre optimizasyonundan ziyade esas olarak algoritma optimizasyonudur. Bizim peşinde olduğumuz şey uzun vadeli istikrarlı kardır. İstikrarlı para kazanmak en önemli şeydir. Yeni EA promosyon fiyatı: $199   → $299 Özellikler Bir seferde bir emir, Martingale yok, ızgara Uzun vadeli doğrulamadan sonra karlı Sabit stop loss adaptif Kaymayı azaltmak
Chart Compare'i Tanıtıyoruz - En İyi Çoklu Grafik Senkronizasyon Aracınız Şimdi 39 dolara satışta (normalde 59 dolar) Anında içgörüler için birden fazla grafiği sorunsuz bir şekilde senkronize edin. Temel Özellikler: Göz kamaştırıcı hızlı senkronizasyon: Olay odaklı teknoloji tüm grafiklerde sorunsuz ve anında güncellemeler sağlar. Hafif ve verimli: Optimum performans için minimum sistem kaynağı kullanımı. Hızlı karşılaştırmalar: Benzer enstrümanları yan yana kolayca karşılaştırın. Yıllarca
Filtrele:
İnceleme yok
İncelemeye yanıt