ChannelRSI4
- Göstergeler
- Iurii Tokman
- Sürüm: 1.0
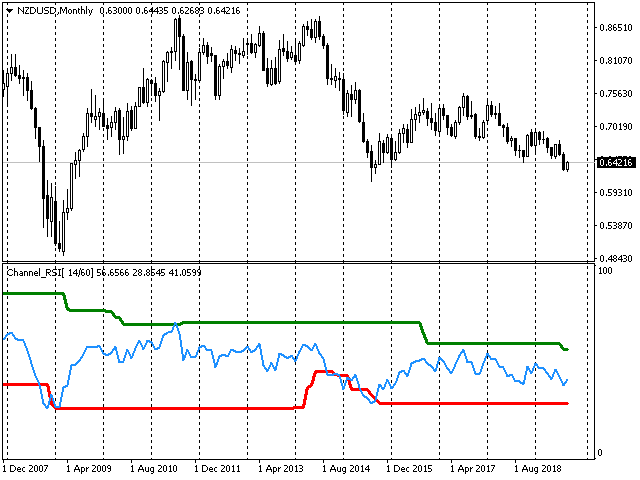
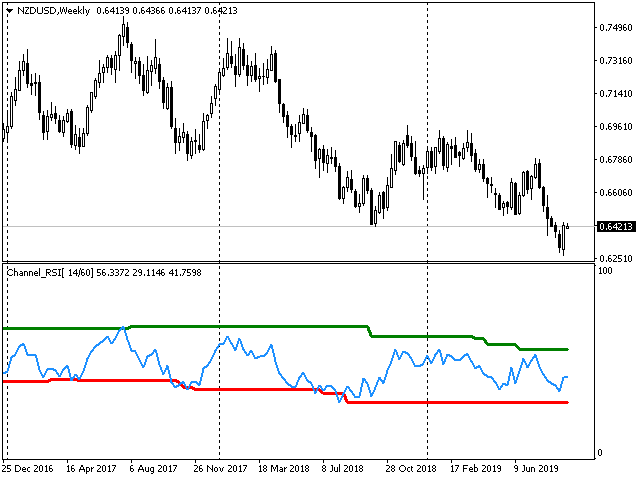
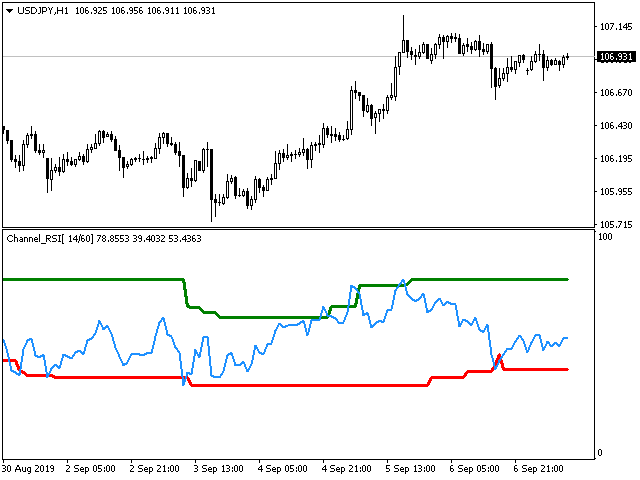
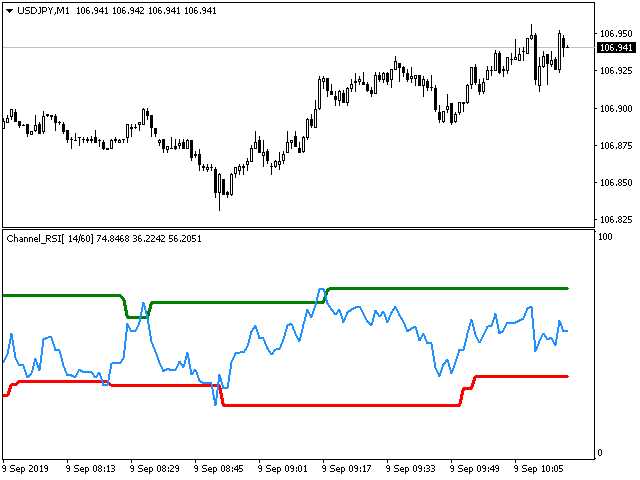
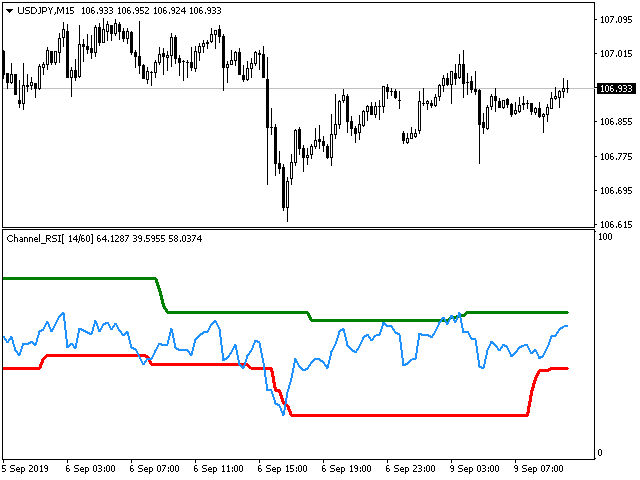
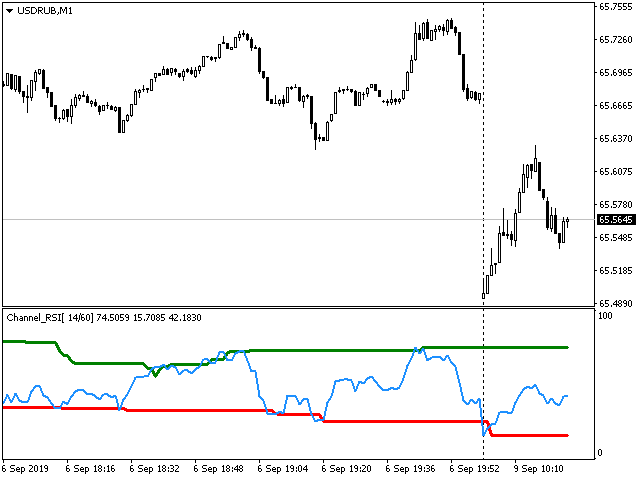
ChannelRSI4
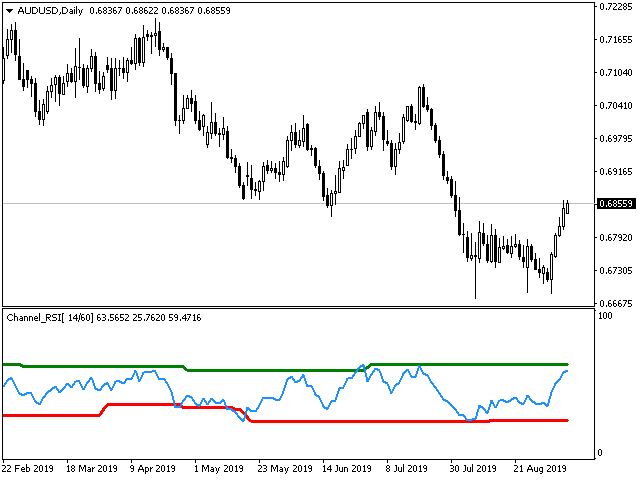
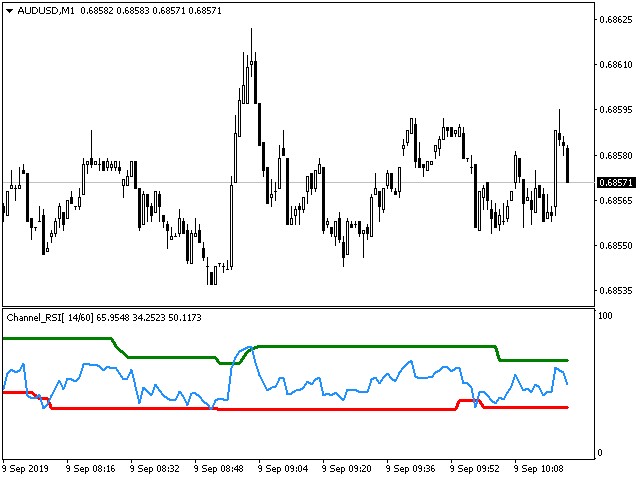
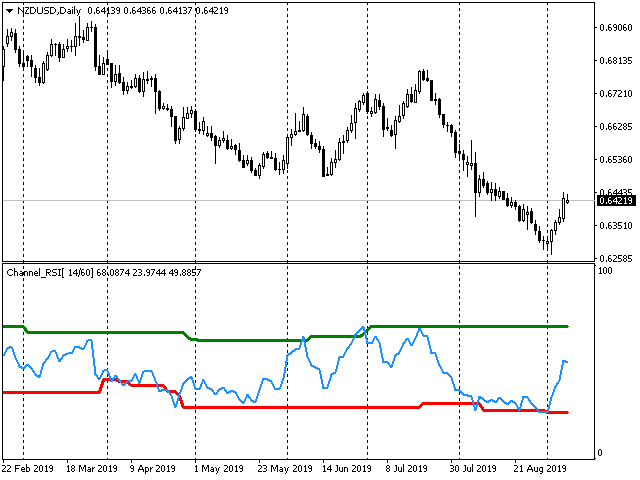
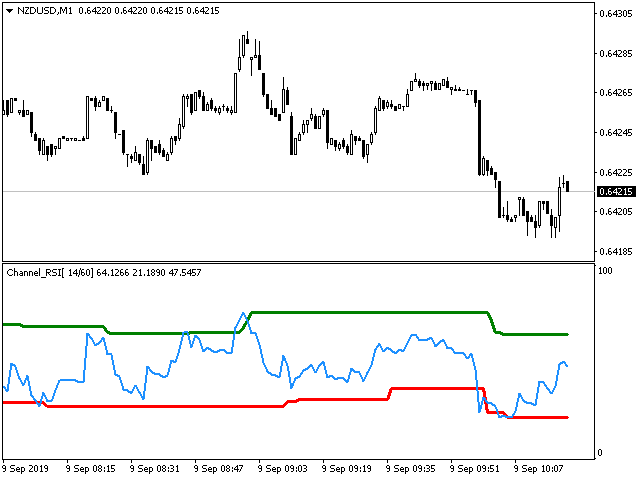
The Relative Strength Index (RSI) indicator with dynamic levels of overbought and oversold zones.
Dynamic levels change and adjust to the current changes in the indicator and prices, and represent a kind of channel.
Indicator settings
- period_RSI - Averaging period for calculating the RSI index.
- applied_RSI - The applied price. It can be any of the price constants: PRICE_CLOSE - Closing price, PRICE_OPEN - Opening price, PRICE_HIGH - Maximum price for the period, PRICE_LOW - Minimum price for the period, PRICE_MEDIAN - Median price (high + low) / 2, PRICE_TYPICAL - Typical price (high + low + close) / 3, PRICE_WEIGHTED - Weighted average price, (high + low + close + close) / 4.
- period_channel - Calculation period for the dynamic channel of overbought and oversold zones.


Отличный индикатор!