PZ Synthetic Chart MT5
- Göstergeler
- PZ TRADING SLU
- Sürüm: 1.1
- Güncellendi: 31 Ocak 2022
- Etkinleştirmeler: 20
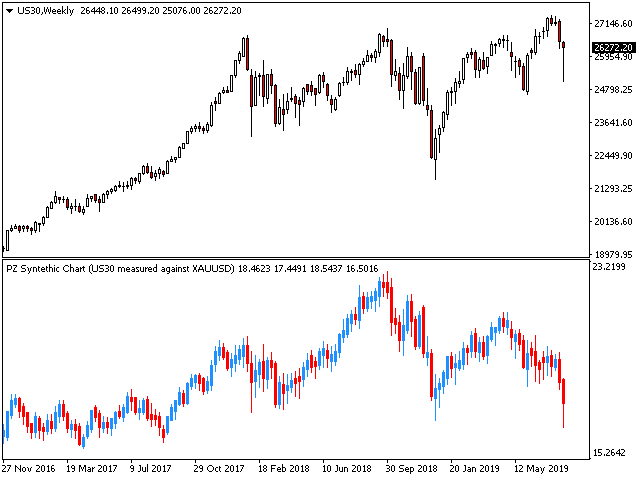
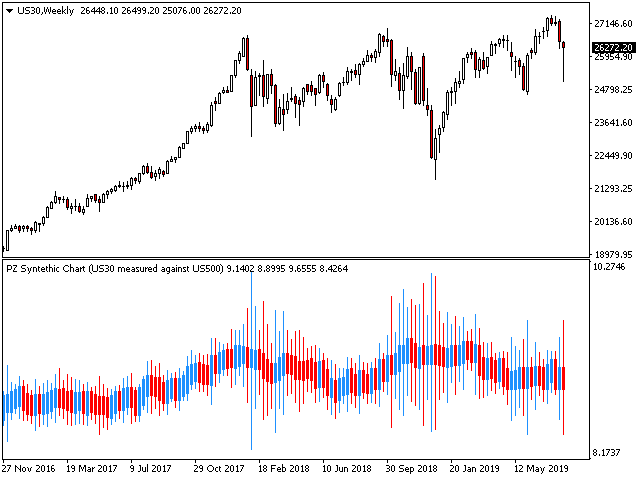
This indicator creates synthetic charts. It creates a candlestick chart plotting the price of one instrument measured against another, helping you to find hidden opportunities in the market crossing relationships between different instruments. [ Installation Guide | Update Guide | Troubleshooting | FAQ | All Products ]
- Find hidden trading opportunities
- Get a broader sense of the price of commodities
- Commodities range against each other and are easier to trade
- Correlated Indices can be traded against each other easily
- Your imagination is the limit with this indicator
For instance, this indicator can plot....
- The price of Dow Jones in Gold Ounzes
- The price of Dow Jones in SP500 shares
- The price of Oil in Silver Ounzes
- The price of Oil in bushels of Corn
- The price of Cattle in tonnes of Copper
- And endless other combinations!
For the indicator to display properly, please run on a white chart template or change the indicator white buffers to black.
Input Parameters
Input Parameters
- 1st Symbol: Type the native symbol of the chart to be plotted. For example, XAUUSD.
- 2nd Symbol: Type the reference symbol of the chart to be plotted. For example, XAGUSD.
Author
Arturo Lopez Perez, private investor and speculator, software engineer and founder of Point Zero Trading Solutions.


