Session Volume Profile Forex MT4
- Göstergeler
- Farkhat Guzairov
- Sürüm: 1.3
- Güncellendi: 2 Kasım 2020
- Etkinleştirmeler: 5
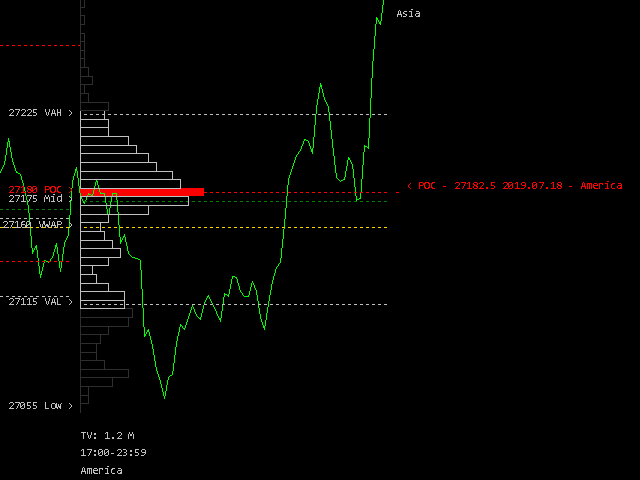
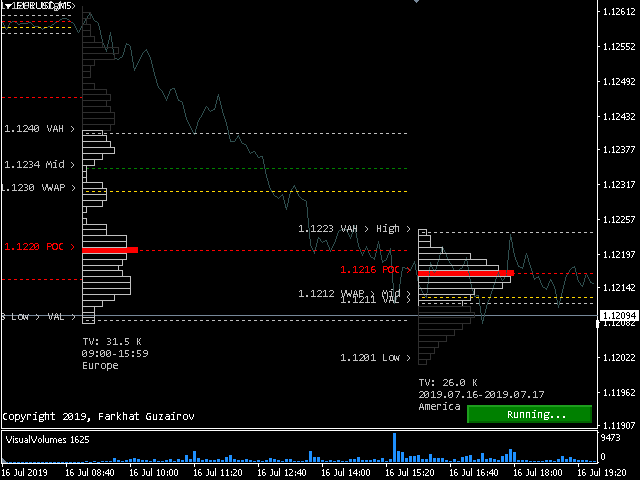
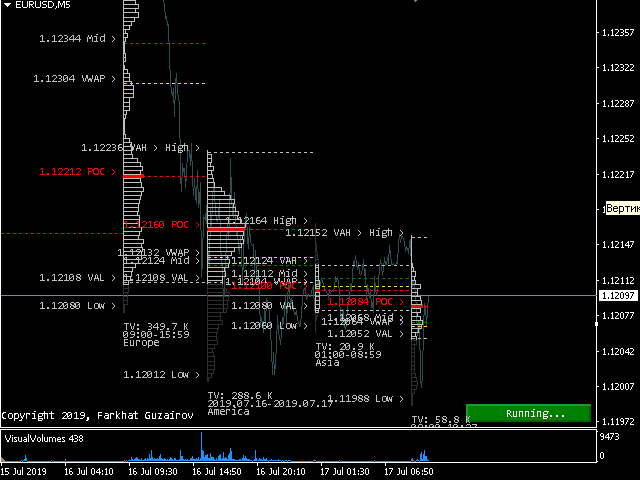
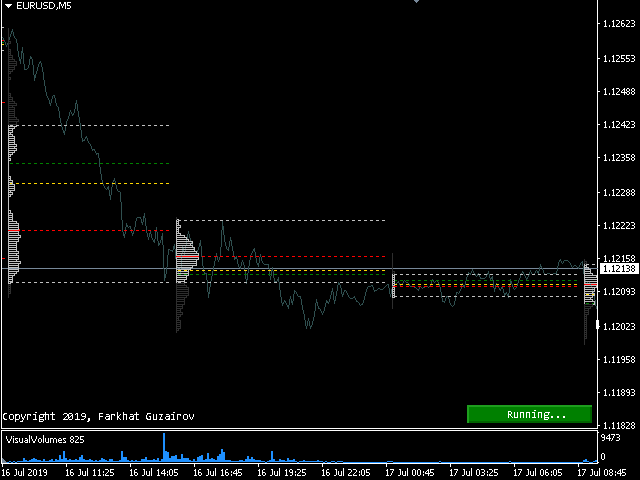
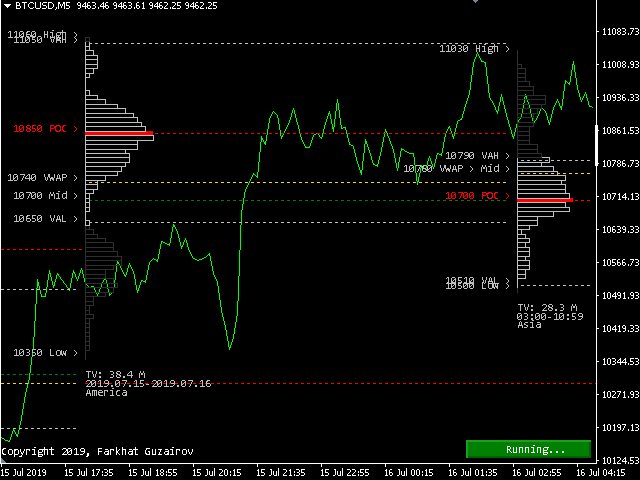
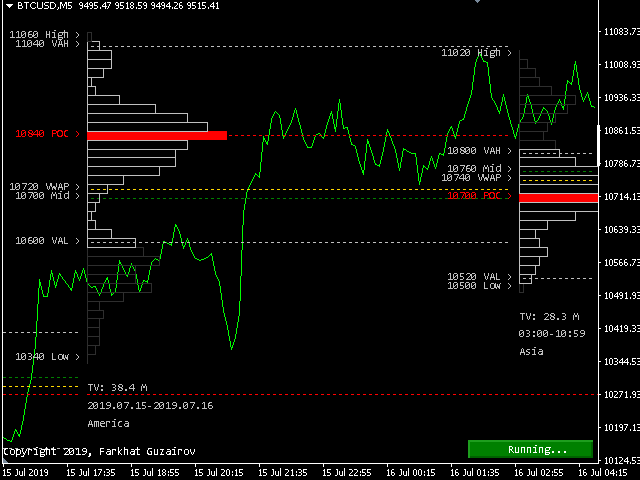
Session Volume Profile is an advanced graphical representation that displays trading activity during Forex trading sessions at specified price levels.
The Forex market can be divided into four main trading sessions: the Australian session, the Asian session, the European session and the favorite trading time - the American (US) session.
POC - profile can be used as a support and resistance level for intraday trading.
VWAP - Volume Weighted Average Price.
ATTENTION!
- For the indicator to work, a history of M1 is required, the deeper and fuller it is, the more qualitatively the profile will be built. The story should be downloaded only by your broker !
- The use of the indicator in automated systems is not possible for technical reasons.
- If the RedrawObjects parameter is set to false , then after restarting Terminal.exe, previously created profiles will not be rebuilt, the construction of profiles will begin from the closing date of Terminal.exe .
The indicator includes 3 types of profile:
- VisualVolume - Volume based on the Volume Indicator for MT4, visually shows the strength of the market. Unlike standard Volumes, it filters tick volume noise.
- TickVolume - Standard tick volume from MT4.
- Price - Tick price.
Input parameters:
- TypeProfile - profile types;
- DigitsSet - the number of decimal digits that determine the accuracy of the price of the current chart symbol.
- Width - width (DigitsSet dialing step)
- ShiftOn(Days to look back) - number of days (history)
- Histogramdepth - depth of the histogram, if there is little data (1.0..more) / a lot (less> 0.0..1.0), this parameter allows you to strengthen or weaken the visual representation of the profile
- HistogramFill - filling the histogram with the current profile color
- FirstSession - the first session
- FirstOffSet - the first session profile offset in time relative to the broker's server time
- SecondSession - second session
- SecondOffSet - offset of the profile of the second session in time relative to the time of the broker server
- ThirdSession - third session
- ThirdOffSet - offset of the third session profile in time relative to the broker's server time
- FourthSession - Fourth Session
- FourthOffSet - offset of the fourth session profile in time relative to the broker's server time
- ShowPOC - shows VPOC trace line
- ShowVAHighAndLow - shows the VA boundaries of the maximum and minimum lines
- ShowMid - the average value of the profile volume
- ShowVWAP - Weighted Average Price (VWAP)
- BorderType - type of drawing price boundaries (POC, VAHighAndLow, Mid, VWAP)
- ValueAreaRange - range of region values [%]
- ColorSchemeProfile - profile color schemes
- ColorSchemeProfileValueArea - profile color schemes
- ColorSchemeProfileVPOC - profile color schemes
- ColorSchemeProfileMid - profile color schemes
- ColorSchemeProfileVWAP - profile color schemes
- ShowInfo - show profile statistics
- RedrawObjects - redrawing objects on a chart
- Font - font name
- FontSize - font size
A brief guide to setting up the indicator for testing in the MT4 Strategy Tester.
- The DigitsSet variable can take values from Digit0 to Digit5. It is important to set the value of the DigitsSet variable to one bit less than the bit depth of the instrument itself, in some cases two digits less. (Example: EURUSD has Digits = 5, in this case the variable DigitsSet = Digit4 or less)
- The Width variable can take a value from x1 to x20. The variable defines the width of the price range and is calculated relative to the value of the DigitsSet variable. The smaller the Width value, the more visually the profile image will be expressed.
- The ShiftOn/Days to look back variable can take a value from 0 or more. This is a shift in the history of quotes, if ShiftOn/Days to look back = 0, the profiles of the current day will be built.
- The IntradayTimeFrame variable can take a value from M5 to D1. This is the time frame within which the profile will be built.
Example! EURUSD has Digits = 5, set the following values:
- DigitsSet = Digit4
- Width = x1
- ShiftOn/Days to look back = 0
- IntradayTimeFrame = D1