• Genel bakış
  • İncelemeler
  • Yorumlar

AIS Optimal Stop Levels

Choosing the levels of StopLoss and TakeProfit can have a very strong impact on the overall performance of trading. In addition to the obvious parameters of a trade transaction - the size of a possible win or probable loss - the levels of StopLoss and TakeProfit also affect the expected duration of the transaction, and the profitability of trading in general.
If you have already determined the optimal transaction duration using the “AIS-ODT” script, then you can begin to determine the parameters associated with the StopLoss and TakeProfit levels.
To do this, we proceed as follows. First, we will determine all possible price deviations in one direction or another, and calculate the probabilities of achieving them within a certain time. After that, you can calculate the most optimal levels of StopLoss and TakeProfit, given their size, probability and expected value of profit.
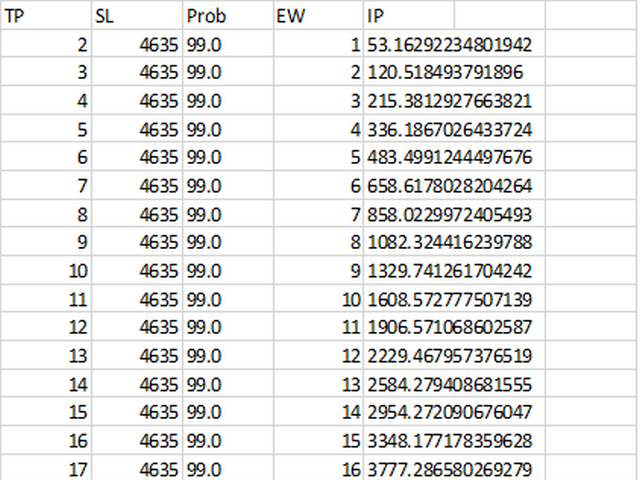
To do this, run the script on the chart of the currency pair of interest and the desired timeframe. Using the ILB parameter in the properties window, set the desired duration of the trading position, expressed in the number of bars. During the work of the utility, data on the entire history is analyzed, and the most optimal values ​​are selected. At the end of the script, two files are formed - “Buy.csv” and “Sell.csv”, containing tables with the results obtained - Figure 1.
In the first column of the table, the possible TakeProfit size is indicated, in the second, the best StopLoss size. The third column shows the probability of winning with these parameters in percent, the fourth indicates the expected profit in a transaction, expressed in points. The fifth column of the table contains an integral indicator of efficiency, which you should be guided by when choosing the StopLoss and TakeProfit levels - the bigger the better.
As can be seen in Figure 2, there is always an optimal ratio, adhering to which we can hope to get the best results in trade.


Önerilen ürünler
Second Level Candles And Alligator Indicators 每12秒产生一个K线,而且自带Alligator指标,对超短线选手交易非常有帮助。程序启动时可能不成功,是因为MT5 MqlTick 数据加载少的原因。可以通过修改显示的数据参数避免,比如display=100,程序正常之后再将参数调大 display=300 。如果数据不正常,也可以采用重新加载的方式解决。 如果您对这个指标有任何建议,请联系作者。  Second Level Candles And Alligator Indicators  produced a candle per 12 seconds,include Alligator, it's helpful to Short-Term Trading。You'd better reload the indicator every start MT5 or change display parameter to reslove data bug. Please attach author when  you had some su
FREE
The idea of the system is to indentify the reversal patterns using the calculation of the composite candle. The reversal patterns is similar to the "Hammer" and "Hanging Man" patterns in Japanese candlestick analysis. But it uses the composite candle instead the single candle and doesn't need the small body of the composite candle to confirm the reversal. Input parameters: Range - maximal number of bars, used in the calculation of the composite candle. Minimum - minimal size of the composite can
FREE
Are you tired of drawing trendlines every time you're analyzing charts? Or perhaps you would like more consistency in your technical analysis. Then this is for you. This indicator will draw trend lines automatically when dropped on a chart. How it works Works similar to standard deviation channel found on mt4 and mt5. It has 2 parameters: 1. Starting Bar 2. Number of bars for calculation The   starting bar   is the bar which drawing of the trend lines will begin, while the   number of bars for c
FREE
A simple button to completely close all existing open trades (both Buy and Sell) on the current chart . Warning : Once the button is pressed, all open trades on the current chart will be deleted immediately without any more questions or dialogue. Use this utility very carefully. We recommend that you do a trial of removing open trades on a demo account first, before trying to use this utility on a real account.
FREE
Free automatic Fibonacci is an indicator that automatically plots a Fibonacci retracement based on the number of bars you select on the BarsToScan setting in the indicator. The Fibonacci is automatically updated in real time as new highest and lowest values appears amongst the selected bars. You can select which level values to be displayed in the indicator settings. You can also select the color of the levels thus enabling the trader to be able to attach the indicator several times with differe
FREE
Follow The Line MT5
Oliver Gideon Amofa Appiah
4.52 (29)
This indicator obeys the popular maxim that: "THE TREND IS YOUR FRIEND" It paints a GREEN line for BUY and also paints a RED line for SELL. (you can change the colors). It gives alarms and alerts of all kinds. IT DOES NOT REPAINT and can be used for all currency pairs and timeframes. Yes, as easy and simple as that. Even a newbie can use it to make great and reliable trades. NB: For best results, get my other premium indicators for more powerful and reliable signals. Get them here: https://www.m
FREE
SX Theme Setter is intended for changing chart appearance in 2 modes: - Gradient background mode: In this mode, the indicator creates a gradient background for your chart. Colors, steps and gradient type can be selected by user. - Color theme: Color theme mode provides more than 50 built-in different color themes which can be selected from a list. Most of these themes are converted from official color themes of real trading platforms of the past and present. Try them out and see if they suit
FREE
Discover the power of automated trading with **SimpleTradeGioeste**, an Expert Advisor (EA) designed to optimize your trading operations in the Forex market. This innovative EA combines advanced trading strategies with proven technical indicators, offering an unparalleled trading experience. video backtest :  https://youtu.be/OPqqIbu8d3k?si=xkMX6vwOdfmfsE-A ****Strengths**** - **Multi-Indicator Strategy**: SimpleTradeGioeste employs an integrated approach that combines four main technical ind
FREE
This is a buyer and seller aggression indicator that analyzes the shape of each candle and project this data in a histogram form. There are 4 histograms in one. On the front we have two: Upper - Buyer force. Lower - Seller force. At the background we also have two histogram, both with same color. They measure the combined strenght of buyers and sellers. This histograms can be turned off in Input Parameters. It is also possible to have the real or tick volume to help on this force measurement. IN
FREE
ToolBot Probabilistic Analysis - FREE   An effective indicator for your negotiations The toolbot indicator brings the calculation of candles and a probabilistic analysis so that you have more security on your own. Also test our  FREE tops and bottoms indicator: :   https://www.mql5.com/pt/market/product/52385#description Also test our  FREE (RSI, ATR, ADX, OBV) indicator:   https://www.mql5.com/pt/market/product/53448#description Try our EA ToolBot for free:   https://www.mql5.com/market/prod
FREE
İndikatör   "Haven Key Levels PDH PDL"   trader'ların grafik üzerinde anahtar seviyeleri görselleştirmelerine yardımcı olur. Aşağıdaki seviyeleri otomatik olarak işaretler: DO (Daily Open)   — Günün açılış seviyesi. NYM (New York Midnight)   — New York gece yarısı seviyesi. PDH (Previous Day High)   — Önceki günün en yüksek seviyesi. PDL (Previous Day Low)   — Önceki günün en düşük seviyesi. WO (Weekly Open)   — Haftalık açılış seviyesi. MO (Monthly Open)   — Aylık açılış seviyesi. PWH (Previou
FREE
AT Scalper
Maruthupandiyan
2.5 (2)
AT Scalper  Helps trader to place order seamlessly  Close mulitple position at a time Place SL or TP for multiple position in a click Place hedge order same time with predefined SL and TP Place multi layer pending order in a click Place martingale layer Be informed about SL and TP in currency Get to know time remaining in current candle Get to know current spread View PnL, Balance, Equity on screen
FREE
Introduction Welcome to the world of Forex trading, where every tick of the market can be influenced by news events. Introducing our expert advisor for MetaTrader, your ultimate tool for navigating the complexities of news trading. This innovative advisor is specifically designed to automate your trading strategy during key macroeconomic releases, ensuring you never miss an opportunity.  When important indicators are announced, volatility often spikes, creating potential for profit. Our expert
FREE
Golden Square X
Huynh Tan Linh N
5 (4)
This is my latest Free version for Gold. With optimized parameters and user-friendly features, this version is likely very easy to use and highly effective. You can customize TP and SL parameters as you wish, but the default settings should work well for you without the need for further adjustments.  This version is designed for the M5. This version does not require a large capital investment; only $100-$200 is sufficient for Golden Square X to run and generate profits for you. Based on backtest
FREE
Value Chart Candlesticks
Flavio Javier Jarabeck
4.73 (11)
The idea of a Value Chart indicator was presented in the very good book I read back in 2020 , " Dynamic Trading Indicators: Winning with Value Charts and Price Action Profile ", from the authors Mark Helweg and David Stendahl. The idea is simple and the result is pure genius: Present candlestick Price analysis in a detrended way! HOW TO READ THIS INDICATOR Look for Overbought and Oversold levels. Of course, you will need to test the settings a lot to find the "correct" one for your approach. It
FREE
Coral Indi
Dinh Duong Luong
Coral trend is   a trend-following indicator that is widely popular among FOREX traders . It is usually used as a confluence with other indicators. It uses combinations of moving averages with complex smoothing formulas! It has two configurable parameters: Coefficient   - smoothing ratio (*) Applied price Calculation: Coral = (-0.064) * B6 + 0.672 * B5 - 2.352 * B4 + 2.744 * B3
FREE
LT Donchian Channel
Thiago Duarte
4.83 (6)
Donchian Channel is an indicator created by Richard Donchian. It is formed by taking the highest high and the lowest low of the last specified period in candles. The area between high and low is the channel for the chosen period. Its configuration is simple. It is possible to have the average between the upper and lower lines, plus you have alerts when price hits one side. If you have any questions or find any bugs, please contact me. Enjoy!
FREE
Super Trend Alert Indicator for MT5 is a powerful tool designed to help traders identify and follow market trends with precision. This indicator uses a proprietary algorithm to analyze price movements and provide clear trend signals, making it suitable for traders across all experience levels. You can find the MT4 version here Key features of the Super Trend Indicator include: Advanced trend analysis with real-time market scanning to detect potential trend directions. Real-time alerts that not
FREE
Weis Waves
Flavio Javier Jarabeck
2.83 (18)
The original author is David Weis, an expert in the Wyckoff Method. The Weis Wave is a modern adaptation of the 1930's Wyckoff Method, another expert in Tape Reading techniques and Chart Analysis. Weis Waves takes market volume and stacks it into waves according to price conditions giving the trader valuable insights about the market conditions. If you want to learn more about this subject you can find tons of videos in YouTube. Just look for "The Wickoff Method", "Weis Wave" and "Volume Spread
FREE
Revolution martingale
Yaroslav Varankin
5 (3)
Revolution Martingale is an indicator designed for trading binary options on the M5 timeframe. Features: M5 Timeframe: It is recommended to use the indicator on the M5 timeframe for optimal trading. Trade Entry: Trades should only be opened on the first candle after a signal appears. Signals: A blue diamond indicates a buying opportunity for upward movement, while a red diamond indicates a buying opportunity for downward movement. Configured for Effective Binary Options Trading: The indicator i
FREE
Bar Color Trend
Germano Chagas
4.38 (8)
Combining the best of Price Action , Directional Movement , and Divergence/Convergence analysis, Candle Color Trend is a easy and reliable way to identify trend direction. The indicator automatically paints the candles according to the assumption that an uptrend is defined by prices that form a series of higher highs and higher lows. In contrast, a downtrend is defined by prices that form a series of lower highs and lower lows. Additionally, ADX Wilder indicator is used to measure trend weakness
FREE
Mitimom
Danil Poletavkin
The indicator is based on Robert Miner's methodology described in his book "High probability trading strategies" and displays signals along with momentum of 2 timeframes. A Stochastic oscillator is used as a momentum indicator. The settings speak for themselves period_1 is the current timeframe, 'current' period_2 is indicated - the senior timeframe is 4 or 5 times larger than the current one. For example, if the current one is 5 minutes, then the older one will be 20 minutes The rest of the s
FREE
This indicator is a zero-lag indicator and displays  strength of trend change . True Trend  Oscillator Pro works best in combination with True Trend Moving Average Pro that displays exact trend as is. Oscillator value is exact price change in given direction of the trend. True Trend Moving Average Pro: https://www.mql5.com/en/market/product/103586 If you set PERIOD input parameter to 1 this indicator becomes a sharpshooter for binary options. Developers can use True Trend Oscillator in Exper
FREE
Haven FVG Indicator
Maksim Tarutin
5 (1)
Gösterge   Haven FVG   , piyasaları analiz etmek için bir araçtır ve grafikte verimsizlik alanlarını (Fair Value Gaps, FVG) tanımlamanıza olanak tanır, böylece tüccarlara fiyat analizi ve ticari kararlar almak için anahtar seviyeler sağlar. Diğer ürünler ->  BURADA Ana Özellikler: Bireysel renk ayarları: Alış FVG rengi   (Bullish FVG Color). Satış FVG rengi   (Bearish FVG Color). Esnek FVG görselleştirme: FVG aramak için maksimum mum sayısı. FVG bölgelerinin belirli bir bar sayısı kadar ek uzat
FREE
The Moving Average Convergence Divergence (MACD) işlem stratejisi, momentum ve trend yönündeki değişiklikleri belirlemek için kullanılan popüler bir teknik analiz aracıdır. MACD, 26 periyotlu üssel hareketli ortalamanın (EMA) 12 periyotlu EMA'dan çıkarılmasıyla hesaplanır. Ardından, "sinyal çizgisi" olarak adlandırılan 9 periyotlu EMA MACD'nin üzerine çizilir ve alım satım sinyalleri için bir tetikleyici olarak görev yapar. MACD, MACD hattı sinyal çizgisinin üzerindeyken boğa bölgesinde ve altın
FREE
Rainbow MT5
Jamal El Alama
4 (1)
Description : Rainbow MT5 is a technical indicator based on Moving Average with period 34 and very easy to use. When price crosses above MA and MA changes color to green, then this is a signal to buy. When price crosses below MA and MA changes color to red, then this is a signal to sell. The Expert advisor ( Rainbow EA MT5 ) based on Rainbow MT5 indicator is now available here . MT4 version is available here .
FREE
Renko Expert Advisor based on Renko bar simulation.    The EA has two options for building Renko bars. Classic and ATR. In the classic version, renko bars are marked with areas on the main chart; in the ATR version, renko bars are modeled and drawn in the indicator window. Modeling renko bars inside the EA allows you to optimize the robot better than drawing renko bars offline.      Telegramm channel   Set file Our second robot RENKOTREND Does not use martingale!  Trades opened by the robot com
FREE
Have you missed any tools or shortcuts in Meta Trader? Simple things that would make your daily trading much easier ? We have the solution for you: our Trade Panel! This is an EA tool (Expert Advisor) that, if configured to controll all symbols, needs to be loaded only once. This is the Lite version (free) of our tool. Professional version:   https://www.mql5.com/en/market/product/42658 If you have some problemas with the shortcut buttons on chart on unpinned mode try change the tickets digi
FREE
Short description : TheTrendHunterMax   is a LIMITED VERSION tool that can be used either as a trading robot for automated trading or just a signal provider for manual trading.  As an EA, it uses the techniques we usually employ in trading like determining the highs and lows on the trading chart. With this, it determines the trend convergence and divergence in the chart. Combined with the volatility, price movements, it analyzes the possible order type that can be most profitable. By default,
FREE
Advanced Trade Mirror   is a powerful Forex tool designed for traders who need instant, seamless trade replication across multiple terminals on the same machine. With lightning-fast execution, it ensures zero lag in copying trades, maintaining precision and efficiency in high-speed trading environments. Get the Trade Mirror Master here:  https://www.mql5.com/en/market/product/133891 Specification: Master ID: Identity value of master terminal, please use a unique value to prevent duplicated mas
FREE
Bu ürünün alıcıları ayrıca şunları da satın alıyor
Trade Assistant MT5
Evgeniy Kravchenko
4.41 (177)
It helps to calculate the risk per trade, the easy installation of a new order, order management with partial closing functions, trailing stop of 7 types and other useful functions. Additional materials and instructions Installation instructions - Application instructions - Trial version of the application for a demo account Line function -   shows on the chart the Opening line, Stop Loss, Take Profit. With this function it is easy to set a new order and see its additional characteristics bef
Trade Manager EA’ye hoş geldiniz! Ticaretin daha sezgisel, hassas ve verimli hale gelmesi için tasarlanmış nihai risk yönetim aracı ile tanışın. Bu sadece bir emir verme aracı değil; ticaret planlaması, pozisyon yönetimi ve risk kontrolü için kapsamlı bir çözüm. İster yeni başlayan bir yatırımcı olun, ister deneyimli bir trader ya da hızlı emir gerektiren bir scalper, Trade Manager EA ihtiyaçlarınıza uyum sağlar ve forex, endeksler, emtialar ve kripto paralar dahil tüm piyasalarda esneklik sunar
TradePanel MT5
Alfiya Fazylova
4.85 (126)
Ticaret Paneli çok işlevli bir ticaret asistanıdır. Uygulama, manuel ticaret için 50'den fazla ticaret işlevi içerir ve çoğu ticaret işlemini otomatikleştirmenize olanak tanır. Dikkat, uygulama strateji test cihazında çalışmıyor. Satın almadan önce demo sürümünü bir demo hesabında test edebilirsiniz. Demo sürümü burada . Talimatların tamamı buraya . Ticaret. Tek tıklamayla alım satım işlemlerini gerçekleştirmenizi sağlar: Otomatik risk hesaplaması ile bekleyen emir ve pozisyonları açın. Tek tıkl
Local Trade Copier EA MT5
Juvenille Emperor Limited
4.98 (86)
Local Trade Copier EA MT5   ile olağanüstü hızlı işlem kopyalama deneyimi yaşayın. Kolay 1 dakikalık kurulumuyla bu işlem kopyalayıcısı, aynı Windows bilgisayarda veya Windows VPS'te birden fazla MetaTrader terminali arasında işlemleri kopyalamanıza olanak tanır ve 0.5 saniyenin altındaki şimşek hızında kopyalama hızları sunar. Başlangıç seviyesinde veya profesyonel bir tüccar olsanız da,   Local Trade Copier EA MT5 , spesifik ihtiyaçlarınıza göre özelleştirmek için geniş bir seçenek yelpazesi s
The product will copy all telegram signal to MT5 ( which you are member) , also it can work as remote copier.  Easy to set up, copy order instant, can work with almost signal formats, image signal,  s upport to translate other language to English Work with all type of channel or group, even channel have "Restrict Saving Content", work with  multi channel, multi MT5 Work as remote copier: with signal have ticket number, it will copy exactly via ticket number. Support to backtest signal. How to s
Tired of complex order placement and manual calculations? Trade Dashboard is your solution. With its user-friendly interface, placing orders becomes effortless, by a single click, you can open trades, set stop loss and take profit levels, manage trade lot size, and calculate risk to reward ratios, allowing you to only focus on your strategy. Say goodbye to manual calculations and streamline your trading experience with Trade Dashboard. Download  Demo Version  right now. You can find  Details of
MT5 to Telegram Signal Provider , hesabınızı bir sinyal sağlayıcı haline getirerek belirtilen sinyalleri Telegram'ın sohbetine, kanalına veya grubuna göndermeyi sağlayan kullanımı kolay, tamamen özelleştirilebilir bir araçtır. Rakip ürünlerin çoğunun aksine, DLL içe aktarması yapmaz. [ Demo ] [ Kılavuz ] [ MT4 Versiyonu ] [ Discord Versiyonu ] [ Telegram Kanalı ] Kurulum Adım adım bir kullanıcı kılavuzu mevcuttur. Telegram API'si hakkında bilgi gerekmemektedir; ihtiyacınız olan her şey geliştir
DİKKAT : Bu uzman danışman Strategy Tester'da çalışmaz. Deneme sürümü için profilimi ziyaret edin. Kullanım Kılavuzu Otomatik günlüğü indirmek için profilimi ziyaret edin RiskGuard Management – Tavizsiz Profesyonel Trading RiskGuard Management, kârı maksimize etmek ve zararı minimize etmek isteyen her trader için nihai çözümdür. Bu sadece bir araç değil, aynı zamanda akıllı bir sistemdir . Trading planınıza sadık kalmanıza, duygusal hatalardan kaçınmanıza ve maksimum verimlilikle işlem yapmanız
Cerberus Equity Watcher
Samuel Bandi Roccatello
5 (3)
Cerberus the Equity Watcher , hesap öz sermayenizi sürekli olarak izleyen ve hatalı EA'ların veya isteğe bağlı bir tüccarsanız duygusal davranışınızın neden olduğu büyük düşüşlerden kaçınan bir risk yönetimi aracıdır. Hatalar içerebilecek veya beklenmedik piyasa koşullarında iyi performans göstermeyebilecek EA'lara güvenen sistematik tüccarlar için son derece yararlıdır. Cerberus, bir minimum öz sermaye değeri ve (isteğe bağlı olarak) bir maksimum değer belirlemenize izin verir, bunlardan herhan
Riskinizi otomatik olarak hesaplarken işlemlere hızlı bir şekilde girip çıkmanıza yardımcı olacak Ticaret Yöneticisi. Aşırı Ticaret, İntikam Ticareti ve Duygusal Ticaretten korunmanıza yardımcı olacak özellikler içerir. İşlemler otomatik olarak yönetilebilir ve hesap performans ölçümleri bir grafikte görselleştirilebilir. Bu özellikler, bu paneli tüm manuel yatırımcılar için ideal kılar ve MetaTrader 5 platformunun geliştirilmesine yardımcı olur. Çoklu Dil desteği. MT4 Sürümü  |  Kullanım Kılavu
Grid Manual MT5
Alfiya Fazylova
4.89 (18)
Grid Manual, sipariş ızgarasıyla çalışmak için kullanılan bir ticaret yardımcı programıdır. Yardımcı program evrenseldir, esnek ayarlara ve sezgisel bir arayüze sahiptir. Sadece kayıpların ortalaması yönünde değil, aynı zamanda kazanç artışı yönünde de bir emir ızgarası ile çalışır. Tüccarın bir emir ızgarası oluşturmasına ve eşlik etmesine gerek yoktur, bu yardımcı programı yapacaktır. Emri açmanız yeterlidir ve Grid manual otomatik olarak ona bir emir ızgarası oluşturacak ve kapanana kadar ona
Çok amaçlı araçlar: Lot hesaplayıcı, fiyat analizi, risk/ödül oranı, pozisyon yönetici, arz  talep bölgelerini de içeren 66'den fazla fonksiyon Deneme sürümü   |   Kullanım Kılavuzu   |   MT4 Yardımcı program, strateji test cihazında çalışmaz: Ürünü test etmek için Demo Sürümünü BURADAN indirebilirsiniz. Sorularınız için iletişim İşlem sürecinizi kolaylaştırın, hızlandırın ve otomatikleştirin. Terminalin standart  özelliklerini bu program ile genişletin Yeni işlem açma : Lot / Risk / Risk/Ödül h
Custom Alerts: Birden Fazla Piyasayı İzleyin ve Hiçbir Önemli Fırsatı Kaçırmayın Genel Bakış Custom Alerts , birden fazla enstrümandaki potansiyel setupları merkezi bir şekilde takip etmek isteyen traderlar için dinamik bir çözümdür. FX Power, FX Volume ve IX Power gibi önde gelen araçlarımızın verilerini bütünleştirerek Custom Alerts , birden fazla grafikle uğraşmadan veya kritik fırsatları kaçırma riskine girmeden, piyasadaki önemli değişiklikleri otomatik olarak size bildirir. Daha akıllı v
Exp COPYLOT CLIENT for MT5
Vladislav Andruschenko
3.9 (31)
MT5 için ticari kopyalayıcı, МetaТrader 5 platformu için bir ticari kopyalayıcıdır   . arasındaki   forex işlemlerini kopyalar.       COPYLOT MT5 sürümü için   herhangi bir hesap   MT5   -   MT5, MT4   -   MT5 (veya COPYLOT MT4 sürümü için   MT4 -   MT4 MT5   -  MT4) Güvenilir fotokopi makinesi! MT4 sürümü Tam tanım   +DEMO +PDF Nasıl alınır Nasıl kurulur     Günlük Dosyaları nasıl alınır?     Nasıl Test Edilir ve Optimize Edilir     Expforex'in tüm ürünleri Ayrıca МТ4 terminali   (МТ4   -  
YuClusters
Yury Kulikov
4.93 (41)
Attention: You can view the program operation in the free version  YuClusters DEMO .  YuClusters is a professional market analysis system. The trader has unique opportunities to analyze the flow of orders, trade volumes, price movements using various charts, profiles, indicators, and graphical objects. YuClusters operates on data based on Time&Sales or ticks information, depending on what is available in the quotes of a financial instrument. YuClusters allows you to build graphs by combining da
Trade copier MT5
Alfiya Fazylova
4.53 (30)
Trade Copier, ticaret hesapları arasındaki işlemleri kopyalamak ve senkronize etmek için tasarlanmış profesyonel bir yardımcı programdır. Kopyalama, tedarikçinin hesabından/terminalinden alıcının aynı bilgisayarda veya vps'de kurulu olan hesabına/terminaline gerçekleşir. Satın almadan önce demo sürümünü bir demo hesabında test edebilirsiniz. Demo versiyonu burada . Tüm talimatlar burada . Ana işlevler ve avantajlar: Emirlerin kopyalanmasını destekler: МТ5> МТ5, МТ4> МТ5, МТ5> МТ4. Emirlerin kopy
Üye olduğunuz herhangi bir kanaldan (özel ve kısıtlı olanlar dahil) sinyalleri doğrudan MT5'inize kopyalayın.  Bu araç, kullanıcıyı göz önünde bulundurarak tasarlanmış olup işlemleri yönetmek ve izlemek için ihtiyacınız olan birçok özelliği sunar. Bu ürün, kullanıcı dostu ve görsel olarak çekici bir arayüzde sunulmaktadır. Ayarlarınızı özelleştirin ve ürünü dakikalar içinde kullanmaya başlayın! Kullanıcı Kılavuzu + Demo  | MT4 Sürümü | Discord Sürümü Demo denemek isterseniz lütfen kullanıcı kı
Community, update news, feature discussions, complaints, suggestions, and first-line support are organized in a free Discord server . Use   Webmoney  to pay in crypto. Lazy Trader is your personal risk management assistant that independently finds the best market entries, manages positions, and helps you extract maximum profit from every trading idea! It monitors charts from M1 to W1 , finds optimal entry points based on your parameters, and manages trades without your involvement: -   Got a
2025 happy new year -25% discount ($199 -> $149) Advanced trading tool: One click smart orders that execute under your conditions Developed by trader for trading community:  position size calculator (lot size), open position after price action, strategy builder, set and forget trading, mobile notifications... Risk Management -  Risk percentage position size calculator, gain percentage, target risk reward ratio, spread and commissions are included in calculations 7 Advanced order types  - Set a
KT Equity Protector MT5
KEENBASE SOFTWARE SOLUTIONS
4.67 (3)
Yatırım Sermayenizi Zahmetsizce Koruyun Yatırım sermayenizi korumak, onu büyütmek kadar önemlidir. KT Equity Protector, kişisel risk yöneticiniz olarak hesabınızın öz sermayesini sürekli izler ve önceden belirlenmiş kar hedeflerine veya zarar durdur seviyelerine ulaşıldığında tüm açık ve bekleyen emirleri kapatarak kayıpları önler veya karları güvence altına alır. Duygusal kararlar yok, tahmin yürütmeye gerek yok — sadece sizin yerinize yorulmadan çalışan güvenilir bir sermaye koruma sistemi. KT
OrderManager 'ı Tanıtıyoruz: MT5 için Devrim Niteliğinde Bir Yardımcı Program Yepyeni Order Manager yardımcı programı ile MetaTrader 5 için işlemlerinizi bir profesyonel gibi yönetin. Basitlik ve kullanım kolaylığı göz önünde bulundurularak tasarlanmış olan Order Manager, her işlemle ilişkilendirilen riski kolayca tanımlamanıza ve görselleştirmenize olanak tanır, böylece bilinçli kararlar alabilir ve ticaret stratejinizi optimize edebilirsiniz. OrderManager hakkında daha fazla bilgi için lütfen
DrawDown Limiter
Haidar, Lionel Haj Ali
5 (20)
Drawdown Limiter EA You are in the right place if you were searching for Drawdown control, Drawdown limiter, Balance protection, Equity Protection or Daily Drawdown Limit related to Prop Firm, FTMO, or Funded account trading, or if you want to protect your trading account. Have you suffered from controlling your drawdown when trading funded accounts? This EA is meant for you. Prop firms usually set a rule called “Trader Daily Drawdown”, and if it is not respected, you are disqualified.  I am an
The Expert Advisor is a risk manager helping users to control their trading. In the settings, it is possible to specify the parameters at which the risk manager force closes the opened trades and closes the terminal as well, if it is needed to prevent opening trades on emotions, which do not correspond to the trading strategy. Risk Manager settings Check limit to close   - check the equity limit Limit to close   - minimum account equity triggering loss prevention measures Check day limit to cl
Equity Protect Pro: Endişesiz İşlem İçin Kapsamlı Hesap Koruma Uzmanınız Hesap koruması, öz sermaye koruması, portföy koruması, çoklu strateji koruması, kar koruması, kar toplama, işlem güvenliği, risk kontrol programları, otomatik risk kontrolü, otomatik tasfiye, koşullu tasfiye, planlı tasfiye, dinamik tasfiye, iz süren stop loss, tek tıklamayla kapatma, tek tıklamayla tasfiye ve tek tıklamayla geri yükleme gibi özellikler arıyorsanız, Equity Protect Pro ihtiyacınız olan programdır. Kurulumu
Seconds Chart — MetaTrader 5 için saniye bazlı grafikler oluşturmanıza olanak sağlayan eşsiz bir araçtır. Seconds Chart sayesinde saniye cinsinden zaman dilimleriyle grafik oluşturabilir, standart dakika veya saatlik grafiklerde mümkün olmayan esneklik ve analiz hassasiyetine ulaşabilirsiniz. Örneğin, S15 zaman dilimi 15 saniyelik mum çubuklarını ifade eder. Tüm indikatörleri, uzman danışmanları ve komut dosyalarını standart grafiklerde olduğu gibi kolaylıkla kullanabilirsiniz. Standart araçları
Local Trade Copier EA , bir MAM veya PAMM hesabına ihtiyaç duymadan, harici kaynaklardan ticaret sinyalleri yürütmesi veya aynı anda birkaç hesabı yönetmesi gereken bireysel tüccarlar veya hesap yöneticileri için bir çözümdür. 8 ana hesaptan sınırsız bağımlı hesaba kopyalar [ Kurulum Kılavuzu | Güncelleme Kılavuzu | Sorun Giderme | SSS | Tüm Ürünler ] %100 kendi kendine barındırılan Kurulumu ve kullanımı kolay Hiçbir yükleyici, yapılandırma dosyası, sunucu, bellek kanalı veya DLL kullanılmadı E
1 tıklama ile ticaret için Ticaret Paneli.   Pozisyonlar ve emirlerle çalışmak!   Grafikten veya klavyeden alım satım. Alım satım panelimizi kullanarak, grafikten tek bir tıklamayla alım satım yapabilir ve alım satım işlemlerini standart MetaTrader kontrolünden 30 kat daha hızlı gerçekleştirebilirsiniz. Bir tüccar için hayatı kolaylaştıran ve bir tüccarın ticaret faaliyetlerini çok daha hızlı ve daha rahat gerçekleştirmesine yardımcı olan parametrelerin ve işlevlerin otomatik hesaplamaları. Graf
MT4 için Expert Advisor Risk Manager çok önemli ve bence her yatırımcı için gerekli bir program. Bu Uzman Danışman ile ticaret hesabınızdaki riski kontrol edebileceksiniz. Risk ve kar kontrolü hem parasal hem de yüzdesel olarak yapılabilir. PROMO BUY 1 GET 2 FREE -   https://www.mql5.com/en/blogs/post/754725 Danışman işlevleri Bu risk yöneticisi, riskleri kontrol etmenize yardımcı olacaktır: - bir anlaşma için - günlük - bir hafta için - Bir ay için Ayrıca kontrol edebilirsiniz 1) Ticare
Fotokopi->Kullanışlı ve hızlı arayüz etkileşimi, kullanıcılar hemen kullanabilir       ->>>> Windows bilgisayarlarda veya VPS Windows'ta kullanılması önerilir Özellikler: Çeşitlendirilmiş ve kişiselleştirilmiş kopyalama ticareti ayarları: 1. Farklı sinyal kaynakları için farklı lot modları ayarlanabilir 2. İleri ve geri kopyalama ticareti için farklı sinyal kaynakları ayarlanabilir 3. Sinyaller yorumlarla ayarlanabilir 4. Lotun sözleşme lotuna göre kalibre edilip edilmeyeceği Çeşitlendirilmiş v
-25% discount ($149 -> $111) Everything for chart Technical Analysis indicator mt5 in one tool Draw your supply demand zone with rectangle and support resistance with trendline and get alerts to mobile phone or email alert -  Risk reward indicator mt5 Video tutorials, manuals, DEMO download   here .   Find contacts on my   profile . 1.   Extended rectangles and trendlines Object will be extended to the right edge of the chart when price will draw new candles on chart. This is rectangle extende
Yazarın diğer ürünleri
Choosing the levels of StopLoss and TakeProfit can have a very strong impact on the overall performance of trading. In addition to the obvious parameters of a trade transaction - the size of a possible win or probable loss - the levels of StopLoss and TakeProfit also affect the expected duration of the transaction, and the profitability of trading in general. If you have already determined the optimal transaction duration using the “ AIS-ODT ” script, then you can begin to determine the paramete
FREE
The script is based on the simulation of trade transactions using a random number generator. This allows you to get completely different results, even with the same input parameters. When you run the script, a dialog box opens in which you can set the desired values ​​for external variables. In the Trading options block, the basic parameters that are necessary for trading modeling are defined. Start Balance - sets the initial size of the trade balance. Number Trade - sets the number of trade tr
FREE
MinDeposit
Aleksej Poljakov
5 (1)
The script analyzes the history of quotes and gives recommendations on the minimum deposit. The calculations take into account the variability of prices and the standard deviation. Margin requirements for the instrument are also taken into account. The result of the script is the minimum recommended deposit for trading the given currency pair.
FREE
The script allows selecting the required 'Filter level' value of the AIS-MTF indicator. Run the script on the required chart and selected timeframe. Once its operation is complete, the HPS.csv file will be created in the Files folder. Open the file. You will see three columns. The 'Filter lvl' column represents the value of the 'Filter level' for the AIS-MTF indicator. Am. dev. - degree and direction of the indicator's deviation from the price level (sorted in ascending order). Negative values i
FREE
This script allows selecting the TakeProfit and StopLoss levels. It analyzes the history data, and then calculates the probability of reaching a given price level. How the script works Suppose you have a trading strategy and you want to select the TakeProfit and StopLoss levels. Run the script and set the parameter: Number of Bars - the average position holding time in bars. Once the script operation is complete, the AIS-PPL.csv file will be created in the Files folder in the terminal data cata
FREE
This script is designed so that the trader can determine the average duration of trade transactions, at which the ratio of possible profits and losses will be optimal. First, let's look at the general approach to determining the optimal duration of trade transactions. We introduce the following variables: R   - the result of the transaction; T   - the time during which the transaction was open; W - the time between the closing of the previous transaction and the opening of the next one. Every tr
FREE
The script is based on the simulation of trade transactions using a random number generator. This allows you to get completely different results, even with the same input parameters. When you run the script, a dialog box opens in which you can set the desired values ​​for external variables. In the  Trading options  block, the basic parameters that are necessary for trading modeling are defined. Start Balance  - sets the initial size of the trade balance. Number Trade  - sets the number of trad
FREE
The script allows selecting the required 'Filter level' value of the AIS-MTF MT5 indicator. Run the script on the required chart and selected timeframe. Once its operation is complete, the HPS.csv file will be created in the Files folder. Open the file. You will see three columns. The 'Filter lvl' column represents the value of the 'Filter level' for the AIS-MTF indicator. Am. dev. - degree and direction of the indicator's deviation from the price level (sorted in ascending order). Negative valu
FREE
This script is designed so that the trader can determine the average duration of trade transactions, at which the ratio of possible profits and losses will be optimal. First, let's look at the general approach to determining the optimal duration of trade transactions. We introduce the following variables: R   - the result of the transaction; T   - the time during which the transaction was open; W  - the time between the closing of the previous transaction and the opening of the next one. Every t
FREE
The script analyzes the history of quotes and gives recommendations on the minimum deposit. The calculations take into account the variability of prices and the standard deviation. Margin requirements for the instrument are also taken into account. The result of the script is the minimum recommended deposit for trading the given currency pair.
FREE
This script allows selecting the TakeProfit and StopLoss levels. It analyzes the history data, and then calculates the probability of reaching a given price level. How the script works Suppose you have a trading strategy and you want to select the TakeProfit and StopLoss levels. Run the script and set the parameter: Number of Bars - the average position holding time in bars. Once the script operation is complete, the AIS-PPL.csv file will be created in the Files folder in the terminal data cata
FREE
AIS Doğru Ortalamalar göstergesi, piyasadaki bir trend hareketinin başlangıcını belirlemenizi sağlar. Göstergenin bir diğer önemli kalitesi, trendin sonunun açık bir işaretidir. Gösterge yeniden çizilmez veya yeniden hesaplanmaz. Görüntülenen Değerler h_AE - AE kanalının üst sınırı l_AE - AE kanalının alt sınırı h_EC - Mevcut çubuk için yüksek tahmin edilen değer l_EC - Mevcut çubuk için düşük tahmin edilen değer Gösterge ile çalışırken sinyaller Ana sinyal, AE ve EC kanallarının kesişimid
AIS Ağırlıklı Hareketli Ortalama göstergesi, ağırlıklı bir hareketli ortalama hesaplar ve trend olan bir piyasa hareketinin başlangıcını belirlemenize olanak tanır. Ağırlık katsayıları, her bir çubuğun belirli özellikleri dikkate alınarak hesaplanır. Bu, rastgele piyasa hareketlerini filtrelemenize olanak tanır. Bir trendin başladığını teyit eden ana sinyal, gösterge çizgilerinin yönündeki bir değişiklik ve gösterge çizgilerini geçen fiyattır. WH (mavi çizgi), Yüksek fiyatların ağırlıklı ort
AIS Advanced Grade Fizibilite göstergesi, fiyatın gelecekte ulaşabileceği seviyeleri tahmin etmek için tasarlanmıştır. Görevi, son üç çubuğu analiz etmek ve buna dayalı bir tahmin oluşturmaktır. Gösterge herhangi bir zaman diliminde ve herhangi bir döviz çiftinde kullanılabilir. Ayarların yardımıyla, tahminin istenen kalitesini elde edebilirsiniz. Tahmin derinliği - istenen tahmin derinliğini çubuklar halinde ayarlar. Bu parametrenin 18-31 aralığında seçilmesi önerilir. Bu sınırların ötesine g
The indicator is designed to measure the price volatility. This allows determining the moments for opening or closing trade positions more accurately. High intensity of the market indicates the instability of its movement, but allows for better results. And, conversely, low intensity of the market indicates the stability of its movement. Parameters Bars to process - the number of bars to measure the price movements. A low value of this parameter allows determining the moments of rapid price mov
This indicator uses the Fibonacci p-numbers to smooth a price series. This allows combining the advantages of the simple and exponential moving averages. The smoothing coefficients depend on the level of the p-number, which is set in the indicator parameters. The higher the level, the greater the influence of the simple moving average and the less significant the exponential moving average. Parameters Fibonacci Numbers Order - order of the Fibonacci p-number, specified by trader. Valid values a
The indicator is based on the analysis of interaction of two filters. The first filter is the popular Moving Average. It helps to identify linear price movements and to smooth minor price fluctuations. The second filter is the Sliding Median. It is a non-linear filter. It allows to filter out noise and single spikes in the price movement. A predictive filter implemented in this indicator is based on the difference between these filters. The indicator is trained during operation and is therefore
This indicator studies the price action as a combination of micro-trends. All micro-trends are analyzed and averaged. Price movement is filtered based on this averaging. IP_High and IP_Low (blue and red dashed lines) show the instantaneous price movement. They display the forecast only for the current price values, taking into account only the number of bars defined by the 'Filter level' parameter. SP_High and SP_Low (blue and red solid lines) smooth the price movements with respect to history.
Bu gösterge, basit bir doğrusal yumuşatma işlemi uygular. Üstel yumuşatmanın dezavantajlarından biri, sinyalin hızlı bozulmasıdır. Bu, fiyat aralığındaki uzun vadeli eğilimleri tam olarak takip etmeyi imkansız hale getirir. Doğrusal yumuşatma, sinyal filtrelemeyi daha doğru ve ince bir şekilde ayarlamanıza olanak tanır. Gösterge, parametreler seçilerek yapılandırılır: LP - bu parametre, yumuşatma süresini seçmenize olanak tanır. Değeri ne kadar büyük olursa, gösterge o kadar uzun vadeli eğil
Этот индикатор представляет гибридный фильтр основанный на совместном использовании медианы и скользящей средней. Использование медианы позволяет отфильтровывать аномальные выбросы и случайные импульсы в значениях ценового ряда. При этом на трендовую составляющую медианный фильтр не действует, оставляя ее без изменений. Так как медианный фильтр является нелинейным, то для сглаживания его значений используется скользящая средняя. Такой подход позволяет более точно выделять не только тренд, но и п
This indicator is a combination of two modified Lanczos filters. The first filter serves to extrapolate the price. Based on past values, he predicts a possible price movement within the current bar. That is, it shows what the price would be if the past trends remained unchanged. The second filter for smoothing and averaging prices within the window, determined by the level of the filter. Thanks to the selection of weights, this filter is most actively responding to the periodic component that is
Let's look at the nature of price changes in the Forex market, not paying attention to the reasons why these changes occur. This approach will allow us to identify the main factors affecting the price movement. For example, let's take the opening prices of bars on the EUR-USD currency pair and the H1 timeframe. For these prices, we construct the Lameray diagram (Figure 1). In this diagram, it can be seen that the price movement basically occurs according to a linear equation. To determine the pa
This indicator is more informative. His work is based on the assumption that the price movement in the market can be represented as noise of a particular color, which depends on the parameters of the distribution of price values. Thanks to this, it is possible to analyze the price change from different angles, and considering the price movement as noise of a particular color, one can get information about the current state of affairs in the market and make a forecast about the price behavior. W
Despite some drawbacks of the “ AIS Color Noise Filter ” indicator, the idea to use it to smooth the price series and forecast prices looks quite attractive. This is due to several reasons: first, taking into account several noise components allows building a forecast on factors independent of each other, which can improve the quality of forecasting; secondly, the noise characteristics of the price series behave quite stably throughout the entire history, which makes it possible to obtain stabl
Very often, in the study of financial series apply their smoothing. Using smoothing, you can remove high-frequency components - it is believed that they are caused by random factors and therefore irrelevant. Smoothing always includes some way of averaging the data, in which random changes in the time series mutually absorb each other. Most often, for this purpose, simple or weighted moving average methods are used, as well as exponential smoothing. Each of these methods has its advantages and d
In order to isolate long-term and non-random components, it is necessary to know not only how much the price has changed, but also how these changes occurred. In other words - we are interested not only in the values ​​of price levels, but also in the order in which these levels replace each other. Through this approach, one can find long-term and stable factors that influence (or may influence) the price change at a given point in time. And knowledge of these factors allows you to make a more
One of the powerful methods of analysis is the modeling of financial series using Levy processes. The main advantage of these processes is that they can be used to model a huge number of phenomena - from the simplest to the most complex. Suffice it to say that the idea of ​​the fractal price movement in the market is only a special case of Levy processes. On the other hand, with proper selection of parameters, any Levy process can be represented as a simple moving average. Figure 1 shows an exa
Very often, the trader is faced with the task of determining the extent to which the price may change in the near future. For this purpose, you can use the Johnson distribution type SB. The main advantage of this distribution is that it can be used even with a small amount of accumulated data. The empirical approach used in determining the parameters of this distribution, allows you to accurately determine the maximum and minimum levels of the price channel. These values ​​can be used in differ
This indicator allows you to determine the likelihood that the price will reach one or another level. Its algorithm is quite simple and is based on the use of statistical data on the price levels of a particular currency pair. Thanks to the collected historical data, it is possible to determine the extent to which the price will change during the current bar. Despite its simplicity, this indicator can provide invaluable assistance in trading. So, with its help it is possible to determine TakePr
Stable distributions can be used to smooth financial series. Since a fairly deep history can be used to calculate the distribution parameters, such smoothing may in some cases be even more effective than other methods. The figure shows an example of the distribution of the opening prices of the currency pair " EUR-USD " on the time frame H1 for ten years (figure 1). Looks fascinating, doesn't it? The main idea behind this indicator is to determine the parameters of a stable distribution based
Filtrele:
İnceleme yok
İncelemeye yanıt