Trend Power Level
- Göstergeler
- Harun Celik
- Sürüm: 1.0
- Etkinleştirmeler: 20
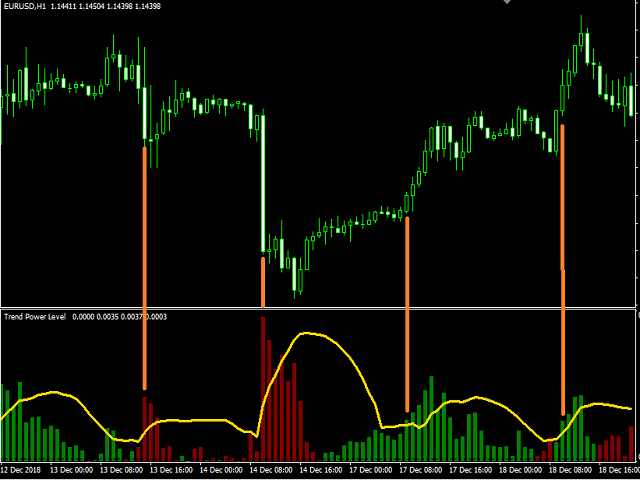
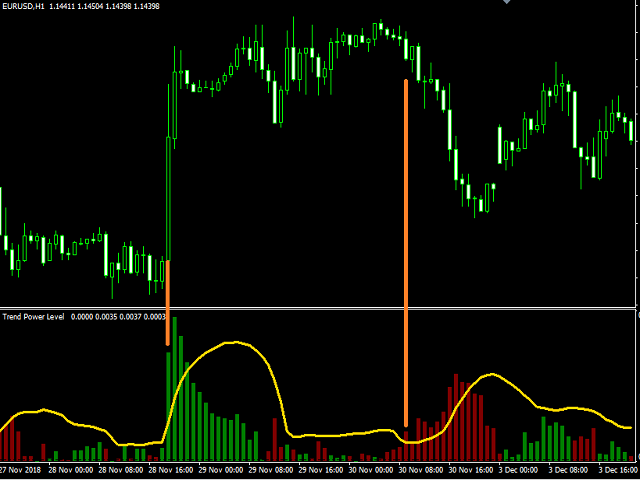
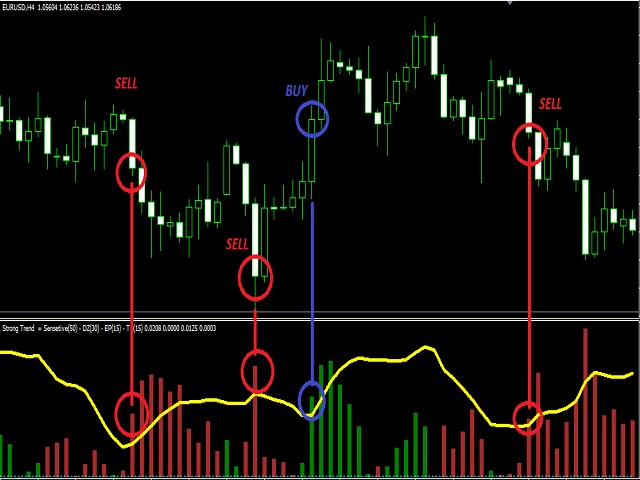
Trend Power Level indicator is a special indicator designed to capture healthy signals. There are lines showing the signal of the indicator and the power of buying and selling.
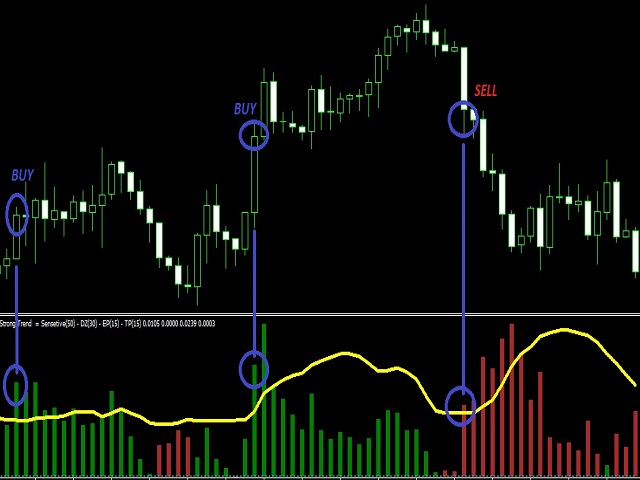
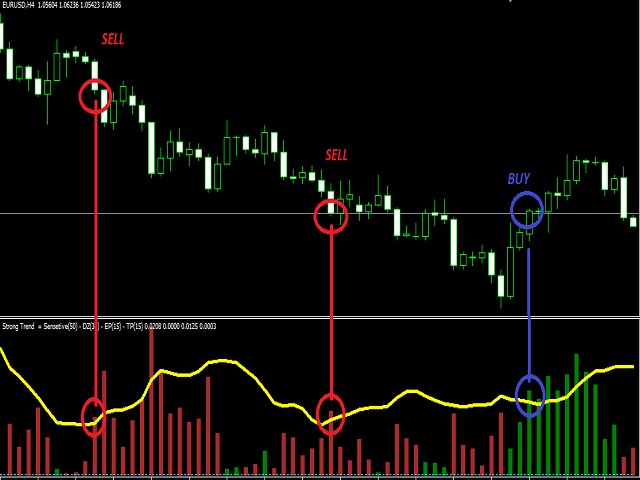
The signal line is yellow. The green lines are Buy lines. The ones that are brown are Sell lines. The green line must close above the yellow line to perform the operation.
The brown line must close above the yellow line to sell. The important line is the first one that closes above the yellow line. If the first line is green, buy; and if it is brown, go to sell. Do not proceed with the second next closing line.
This indicator has an alert feature that sends you alerts. This indicator gives successful results when the manual is followed. Works on all chart types. You can use it comfortably in all symbols. It can work with any broker.
Parameters
- Explosion power - Current trend explosion power setting.
- Trend power - Current trend power setting.
- Alert window - Alert active or off setting.
- Alert count - How many alerts come.
- Alert long - Send an alert for a buy operation.
- Alert short - Send an alert for a sell operation.