CycleTraderPro CycleWave Bressert
- Göstergeler
- Jerome Bressert
- Sürüm: 1.0
- Etkinleştirmeler: 5
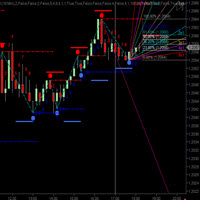
CycleTraderPro CycleWave Indicator is 9 indicators in 1.
It uses the CycleTraderPro Indicators and Patterns to identify Cycles and more in real time.
✅ The 9 parts of CycleWave:
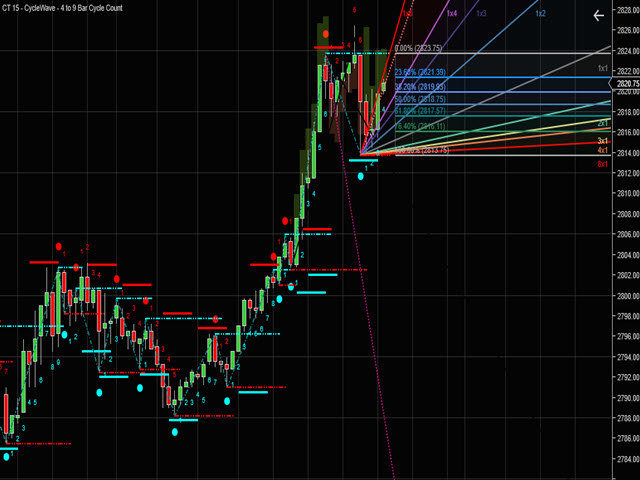
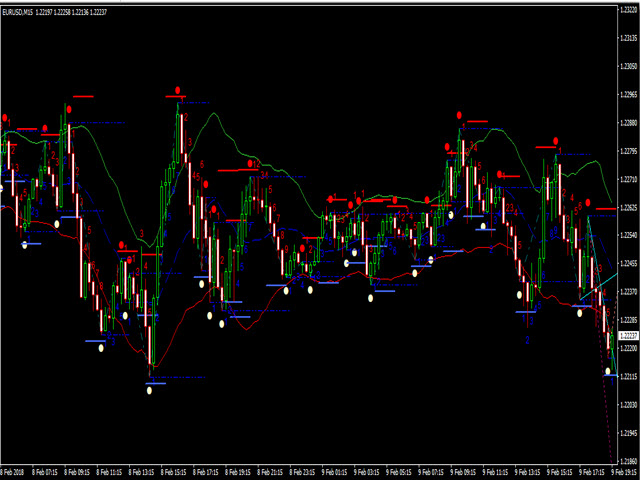
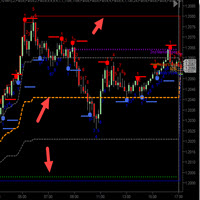
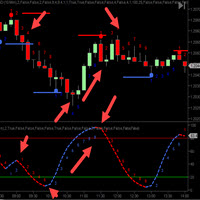
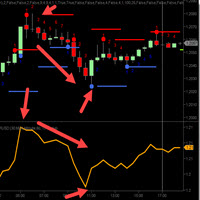
- Plots Cycle Bands and confirm Cycle High / Lows in real time after each successful cycle high or low.
- Plots Cycle Wave Price Windows above and below each bar using a modified % range of the previous bar.
- Automatically plots the Fibonacci Retracement from cycle low and highs after each cycle.
- Automatically plots Gann Fans from each cycle low and high.
- Automatically plots up and down Trend Lines after each cycle low and high.
- Automatically plots Price Target Windows using the range of the previous X bar's range in the direction of the cycle count.
- Automatically plots Breakout Lines from each cycle low and high.
- Automatically plots Speed Lines from the exact angle of the previous price move out into the future to show you where price and time come together.
- Automatically plots Congestion Boxes to show where prices will likely trade up or down to.
Because of how we use math and patterns, CycleWave can do just about any automatic calculation for many other common indicators. Saves tons of time trying to plot these values yourself. We believe in the 4 to 9 bar cycle count. These values will appear on your chart automatically as the market moves.
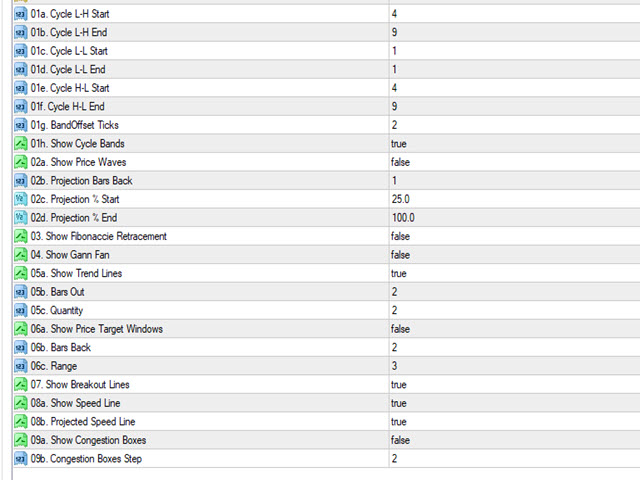
✅ Inputs:
1 - Cycles - This sets the cycle length for the cycle bands for highs and lows
2 - CycleWave Price Windows - Sets a percentage 25% to 100% of the previous bar's range above or below the current bar in the direction of the current cycle move.
3 - Fibonacci - This shows the fib numbers ahead of the current price bars.
4 - Gann Fan - This will plot Gann angles into the future.
5 - Trend line will use the cycle highs and lows and plot using the following bar highs and lows.
6 - Price Target Windows takes the range of x bars back and then project this price windows into the future.
7 - Breakout line use the cycle lows and highs and plots horizontal lines into the future to show breakout points.
8 - Projection Lines uses the angle of the last move and then plots this same exact angle into the future.
9 - Congestion boxes combines the past x bars highs and lows and puts a box around this range.









AUTHOR DID NOT RESPOND TO MY REQUEST TO SORT OUT PROBLEM OF INDICATOR NOT WORKING IN MY MT4 PLATFORM, This indicator has a lot of potential but the problem is it is not working on any of my various broker mt4 platforms.