Colored Line Graph
- Göstergeler
- Igor Semyonov
- Sürüm: 2.22
- Güncellendi: 19 Temmuz 2024
Description
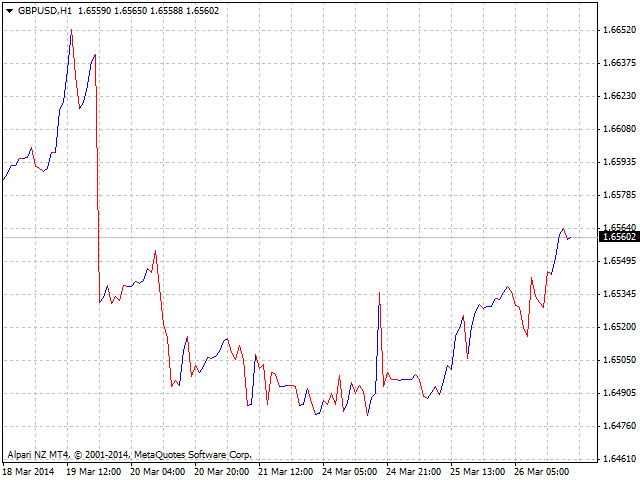
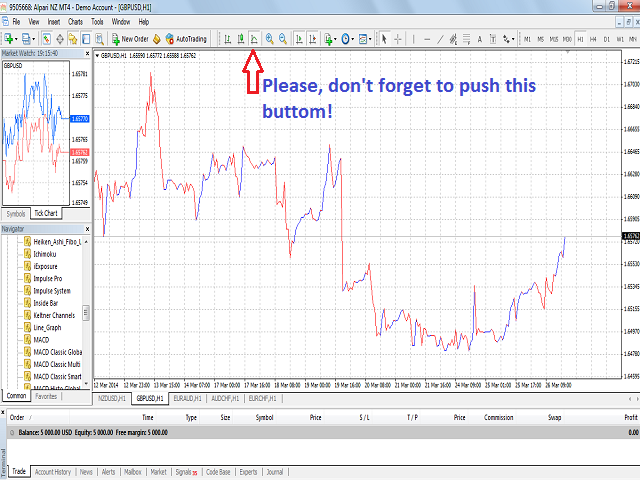
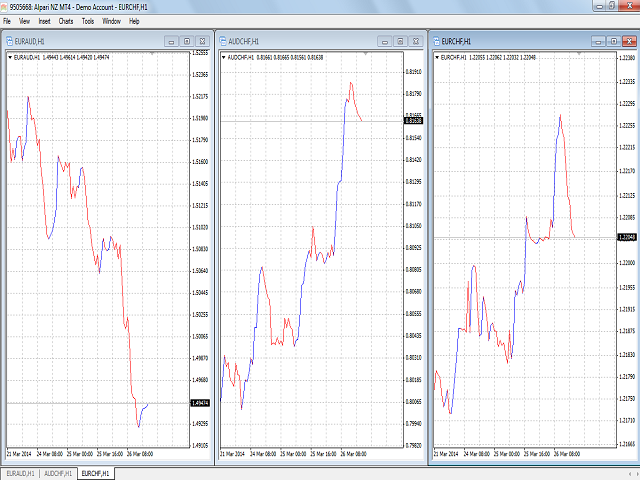
This is an indicator that colors market moods on a linear chart in the window of the main financial instrument.
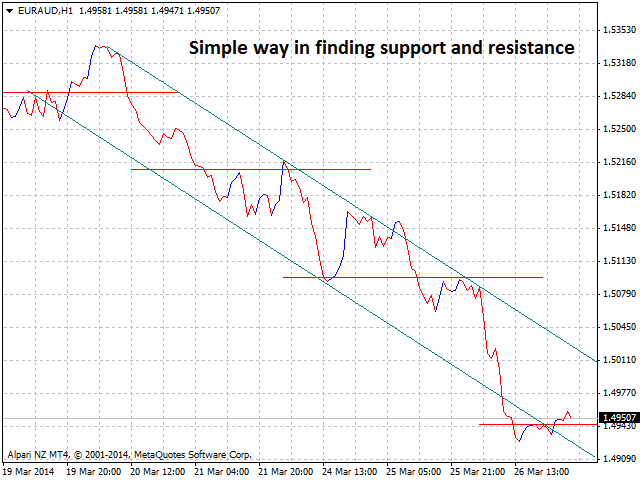
It is useful for determining support and resistance levels.
Purpose
The indicator can be used for manual or automated trading as part of an Expert Advisor. For automated trading, you can use values of indicator buffers of the double type:
- rising line - buffer 0, must not be equal to EMPTY_VALUE.
- falling line - buffer 1, must not be equal to EMPTY_VALUE.












Bullshet