• Genel bakış
  • İncelemeler (9)
  • Yorumlar (21)
  • Yenilikler

VolumeProfile MT5

4.14

Description:

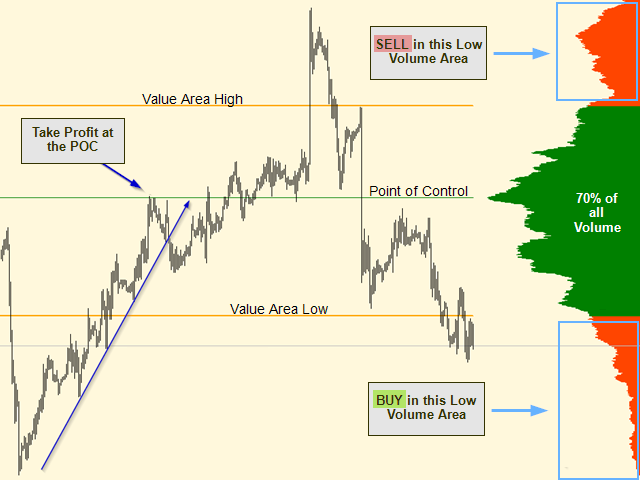
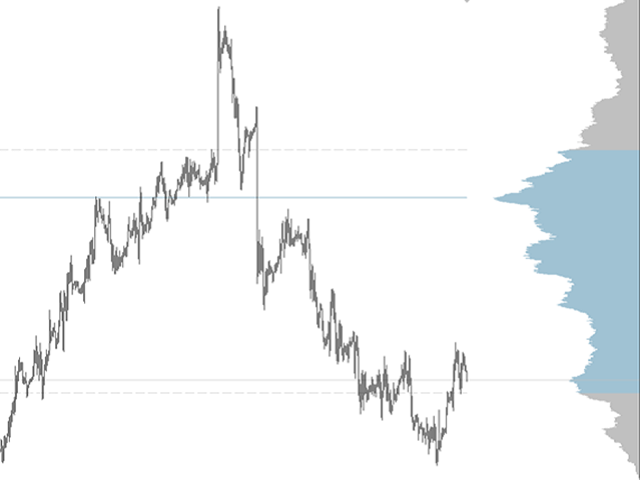
The Volume Profile displays detailed informations of historical trading activities at certain price levels (Market Profile).

Locate the areas with the best prices in the market and get an advantage over other market participants.


Features:

  • Customizable Market Profile
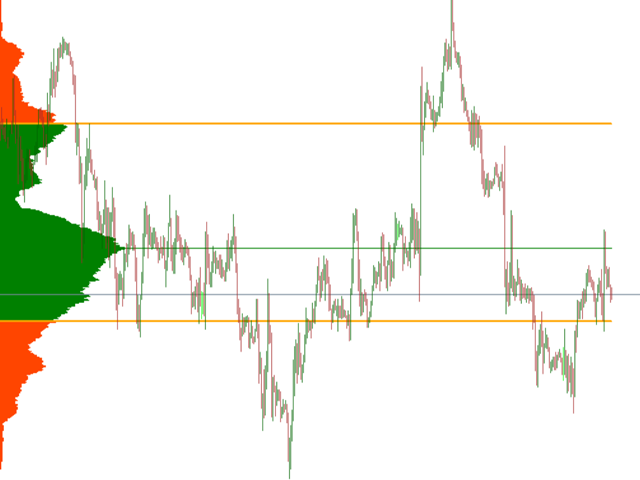
  • Shows the "fair" Value Area with 70% of all Volume
  • Shows critical low volume zones
  • Shows VPOC, VAL and VAH Points
  • integrated resource management to reduce the load while working with multiple charts
  • Works on all timeframes
  • Automatic calculation your defined timeset in all timeframes
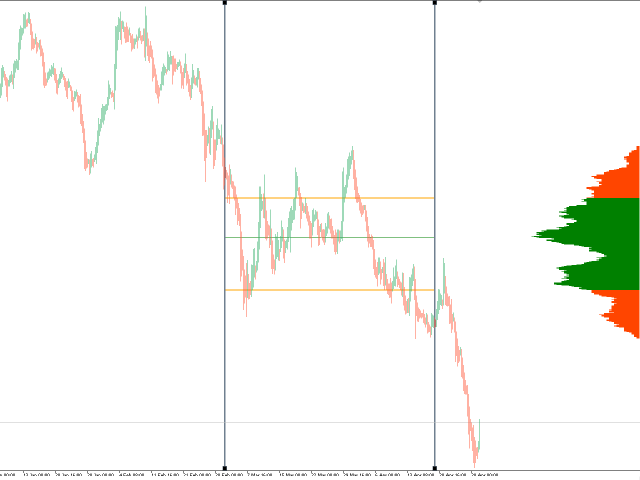
  • Drag & Drop for live calculation
  • Also available for MT4
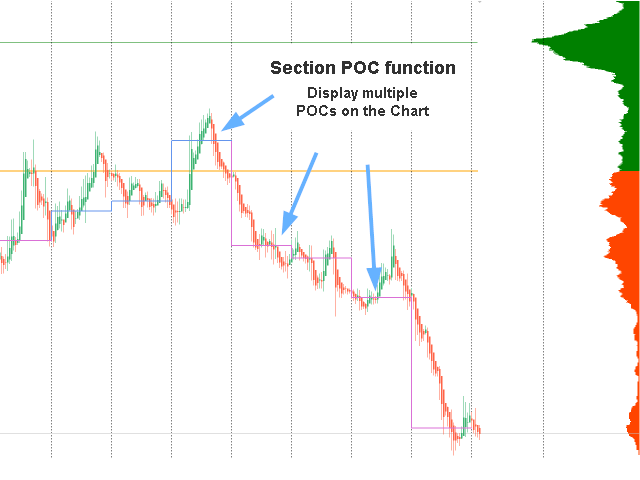
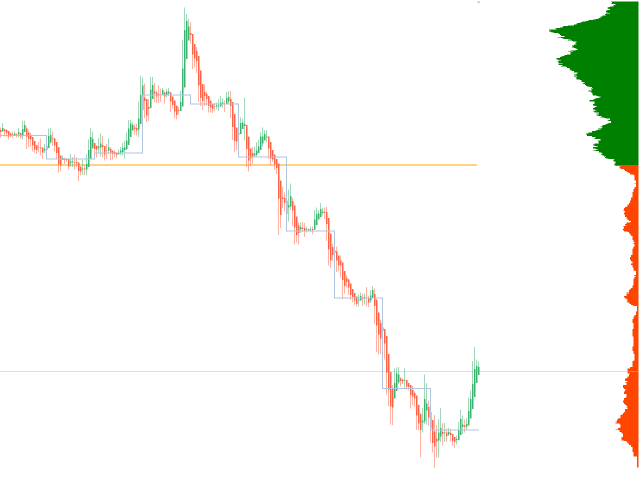
  • Section POCs (Display multiple POCs and VAL/VAH lines in one Chart)

Settings:

Variable
 Standard Value Description
Bar History
1440
Number of historical Bars to calculate from if "Auto calc history" is set to false
Level of Detail
1 Set the resolution for the profile. For protection purposes the level of detail will be automaticaly recalculated if you open a high volatile chart such as BTC.
Mirror to left side
false
Mirrors the whole VolumeProfile to the left side of the chart (Size can be adjusted with "Scale" input)
Horizontal Position (auto)
true
- Set this value to "true" to let the volume profile automaticaly align to your screen.
- Set this value to "false" to ajust the X-Position with the variable "X-Position"
Horizontal Position (manual)
0
Set the X Position of the Indicator on the screen (recommended value is 30 to 60)
Scale
10 Adjust the percentage of the chart, to be coverd by the VolumeProfile
Enable History Start line false Enable the History Start line, with which you can choose the calculation start of the Profile -  drag & Drop to calculate the VolumeProfile
Enable History End line true Enable the History End line, that shows until which candle the VolumeProfile will be calculated - drag & Drop to calculate the VolumeProfile
History line width 3 Set the History line width
History line color SlateGray Set the History line color
Enable Section POC  true Enable/Disable the section POC
Steps of POC 10 Set the number of POCs
Tie to Period separator true ties the sPOC to Period separators
Width of POC 2 Width of sPOC
Color POC Up Cornflower Blue Set the color for a POC that is higher than the last POC
Color POC Down Orchid Set the color for a POC that is lower than the last POC
POC Style solid Set solid or dotted POC Lines
Bars in XX XX Set the Bars for every Period if not tied to Period separator
Refresh auto
true
Set this to "false" if you want the VolumeProfile to not refresh automaticaly
Refresh rate
10
Adjust the refresh timer (Refresh the VolumeProfile every X seconds). Setting this value too low, will lead to a much slower performance
Auto calc history
false
Set this to "true" to activate the automatic conversion of minutes when the timeframe has changed
History (in Minutes)
1440
Set the time in minutes, that is used for the calculation of the VolumeProfile
Value Area percentage 70 Set the percentage of the Value Area
Enable Volume Profile  true Set this to "false" if you wish to hide the Volume Profile
Profile_Color
Green
Color of the area with 70% of all volume (fair value area)
Profile_Color_VLow
OrangeRed
Color of the areas with low volume
Profile_Background
true
Set the profile to background
POC_Style
0
Set the Style of the Point of Control
POC_Color
Green
Set the Color of the POC
POC_Width
1
Set the Width of the POC
POC_Background
true
Set the POC to background
VAL_Style
0
Set the Style of the Value Area Low Line
VAL_Color
Orange
Set the Color of the VAL
VAL_Width
2
Set the Width of the VAL
VAL_Background
true
Set the VAL to the Background
VAH_Style 0
Set the Style of the Volume Area High
VAH_Color Orange
Set the Color of the VAH
VAH_Width 2
Set the Width of the VAH
VAH_Background true
Set the VAH to the Background
Set custom History values (below) false Swtich between the general "Bar History" and the custom History values below
Bar History XX XX History in Bars if the Time Frame is XX


İncelemeler 9
Douglas De Souza Goncalves
16
Douglas De Souza Goncalves 2023.11.29 22:55 
 

I migrate to another account with the same broker but the indicator doesn't work... do I need to do some activation or something like that for the indicator to work again? thank you very much

Jan Patzig
51
Jan Patzig 2023.08.09 15:42 
 

Supaaaaa...

00023867
139
00023867 2022.02.09 16:20 
 

a very good indicator

Önerilen ürünler
BoxChart MT5
Evgeny Shevtsov
5 (7)
The market is unfair if only because 10% of participants manage 90% of funds. An ordinary trader has slim changes to stand against these "vultures". This problem can be solved. You just need to be among these 10%, learn to predict their intentions and move with them. Volume is the only preemptive factor that faultlessly works on any timeframe and symbol. First, the volume appears and is accumulated, and only then the price moves. The price moves from one volume to another. Areas of volume accumu
Was: $249  Now: $149   Market Profile defines a number of day types that can help the trader to determine market behaviour. A key feature is the Value Area, representing the range of price action where 70% of trading took place. Understanding the Value Area can give traders valuable insight into market direction and establish the higher odds trade. It is an excellent addition to any system you may be using. Inspired by Jim Dalton’s book “Mind Over Markets”, this indicator is designed to suit the
This indicator allows you to enjoy the two most popular products for analyzing request volumes and market deals at a favorable price: Actual Depth of Market Chart Actual Tick Footprint Volume Chart This product combines the power of both indicators and is provided as a single file. The functionality of Actual COMBO Depth of Market AND Tick Volume Chart is fully identical to the original indicators. You will enjoy the power of these two products combined into the single super-indicator! Below is
Blahtech Supply Demand MT5
Blahtech Limited
4.54 (13)
Was: $299  Now: $149  Supply Demand uses previous price action to identify potential imbalances between buyers and sellers. The key is to identify the better odds zones, not just the untouched ones. Blahtech Supply Demand indicator delivers functionality previously unavailable on any trading platform. This 4-in-1 indicator not only highlights the higher probability zones using a multi-criteria strength engine, but also combines it with multi-timeframe trend analysis, previously confirmed swings
Before installing the HeatMap indicator make sure you are using a broker that gives you access to the Depth of market (DOM) !! This indicator creates a heatmap on your chart allowing you to see the buy or sell limit orders easily and in real time. You have the possibility to change the setting and the colors of the HeatMap in order to adapt to all markets and all charts. Here is an example of a setting you can use with the NASDAQ100 on the AMPGlobal broker :  https://www.youtube.com/watch?v=x0Y
Gösterge, tarihsel olanlarla karşılaştırılabilecek güncel teklifler oluşturur ve bu temelde bir fiyat hareketi tahmini yapar. Gösterge, istenen tarihe hızlı navigasyon için bir metin alanına sahiptir. Seçenekler: Sembol - göstergenin göstereceği sembolün seçimi; SymbolPeriod - göstergenin veri alacağı dönemin seçimi; GöstergeRenk - gösterge rengi; Ters - doğru tırnakları tersine çevirir, yanlış - orijinal görünüm; Sonraki, tarihi girebileceğiniz ve 'enter' tuşuna basarak hemen atlayab
Mt5 Market Profile
Mcblastus Gicharu Ndiba
Market Profile Introducing the Market Profile MetaTrader Indicator—your gateway to mastering market dynamics with precision and insight. This powerful tool delivers a classic Market Profile analysis, revealing price density over time and highlighting crucial levels, including the value area and control value for any trading session.  Compatible with timeframes from M1 to D1, it adapts to daily, weekly, monthly, or even intraday sessions, offering you unmatched flexibility. Lower timeframes prov
Bu göstergenin benzersizliği, hacim hesaplama algoritmasında yatmaktadır: birikim, günün başlangıcına bakılmaksızın doğrudan seçilen dönem için gerçekleşir. Son çubuklar hesaplamanın dışında tutulabilir, bu durumda mevcut veriler daha önce oluşturulan önemli seviyeler (hacimler) üzerinde daha az etkiye sahip olacaktır. Daha doğru bir hesaplama için varsayılan olarak M1 grafiğindeki veriler kullanılır. Fiyat hacimlerinin dağıtım adımı düzenlenir. Varsayılan olarak, ekranın sağ sınırı, analiz için
Haven Volume Profile
Maksim Tarutin
3.5 (2)
Haven Volume Profile, ticaret hacminin dağılımına dayalı olarak önemli fiyat seviyelerini belirlemeye yardımcı olan çok fonksiyonlu bir hacim profili analiz göstergesidir. Piyasayı daha iyi anlamak ve önemli giriş ve çıkış noktalarını belirlemek isteyen profesyonel yatırımcılar için tasarlanmıştır. Diğer Ürünler ->  BURADAN Temel Özellikler: Point of Control (POC) Hesaplama - en yüksek ticaret aktivitesinin gerçekleştiği seviye, en likit seviyeleri belirlemeye yardımcı olur Value Area (yüksek ak
FREE
Elevate Your Trading with Advanced Anchored Volume Weighted Average Price Technology Unlock the true power of price action with our premium Anchored VWAP Indicator for MetaTrader 5 - the essential tool for precision entries, strategic exits, and high-probability trend continuation setups. Write me a DM for a 7 day free trial.  Anchored VWAP Plus gives traders unprecedented control by allowing custom anchor points for Volume Weighted Average Price calculations on any chart. With support for 4 sim
FREE
Volume Profile V6
Andrey Kolesnik
4.5 (2)
The volume profile indicator of the market + a S mart oscillator . It works on almost all instruments - currency pairs , stocks , futures , cryptocurrency , on real volumes and on tick ones . You can set both the automatic definition of the profile range , for example , for a week or a month , etc . , and set the range manually by moving the boundaries ( two vertical lines red and blue ) . It is shown as a histogram . The width of the histogram at this level means , conditionally , the number of
L'indicatore SMC Venom Model BPR è uno strumento professionale per i trader che operano nell'ambito del concetto di Smart Money (SMC). Identifica automaticamente due modelli chiave sul grafico dei prezzi: FVG   (Fair Value Gap) è una combinazione di tre candele, in cui c'è un gap tra la prima e la terza candela. Forma una zona tra livelli in cui non c'è supporto di volume, il che spesso porta a una correzione dei prezzi. BPR   (Balanced Price Range) è una combinazione di due modelli FVG che for
Market profile was developed by Peter Steidlmayer in the second half of last century. This is a very effective tool if you understand the nature and usage. It's not like common tools like EMA, RSI, MACD or Bollinger Bands. It operates independently of price, not based on price but its core is volume. The volume is normal, as the instrument is sung everywhere. But the special thing here is that the Market Profile represents the volume at each price level. 1. Price Histogram The Price Histogram i
VR Grid Mt5
Vladimir Pastushak
3.43 (7)
VR Izgara göstergesi, kullanıcı tanımlı ayarlarla grafiksel bir ızgara oluşturmak için tasarlanmıştır . Standart ızgaradan farklı olarak, VR Izgarası dairesel seviyeler oluşturmak için kullanılır. Kullanıcının seçimine bağlı olarak tur seviyeleri arasındaki adım isteğe bağlı olabilir. Ek olarak, diğer göstergeler ve yardımcı programlardan farklı olarak VR Grid, zaman dilimi değiştiğinde veya terminal yeniden başlatıldığında bile ızgaranın konumunu korur . Ayarlar, set dosyaları, demo versiyonlar
FREE
Includes almost all the concepts related to Volume Profile: POC , Value Area , Developing POC , Anchored VWAP , Volume Delta ; since the “Total” in its name. It is fast in its calculations and simple to work with. Features: 1.    Selectable calculation timeframe to find most traded levels. 2.    Capable of calculating Volume Profile based on tick data 3.    Adjustable histogram bars by their count. 4.    Adjustable histogram bars by their height (price range). 5.    Showing Value Area (VA
The indicator highlights the points that a professional trader sees in ordinary indicators. VisualVol visually displays different volatility indicators on a single scale and a common align. Highlights the excess of volume indicators in color. At the same time, Tick and Real Volume, Actual range, ATR, candle size and return (open-close difference) can be displayed. Thanks to VisualVol, you will see the market periods and the right time for different trading operations. This version is intended f
FREE
Wapv Price and volume
Eduardo Da Costa Custodio Santos
MT5 için WAPV Fiyat ve Hacim Göstergesi, (Wyckoff Academy Wave Market) ve (Wyckoff Academy Fiyat ve Hacim) araç setinin bir parçasıdır. MT5 için WAPV Fiyat ve Hacim Göstergesi, grafikteki hacim hareketini sezgisel bir şekilde görselleştirmeyi kolaylaştırmak için oluşturuldu. Bununla, piyasanın profesyonel bir ilgisinin olmadığı en yüksek hacim anlarını ve anları gözlemleyebilirsiniz. Piyasanın "akıllı para" hareketiyle değil, ataletle hareket ettiği anları belirleyin. Kullanıcı tarafından değişt
Order Book, known also as Market Book, market depth, Level 2, - is a dynamically updated table with current volumes of orders to buy and to sell specific financial instument at price levels near Bid and Ask. MetaTrader 5 provides the means for receiving market book from your broker, but in real time only, without access to its history. The indicator OrderBook Cumulative Indicator accumulates market book data online and visualizes them on the chart. In addition, the indicator can show the market
BoxInside MT5
Evgeny Shevtsov
5 (4)
This indicator calculates the volume profile and places labels that correspond to the VAH, VAL and POC levels, for each candle individually. Indicator operation features The indicator works on the timeframes from M3 to MN, but it uses the history data of smaller periods: M1 - for periods from M3 to H1, M5 - for periods from H2 to H12, M30 - for the D1 period, H4 - for the W1 period, D1 - for the MN period. The color and location of the VAL, VAH and POC labels on the current candle are considere
FREE
The Penta-O is a 6-point retracement harmonacci pattern which usually precedes big market movements. Penta-O patterns can expand and repaint quite a bit. To make things easier this indicator implements a twist: it waits for a donchian breakout in the right direction before signaling the trade. The end result is an otherwise repainting indicator with a very reliable trading signal. The donchian breakout period is entered as an input. [ Installation Guide | Update Guide | Troubleshooting | FAQ | A
Premium seviye, %80'den fazla doğru tahmin doğruluğuna sahip benzersiz bir göstergedir! Bu gösterge en iyi Ticaret Uzmanları tarafından iki aydan uzun süredir test edilmiştir! Yazarın göstergesini başka hiçbir yerde bulamazsınız! Ekran görüntülerinden bu aracın doğruluğunu kendiniz görebilirsiniz! 1, sona erme süresi 1 mum olan ikili opsiyon ticareti için harikadır. 2 tüm döviz çiftleri, hisse senetleri, emtialar, kripto para birimleri üzerinde çalışır Talimatlar: Kırmızı ok göründüğü an
To download MT4 version please click here . - This is the exact conversion from TradingView: "Trend Direction Force Index - TDFI [wm]" By "causecelebre". - The screenshot shows similar results from tradingview and Metatrader when tested on ICMarkets on both platforms. - This indicator uses multiple levels of averaging to detect trend strength. - You can optimize filter low and filter high levels to achieve best results. - You have access to buffers to use in EAs. - This is a light-load processin
VWAP Daily
Anton Polkovnikov
Weighted average price indicator or VWAP. The well-known standard VWAP with the beginning of the day is added with the function of selecting the periodization. It can be calculated both every day and on other periods. Also the indicator allows to exclude the volume from the calculation, which will allow using it on the cryptocurrencies and forex. There is an alert for a VWAP price crossing. There are 1 and 2 standard deviation. Settings: Volume: turning volume on and off in the calculation mecha
VP hidden
Emr Aljnaby
4.22 (9)
The indicator works to convert normal volume into levels and determine financial liquidity control points. It is very similar in function to Fixed Volume Profile. But it is considered more accurate and easier to use than the one found on Trading View because it calculates the full trading volumes in each candle and in all the brokers present in MetaTrade, unlike what is found in Trading View, as it only measures the broker’s displayed prices. To follow us on social media platforms: telegram
FREE
This indicator shows a candle combination based on dodge, dodge and pin bar. The logic of the pattern is to stand on the side of strength, after uncertainty. The indicator is universal and is useful for trading binary options, forex, ETFs, cryptocurrency, stocks. The indicator supports timeframes from M5 to MN, including non-standard TF presented in MT5. (М5,М6,М10,M12, M15, M20, M30, H1, H2, H3, H4, H6, H8, H12, D1, W1, MN). The ability to enable and disable TF is implemented. Sound alerts and
Volume Delta Candle
Muhammad Muzaffar Hussan
Volume Delta Candles: A Comprehensive Tool for In-Depth Trading Analysis Unlock a seamless way to interpret trading experience within each candle. With Volume Delta Candles, there's no need for additional volume indicators—everything you need is built in. This advanced tool utilizes lower timeframes or live market data to present the percentage of buying versus selling volume within each candle as an intuitive color-coded bar. Before diving in, ensure you’re familiar with Volume and Volume Delta
Cumulative delta indicator As most traders believe, the price moves under the pressure of market buying or selling. When someone redeems an offer standing in the cup, the deal is a "buy". If someone pours into the bid standing in the cup - the deal goes with the direction of "sale". The delta is the difference between purchases and sales. A cumulative delta - the difference between the cumulative sum of purchases and sales for a certain period of time. It allows you to see who is currently contr
DYJ BoS göstergesi, piyasa yapısındaki değişimlerin temel unsurlarını otomatik olarak belirler ve işaretler, bunlar arasında şunlar yer alır: Yapının Kırılması (BoS): Fiyatın önceki bir yapı noktasını kırarak önemli bir hareket yapması durumunda tespit edilir. Olası yükseliş trendi çizgilerini ve düşüş trendi çizgilerini (UP & DN, yani sürekli yeni zirveler ve yeni dipler) işaretler ve fiyat bu çizgileri aştığında kırmızı (AYI) ve yeşil (BOĞA) okları işaretler BoS genellikle fiyatın önceki f
The professional tool of stock traders in now available on MetaTrader 5 . The Actual depth of market chart indicator visualizes the depth of market in the form of a histogram displayed on a chart, which refreshes in the real-time mode. Meet new updates according to user requests! Now Actual Depth of Market indicator displays the current ratio of volume of buy and sell requests (B/S ratio). It shows the share of volume of each type of requests in the entire flow of requests as well as the absolu
ClusterSecond
Rafil Nurmukhametov
4.78 (32)
The utility allows you to build different types of graphs: Seconds chart from 1 second to 86400 seconds Tick chart from 1 tick and above The volume chart Delta chart Renko chart Range chart Demo version of the utility https://www.mql5.com/ru/channels/clustersecond Built-in indicators for volumetric analysis: daily market profile and market profile of the selected timeframe, Cluster Search Imbalance VWAP Dynamic POC, VAH, VAL the profile depth of the market vertical volume with various display op
Bu ürünün alıcıları ayrıca şunları da satın alıyor
TPSpro RFI Levels MT5
Roman Podpora
4.55 (20)
Geri dönüş bölgeleri / Tepe hacimleri / Önemli bir oyuncunun aktif bölgeleri =       TS TPSPROSİSTEMİ TALİMATLAR RUS       /       TALİMATLAR       ENG       /           Sürüm MT4        Bu göstergenin her alıcısı ayrıca ÜCRETSİZ şunları elde eder: RFI SIGNALS servisinden işlem sinyallerine 6 ay erişim - TPSproSYSTEM algoritmasına göre hazır giriş noktaları. Düzenli olarak güncellenen eğitim materyalleri - stratejiye dalın ve profesyonel seviyenizi yükseltin. Hafta içi 7/24 destek ve kapalı ya
RelicusRoad Pro MT5
Relicus LLC
4.78 (18)
Şimdi 147 $ (birkaç güncellemeden sonra 499 $ 'a yükseliyor) - Sınırsız Hesaplar (PC'ler veya Mac'ler) RelicusRoad Kullanım Kılavuzu + Eğitim Videoları + Özel Discord Grubuna Erişim + VIP Durumu PİYASAYA BAKMAK İÇİN YENİ BİR YOL RelicusRoad, forex, vadeli işlemler, kripto para birimleri, hisse senetleri ve endeksler için dünyanın en güçlü ticaret göstergesidir ve yatırımcılara kârlı kalmaları için ihtiyaç duydukları tüm bilgileri ve araçları sağlar. Başlangıç ​​seviyesinden ileri seviyeye ka
MetaForecast M5
Vahidreza Heidar Gholami
5 (3)
MetaForecast, fiyat verilerindeki harmonileri kullanarak herhangi bir piyasanın geleceğini tahmin eder ve görselleştirir. Piyasa her zaman tahmin edilemezken, fiyatlarda bir desen varsa, MetaForecast geleceği mümkün olduğunca doğru bir şekilde tahmin edebilir. Benzer ürünlere göre, MetaForecast piyasa eğilimlerini analiz ederek daha kesin sonuçlar üretebilir. Giriş Parametreleri Past size (Geçmiş boyut) MetaForecast'ın gelecekteki tahminler oluşturmak için kullandığı çubuk sayısını belirtir. Mo
Quantum TrendPulse
Bogdan Ion Puscasu
5 (13)
SuperTrend   ,   RSI   ve   Stochastic'in   gücünü tek bir kapsamlı göstergede birleştirerek işlem potansiyelinizi en üst düzeye çıkaran nihai işlem aracı olan   Quantum TrendPulse'u   tanıtıyoruz. Hassasiyet ve verimlilik arayan yatırımcılar için tasarlanan bu gösterge, piyasa trendlerini, momentum değişimlerini ve en uygun giriş ve çıkış noktalarını güvenle belirlemenize yardımcı olur. Temel Özellikler: SuperTrend Entegrasyonu:   Güncel piyasa trendlerini kolayca takip edin ve karlılık dalgası
MTF Supply Demand Zones MT5
Georgios Kalomoiropoulos
5 (1)
Yeni Nesil Otomatik Arz ve Talep Bölgeleri. Her Grafikte Çalışan Yeni ve Yenilikçi Algoritma. Tüm Bölgeler Piyasanın Fiyat Hareketine Göre Dinamik Olarak Oluşturulmaktadır. İKİ TÜR UYARI --> 1) FİYAT BİR BÖLGEYE ÇIKTIĞINDA 2) YENİ BİR BÖLGE OLUŞTURDUĞUNDA Bir tane daha işe yaramaz gösterge almazsın. Kanıtlanmış Sonuçlarla eksiksiz bir Ticaret Stratejisi elde edersiniz.     Yeni özellikler:     Fiyat Arz/Talep Bölgesine ulaştığında uyarılar     Yeni bir Arz/Talep Bölgesi oluşturulduğunda
FxaccurateLS
Shiv Raj Kumawat
WHY IS OUR FXACCCURATE LS MT5 THE PROFITABLE ? PROTECT YOUR CAPITAL WITH RISK MANAGEMENT Gives entry, stop and target levels from time to time. It finds Trading opportunities by analyzing what the price is doing during established trends. POWERFUL INDICATOR FOR A RELIABLE STRATEGIES We have made these indicators with a lot of years of hard work. It is made at a very advanced level. Established trends provide dozens of trading opportunities, but most trend indicators completely ignore them! The
NOTE: CYCLEMAESTRO is distributed only on this website, there are no other distributors. Demo version is for reference only and is not supported. Full versione is perfectly functional and it is supported. CYCLEMAESTRO , the first and only indicator of Cyclic Analysis, useful for giving signals of TRADING, BUY, SELL, STOP LOSS, ADDING. Created on the logic of   Serghei Istrati   and programmed by   Stefano Frisetti ;   CYCLEMAESTRO   is not an indicator like the others, the challenge was to inter
Tanıtım       Quantum Breakout PRO   , Breakout Bölgeleri ile ticaret yapma şeklinizi değiştiren çığır açan MQL5 Göstergesi! 13 yılı aşkın ticaret tecrübesine sahip deneyimli tüccarlardan oluşan bir ekip tarafından geliştirilmiştir.       Kuantum Breakout PRO       yenilikçi ve dinamik koparma bölgesi stratejisiyle ticaret yolculuğunuzu yeni zirvelere taşımak için tasarlanmıştır. Kuantum Breakout Göstergesi, size 5 kar hedefi bölgesi ile kırılma bölgelerinde sinyal okları ve kırılma kutusuna da
Kârlı ticaret fırsatlarını kolaylıkla belirlemenize yardımcı olabilecek güçlü bir forex ticaret göstergesi mi arıyorsunuz? Beast Super Signal'den başka bir yere bakmayın. Bu kullanımı kolay trend tabanlı gösterge, sürekli olarak piyasa koşullarını izleyerek yeni gelişen trendleri araştırır veya mevcut trendlere atlar. Canavar Süper Sinyali, tüm dahili stratejiler birbiriyle uyumlu ve %100 örtüştüğünde bir al ya da sat sinyali vererek ek onay ihtiyacını ortadan kaldırır. Sinyal oku uyarısını aldı
[ MT4 Version ]  [ Kill Zones ]  [ SMT Divergences ] How to trade using Order Blocks:  Click here User Interface Performance:  During testing in the strategy tester, the UI may experience lag. Rest assured, this issue is specific to the testing environment and does not affect the indicator's performance in live trading. Elevate your trading strategy with the  Order Blocks ICT Multi TF  indicator, a cutting-edge tool designed to enhance your trading decisions through advanced order block analysis
AT Forex Indicator MT5
Marzena Maria Szmit
5 (5)
The AT Forex Indicator MT5 is a sophisticated trading tool designed to provide traders with a comprehensive analysis of multiple currency pairs. This powerful indicator simplifies the complex nature of the forex market, making it accessible for both novice and experienced traders. AT Forex Indicator uses advanced algorithms to detect trends, patterns and is an essential tool for traders aiming to enhance their forex trading performance. With its robust features, ease of use, and reliable signal
[ MT4 Version ] Are you tired of spending months on demo or live accounts to test your trading strategies? The Backtesting Simulator is the ultimate tool designed to elevate your backtesting experience to new heights. Utilizing Metatrader historical symbol information, it offers an unparalleled simulation of real market conditions. Take control of your testing speed, test ideas quickly or at a slower pace, and witness remarkable improvements in your testing performance. Forget about wasting tim
MonetTrend — Премиум-индикатор для торговли по тренду (M30, H1, H4) MonetTrend — это мощный и визуально понятный трендовый индикатор, созданный для торговли на таймфреймах M30, H1 и H4. Он идеально подходит для работы с волатильными инструментами, такими как: • Золото (XAUUSD) • Криптовалюты (BTCUSD) • Валютные пары (EURUSD, USDJPY и др.) Ключевые особенности MonetTrend: • Автоматическое отображение Take Profit 1 (TP1) и Stop Loss (SL): После появления сигнала индикатор сразу показывает: • TP
The Naveen Dynamic Square  MT5  is one of the best known  technical analysis tools  inspired  by WD Gann along with the Gann Fan and Gann Box. It is considered a cornerstone of his trading technique that is based on time and price symmetry. The Naveen Dynamic Square MT5   is a powerful tool in finance for determining support and resistance levels based on a stock's extreme price points. It works by extrapolating probable price levels from a central value, typically an all-time or cyclical high o
Trade smarter, not harder: Empower your trading with Harmonacci Patterns This is arguably the most complete harmonic price formation auto-recognition indicator you can find for the MetaTrader Platform. It detects 19 different patterns, takes fibonacci projections as seriously as you do, displays the Potential Reversal Zone (PRZ) and finds suitable stop-loss and take-profit levels. [ Installation Guide | Update Guide | Troubleshooting | FAQ | All Products ] It detects 19 different harmonic pri
CBT Quantum Maverick Yüksek Verimli İkili Opsiyon Ticaret Sistemi CBT Quantum Maverick, hassasiyet, basitlik ve disiplinli ticaret arayan yatırımcılar için tasarlanmış yüksek performanslı bir ikili opsiyon ticaret sistemidir. Özelleştirme gerekmez—bu sistem, ilk kullanımda etkili sonuçlar için optimize edilmiştir. Sinyalleri kolayca anlamak için biraz pratik yapmak yeterlidir. Ana Özellikler: Hassas Sinyaller: Yeni mum bazlı ticaret sinyalleri—mevcut mumdan sonra gelecek mum hedeflenir ve sık
Precision Index Osilatörü (Pi-Osc) - Precision Trading Systems'dan Roger Medcalf Sürüm 2, grafiklerinizde hızlı bir şekilde yüklenmek üzere dikkatle yeniden kodlandı ve deneyimi artırmak için bazı teknik geliştirmeler de içerdi. Pi-Osc, herkesin stoplarını almak için zorlanan pazarların gitmek zorunda kaldığı aşırı yorgunluk noktalarını bulmak için tasarlanmış doğru ticaret zamanlama sinyalleri sunmak amacıyla oluşturuldu. Bu ürün, aşırı noktaların nerede olduğunu bilmek gibi yaşlı bir sorun
Ortalama geri dönüş ticareti için profesyonel ve nicel bir yaklaşım uygulayan benzersiz gösterge. Fiyatın tahmin edilebilir ve ölçülebilir bir şekilde ortalamaya döndüğü ve yön değiştirdiği gerçeğinden yararlanır, bu da nicel olmayan ticaret stratejilerinden büyük ölçüde daha iyi performans gösteren net giriş ve çıkış kurallarına izin verir. [ Installation Guide | Update Guide | Troubleshooting | FAQ | All Products ] Ticaret sinyallerini temizle Ticaret yapmak inanılmaz derecede kolay Özelleşt
The   Time_Price_SQ9_Degree   indicator is based on the 9 Gann square. Using this indicator, you can identify strong time and price zones. The indicator displays the levels as a degree value. The degrees can be set in the settings. After launching, the MENU button appears. If it is highlighted, it can be moved to any point on the graph, and after double-clicking on it, it stops being highlighted and menu buttons appear. To hide the menu, just double-click on the button, it will become highlight
Volume by Price MT5
Brian Collard
3.25 (4)
Volume Profile, Footprint and Market Profile TPO (Time Price Opportunity). Volume and TPO histogram bar and line charts. Volume Footprint charts. TPO letter and block marker collapsed and split structure charts. Static, dynamic and flexible range segmentation and compositing methods with relative and absolute visualizations. Session hours filtering and segment concatenation with Market Watch and custom user specifications. Graphical layering, positioning and styling options to suit the user's a
IQ Gold Gann Levels a non-repainting, precision tool designed exclusively for XAUUSD/Gold intraday trading. It uses W.D. Gann’s square root method to plot real-time support and resistance levels, helping traders spot high-probability entries with confidence and clarity. William Delbert Gann (W.D. Gann) was an exceptional market analyst, whose trading technique was based on a complex blend of mathematics, geometry, astrology, and ancient mathematics which proved to be extremely accurate. Download
AÇIKLAMA ICSM (Impulse-Correction SCOB Mapper), fiyat hareketini analiz eden ve geçerli impulsları, düzeltmeleri ve SCOB'ları (Single Candle Order Block) tanımlayan göstergedir. Esnek, bilgilendirici, kullanımı kolay olması ve tüccarın en likit ilgi alanlarına yönelik farkındalığını önemli ölçüde artırması nedeniyle her türlü teknik analizle kullanılabilen güçlü bir araçtır. AYARLAR Genel | Görsel Renk teması — ICSM'nin renk temasını tanımlar. SCOB | Görsel SCOB'u göster — SCOB'u etkinleş
Berma Bands
Muhammad Elbermawi
5 (3)
Berma Bantları (BB'ler) göstergesi, piyasa trendlerini belirlemeyi ve bunlardan yararlanmayı amaçlayan yatırımcılar için değerli bir araçtır. Fiyat ile BB'ler arasındaki ilişkiyi analiz ederek, yatırımcılar bir piyasanın trend veya aralıklı fazda olup olmadığını ayırt edebilir. Daha fazla bilgi edinmek için [ Berma Home Blog ] adresini ziyaret edin. Berma Bantları üç belirgin çizgiden oluşur: Üst Berma Bandı, Orta Berma Bandı ve Alt Berma Bandı. Bu çizgiler fiyatın etrafına çizilir ve genel tren
TPA True Price Action indicator reveals the true price action of the market makers through 100% non-repainting signals strictly at the close of a candle! TPA shows entries and re-entries, every time the bulls are definitely stronger than the bears and vice versa. Not to confuse with red/green candles. The shift of power gets confirmed at the earliest stage and is ONE exit strategy of several. There are available now two free parts of the TPA User Guide for our customers. The first "The Basics"
[ MT4 Version ]  [ Order Blocks ]  [ Kill Zones ]  [ SMT Divergences ] How to trade using Order Blocks :  Click here User Interface Performance:  During testing in the strategy tester, the UI may experience lag. Rest assured, this issue is specific to the testing environment and does not affect the indicator's performance in live trading. Elevate your trading strategy with the  Order Blocks ICT Multi TF  indicator, a cutting-edge tool designed to enhance your trading decisions through advanced o
Timeframes Trend Scanner   is a trend analyzer or trend screener indicator that helps you know the trend in   all timeframes of selected symbol you are watching . This indicator provides clear & detailed analysis results on a beautiful dashboard, let you able to use this result right away without need to do any additional analysis. How it works Step 1: Calculate values of 23 selected & trusted technical indicators (Oscillator & Moving Average indicators) Step 2: Analyze all indicators using bes
Precision trading: leverage wolfe waves for accurate signals Wolfe Waves are naturally occurring trading patterns present in all financial markets and represent a fight towards an equilibrium price. These patterns can develop over short and long-term time frames and are one of the most reliable predictive reversal patterns in existence, normally preceding strong and long price movements. [ Installation Guide | Update Guide | Troubleshooting | FAQ | All Products ] Clear trading signals Amazingly
Visual Heatmap Book Analyzer
Alexandre Moraes De Souza Lima
Visual Heatmap Book Analyser This indicator monitors the market liquidity and generates colors based on order patterns, quantities, and renewal activities in the book. This allows you to visualize the order flow and identify areas of high and low liquidity and activity. The indicator uses machine learning techniques to analyze the order behavior in the book, enabling it to detect patterns and trends in orders, allowing you to make informed decisions about your trading operations. The color pale
MT4 Version SMT Divergences MT5 SMT Divergences is one of the most innovative indicators in the market. It offers the possibility of analyzing price divergences between 2 pairs. These divergences highlight and help to foresee what banks and institutions are planning to do. SMT divergences also provides you with a kill zones indicator and the possibility of filtering divergences occurring during these kill zones.  This indicator is specially powerful if applied in 2 highly correlated pairs. A pri
Pro Thunder V10: Nihai Binomo Seçenekleri Ticaret Göstergesi! Pro Thunder V10 ile ticaretinizi bir üst seviyeye taşıyın, binomo seçenek ticaretinde zirveye ulaşın! Yapay Zeka Destekli Sinir Ağları teknolojisiyle güçlendirilen bu devrim niteliğindeki gösterge, rakipsiz hassasiyet ve güvenilirlik sunmak için tasarlandı. Gerçek zamanlı, yeniden çizilmeyen sinyallerden, piyasaların en volatil koşullarında bile kesintisiz performansa kadar Pro Thunder V10 sizin en güçlü ticaret ortağınız.
Yazarın diğer ürünleri
VolumeProfile
Robert Hess
3.8 (5)
Descption: The Volume Profile displays detailed informations of historical trading activities at certain price levels (Market Profile). So you can locate the areas with the best prices in the market and get an advantage about other market participants. Features: Customizable Volume Profile / Market Profile Shows the "fair" Value Area with 70% of all Volume Shows critical low volume zones Shows VPOC, VAL and VAH Points Works on all timeframes Also available for MT5 ( https://www.mql5.com/en/mark
Description: TrendAccess can optimize your trading time by showing you the trend via two different calculation modes quick and easy. No more searching for Trends. Just open the chart and look at the trend display. Features: Shows Uptrend, Downtrend and "No Trend" indicator Shows the calculated ZigZag Profile Works on all timeframes Two different calculation Modes (MACD and Candle-based calculation) Settings: Variable  Standard Value Description  Calculation Mode  Candle based  Choose betwe
Description This addon is originated from my own trading. I spent my whole time waiting for signals and just wanted a notification  when a specific signal appears. So i started to wrote my own addon and called it "LifetimeSaver", because thats exactly what it is for me. But because this addon should not only be for my personal trading, I extended the LifetimeSaver and now its highly customizable,  so that it can fit your needs. Functions: Notification at your defined target/signal Notification
Description: The Multi POC displays multiple Point Of Controls on one chart.  This Indicator is also already included in the "VolumeProfile" Indicator . Features: Customizable Range POC Customizable section POCs with VAL&VAH lines Works on all timeframes Drag & Drop for live calculation Support: The indicator is constantly being developed and improved. Please do not hesitate to contact me via the MQL5 Platform. I am very grateful about any Bug report, so that i can constantly improve the indic
Filtrele:
Douglas De Souza Goncalves
16
Douglas De Souza Goncalves 2023.11.29 22:55 
 

I migrate to another account with the same broker but the indicator doesn't work... do I need to do some activation or something like that for the indicator to work again? thank you very much

Jan Patzig
51
Jan Patzig 2023.08.09 15:42 
 

Supaaaaa...

RuedigerWuest
24
RuedigerWuest 2022.06.25 15:26 
 

Ich find das Tool sehr gut gelungen und hilfreich. Leider läuft es auf meinem Windows 11 Notebook nicht mehr. Nur unter Windows 10 läuft es bei mir.

00023867
139
00023867 2022.02.09 16:20 
 

a very good indicator

271811
199
271811 2022.01.26 18:04 
 

Please BEWARE of Fake Reviews by this seller!!Dont waste your money!! VERY BUGGY!! indicator options does not work correctly!!

No I am not selling my own product!! Im not a coder or programmer!! Mr Hess Volume Profile

is no good! It blinks when you change options...Terrible coding IMO!! Dont believe me, go ahead and purchase!!

Robert Hess
1668
Geliştiriciden yanıt Robert Hess 2022.02.09 16:52
My Opinion: I think this is an account of somebody who is selling his own products and rate others bad, so he can sell his own stuff better. The Story: He bought (edit: *rented) the indicator for a Month, seemed very happy and all of a sudden he mentioned various "bugs". I wanted to help him, told him to give me the neccesary informations that I needed to look where exactly the problem is, because: I tested every setting on every timeframe and nearly every chart but couldnt find these issues that he mentioned. I even implemented a new feature on the MT4 version especialy for him. But neither he wanted to be helped, nor could I find any bug in the indicator!?
Lagoon3800
19
Lagoon3800 2021.11.08 10:40 
 

Hallo! Habe Volume Profile am 2.11.2021 für 165$ hier erworben, mir wurden 196,35 von Paypal abgebucht - absolut unfair. Wo findet man eine genauere Anleitung um auch alle Feinheiten dieses Indikators nutzen zu können?

Robert Hess
1668
Geliştiriciden yanıt Robert Hess 2021.12.03 10:50
Hallo Lagoon3800, wie bereits erwähnt findest du eine umfassende Tabelle in der allgemeinen Übersicht des Indikators. Die 19% die du zusätzlich per PayPal bezahlt hast sind leider als Mehrwertsteuer (VAT) in Deutschland fällig. Dafür können weder ich, noch der Webseitenbetreiber etwas. Ich hoffe ich konnte dennoch zu Aufklärung beitragen :) Robert
CSG CSG
1641
CSG CSG 2020.06.05 11:59 
 

Jeden Euro wert! Ich finde es schade, dass manche Leute Bewertungen abgeben und dann auch noch aufgrund ihres mangelnden Wissens negative... Ich arbeite schon länger mit diesem Profil und nach diversen Tests und Fehlkäufen anderer Anbieter stimmen hier die Daten perfekt! Worauf kommt es eigentlich an? 1. Wenn ich rückwärtigen Raum betrachte, z.B. im M5 30 Tage als Profil darstellen will, muss ich 8640 Perioden nutzen, hier versagen manch andere, denn dort stellt man "Monat" ein und es wird nur auf die Daten der Monatskerze zugegriffen, was natürlich, je jünger der Monat ist nichts bringt. 2. Dieser Indikator hier aktualisiert sich sauber und das auch in volatilen Situationen, glaubt mir, wenn es richtig um Geld geht, ist es sehr ärgerlich, wenn ein Indikator die ganze Plattform aufhängt. 3. Man kann den Indikator mehrfach auf einen Chart verwenden und dann sieht man auch beim Umschalten die gleichen Daten, wenn man diese auch entsprechend einstellt. (Visualisierung z.B. nur in H1, dann Perioden 720 wenn man 30 Tage darstellen will) 4. Man kann Farbe, Skalierung, links rechts... alles frei gestalten und wenn gewünscht auch nur die Linien anzeigen. 5. Wenn man wirklich mit einem Indikator arbeitet, dann holt man den Preis dafür bereits nach 1 oder ein paar Trades wieder rein und hier stimmt P/L absolut, was man hier sicher von einigen 10 oder X Euro Produkten nicht sagen kann. 6. Bevor man etwas negativ bewertet, sollte man sich mit der Systematik dahinter beschäftigen und niemand zwingt einen etwas zu kaufen, ein Top Produkt aber aufgrund der eigenen Fehlentscheidung schlecht zu bewerten ist absolut daneben und solche Leute werden auch nie erfolgreich sein, denn sie suchen die Schuld für ihre eigenen Fehler bei anderen. Warum schreibe ich das alles? Weil ich absolut zufrieden mit dem Produkt bin, man auch mit dem Entwickler kommunizieren kann, er es immer aktiv weiter entwickelt und weil es mich ärgert, wenn jemand etwas ohne ausreichende Fachkenntnis schlechter bewertet. Absolute Empfehlung und außerdem - man kann es ja auch erst mal einen Monat testen. Danke und weiter so :-)

James Lavoie
56
James Lavoie 2019.05.14 15:18 
 

Kullanıcı incelemeye herhangi bir yorum bırakmadı

Robert Hess
1668
Geliştiriciden yanıt Robert Hess 2021.04.25 13:54
Hi James, i wanted to solve the problems with you, but sadly you didnt answered. I think one star isn't what the indicator deserve.
Faisal Javed
803
Faisal Javed 2019.04.24 23:29 
 

Excellent tool and helpful as a part of your trading strategy. Highly recommened.

İncelemeye yanıt
Sürüm 1.43 2023.07.24
- Added VAL/VAH lines to "Section POC" Option
Sürüm 1.42 2022.05.12
New Feature:
- Customer request: A POC of the current period will now be calculated/displayed
-> You can change the gap between the current candle and the last period section line with a new input field
Sürüm 1.41 2022.05.06
- Usability improvements
Sürüm 1.40 2022.05.02
New Features:
- Set section POC to be tied to period separators
Sürüm 1.39 2022.04.29
New Features:
- implemented a "Section POC"
-> You can now show a POC for multiple sections in the chart
Sürüm 1.38 2022.04.29
New Features:
- Drag & Drop Line for Start and End time of the Indicator calculation

Other:
- Code optimization
- Usability improvements
Sürüm 1.37 2021.12.20
BugFix
- fixed a bug where a zoomed in chart broke the Indicator

Change
- the "Scale" represents now the percentage of the Chart to be covered by the VolumeProfile
-> Changed the default value of "Scale" from 4 to 10 (10% of Chart will be covered)
Sürüm 1.36 2021.10.11
Implemented Feature Request:
- Bar History: You can now insert the History in Bars for every single timeframe and select/switch if you wish to use your custom settings or the general "Bar History" that is the same for every Time Frames (Button "Set custom History values (below)")
Sürüm 1.35 2021.07.02
- Fixed the appearance in "Mirrored to left side" mode, it should now look as in unmirrored mode
Sürüm 1.34 2021.06.11
New Feature:
- You can now adjust the percentage for the "Value Area"
Sürüm 1.33 2021.06.11
- Changed calculation of the profile to improve accuracy
Sürüm 1.32 2021.04.25
- Optimization of some processes to reduce CPU usage
Sürüm 1.31 2021.04.22
BugFix
- the VolumeProfile no longer recalculates if an object in the chart has been dragged
Sürüm 1.30 2021.03.13
- Added a History line, that shows to which time the VolumeProfile will be calculated (Bar History)
- Added a Drag & Drop function for the History line. You can now move the History line, to recalculate the VolumeProfile to the specified point on the chart
Sürüm 1.29 2021.01.17
- Calculation of auto Detail for high volume charts changed for an optimized look of the VolumeProfile
Sürüm 1.28 2020.12.07
- Bugfixes
Sürüm 1.27 2020.12.04
- Added function for minute calculation when the period changes
Sürüm 1.26 2020.09.30
- In standard settings, the VolumeProfile will now refresh every 10 Seconds

Added new Parameters:
- "Refresh Auto": Set this to true, if you want the VolumeProfile to refresh automaticaly
- Refresh rate: Adjust the refresh timer in seconds
Sürüm 1.25 2020.07.20
Changes:
- Bar History default value is now 1440!

Bugfixes:
- Some minor changes to fasten up the initialisation of the VolumeProfile
Sürüm 1.24 2020.07.06
Bug Fix:
- The VolumeProfile will now redraw, if the timeframe has changed
Sürüm 1.23 2020.06.03
Changes:
- it is now possible to hide the VolumeProfile and only show the POC and VHigh/VLow Lines via the "Enable Volume Profile" Switch
Sürüm 1.22 2020.06.03
BugFix:
- Objects you created will no longer be deleted if you change the period
Sürüm 1.21 2020.06.03
Changes:
- you can now "scale" the VolumeProfile in mirrored Mode
Sürüm 1.2 2020.05.09
New Function:
- Mirror to left side: Mirrors the VolumeProfile to the left side of the chart

Changes:
- Added "Mirror to left side" function
- changed the description of inputs
- "auto set X-Position" -> Horizontal Position (auto)
- "X-Position" -> Horizontal Position (manual)
Sürüm 1.1 2019.04.09
Initial release