Statistical support Resistance
- Göstergeler
- Yaser Sabbaghi
- Sürüm: 1.340
- Güncellendi: 21 Temmuz 2024
- Etkinleştirmeler: 5
Set TP and SL like Financial Institutions
Traders' TP expectations do not often occur and their SL often hits when they only rely on primitive indicators like pivot-points and Fibonacci or classic support or resistance areas. There are a variety of indicators for support/resistance levels, whereas they are seldom accurate enough. Classical support/resistance indicators, often present miss levels and are not noteworthy based on current market volatility dynamic. Fibonacci is good but not enough, while the 61.8 % Fibonacci level breaking off is often experienced by traders or price action at that level is not significant as expected. Pivot points are not always accurate, so expected price action at pivot levels often presents minor, and relying on it could finish with SL hit. Round numbers or Moving averages are inconsistent and uncertain, so traders do not know how high likely the price will break out or react.The uncertainly of support and resistance levels is observed when traders apply static levels, while they are not static.
An innovative indicator that present Support Resistance areas based on market dynamic
Support and resistance levels may change or become obsolete when the market volatility changes. At static support and resistance levels, the market reacts not only insignificant but also ignores them when the momentum is high. This contrary price action comes from the dynamic of the market and the dynamic of smart-money's expectations. So it could not be very accurate to rely on last day OHLC to determine today's supports and resistance levels when recent volatility, highest price, lowest price, and volatility standard deviations carry a significant role in market dynamics.
Follow Smart Money footprints and trade like financial institutions
Capital placed in the market by institutional investors, market mavens, central banks, funds, and financial professionals is called smart money. Trading patterns of institutional traders diverge from retail traders and address to smart money performs better. Support levels are formed when smart money enter the market for long or exit from short positions. Resistance levels also are formed when smart money exit from long positions or take short entry positions. The entry and exit levels derive from smart money targets or expectations. They always update their targets and expectations based on news, event, and economic calendar projection. Successful traders need to follow the smart money and investigate their movement tracks, while market volatility shows the smart-money's footprints.
So what is the solution?
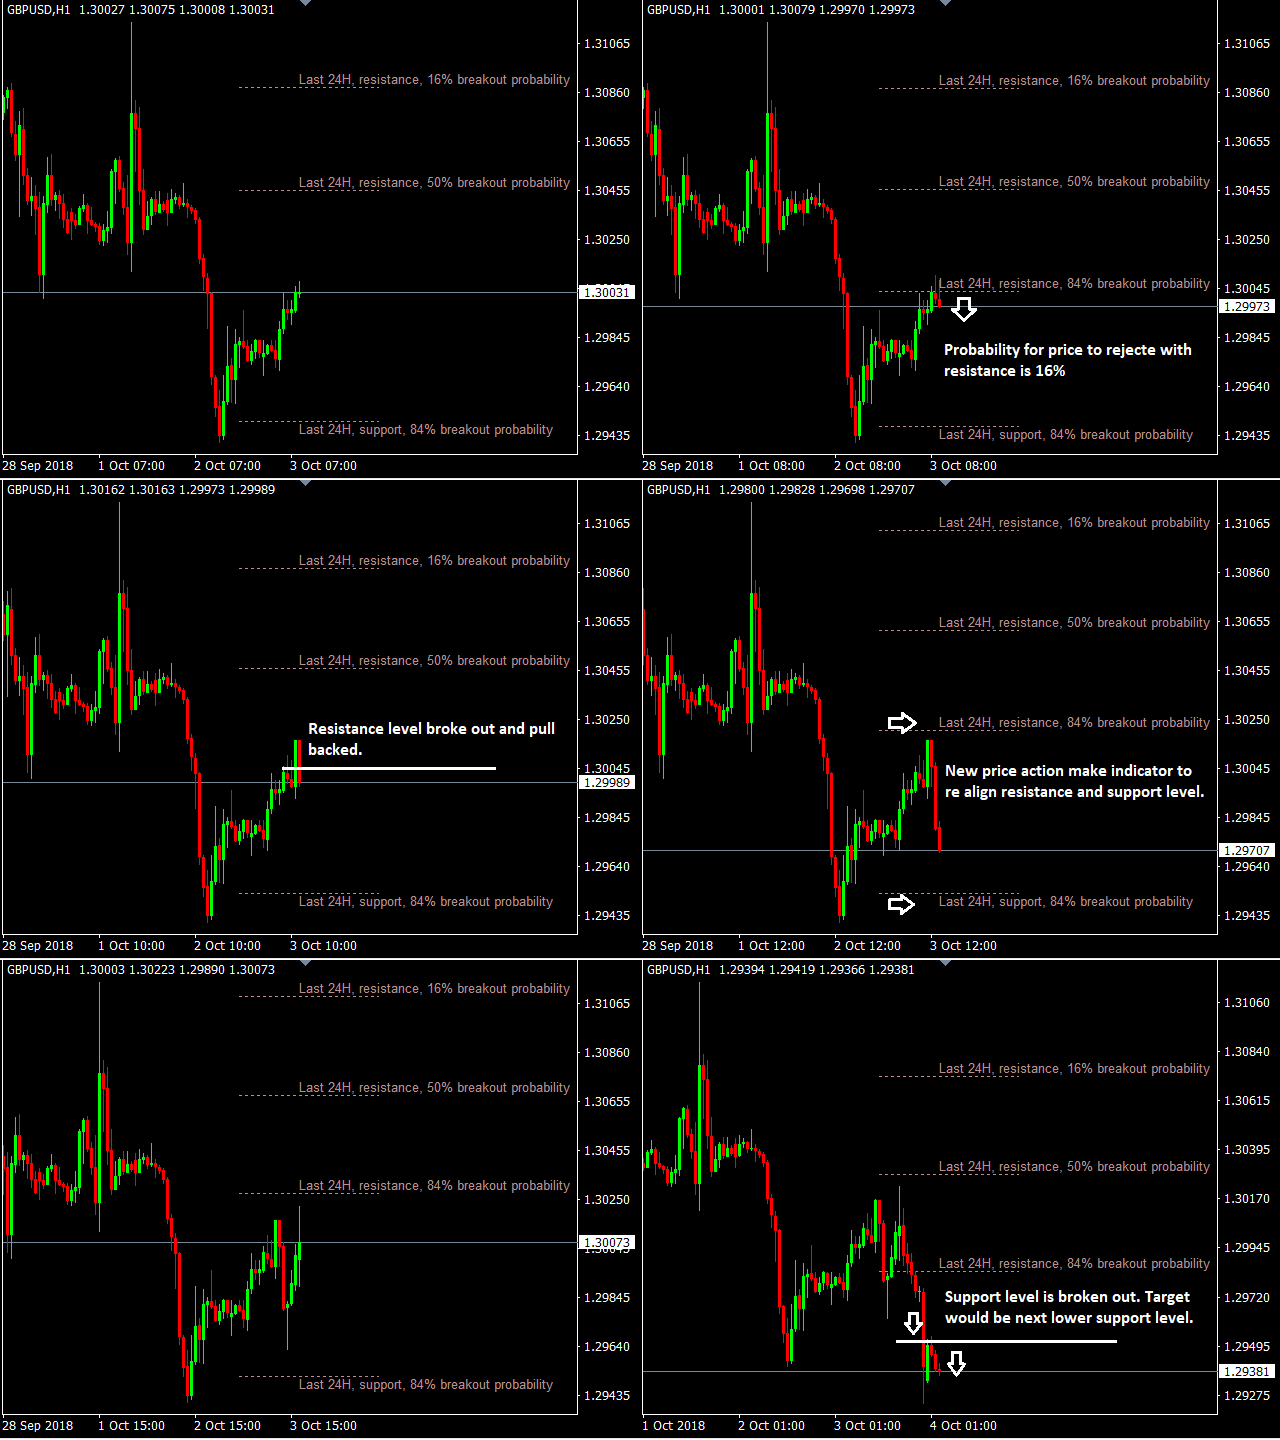
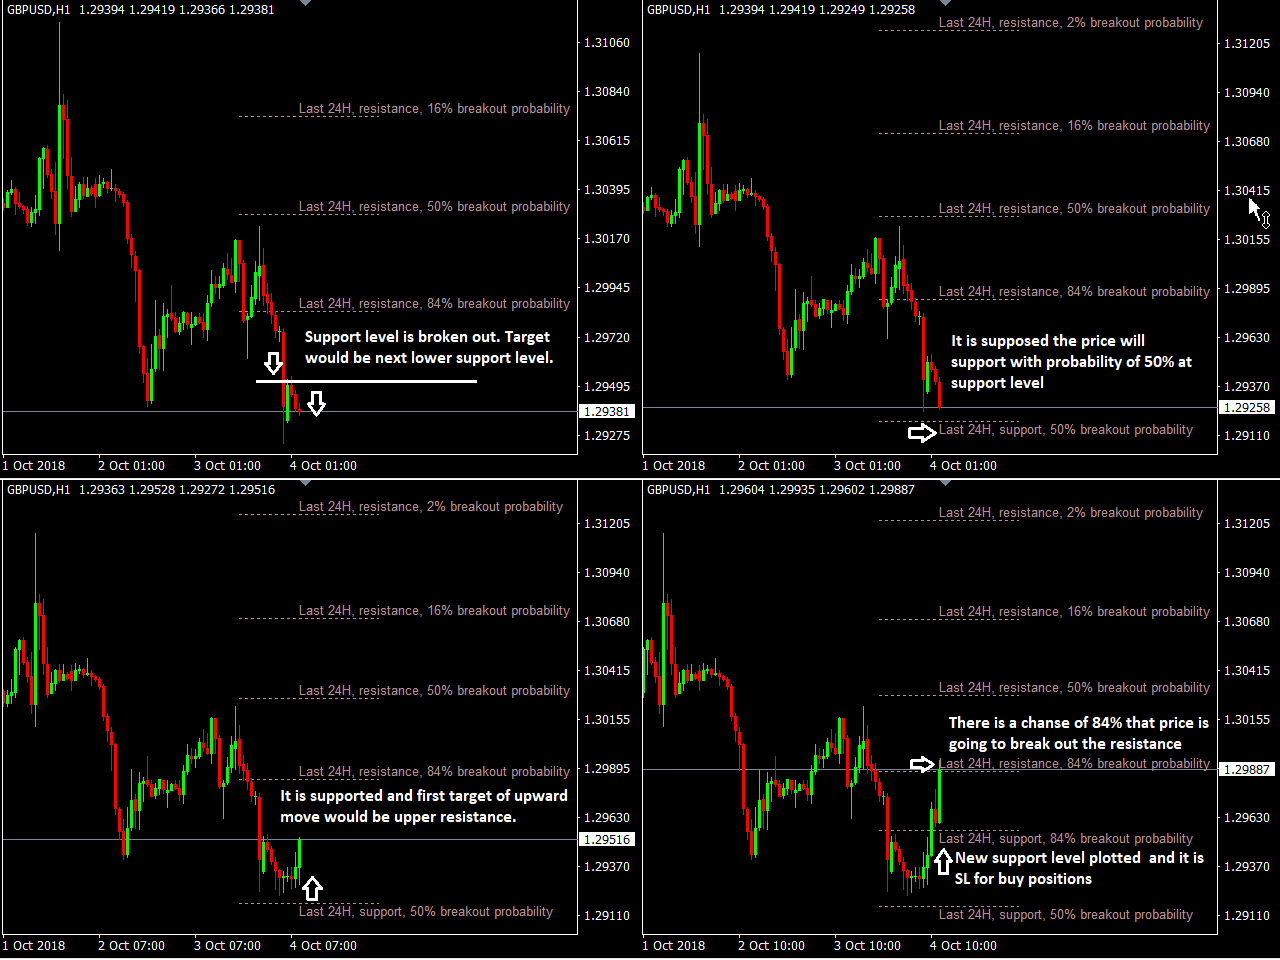
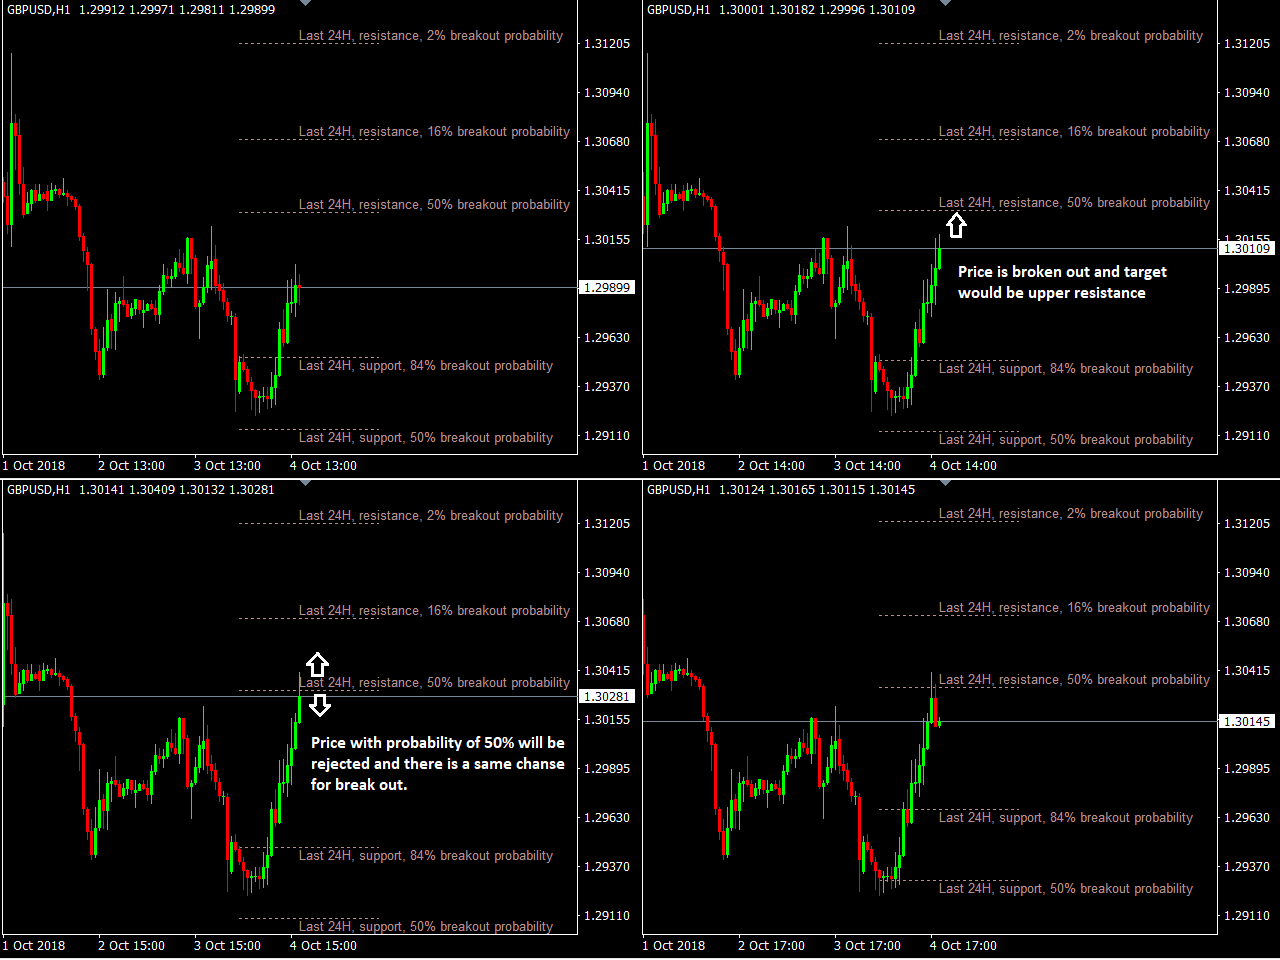
This indicator estimates price action expectations and targets by a statistical study of price history and taking the recent highs and lows into account in addition to volatility standard deviation. It draws sophistical levels based on statistics and probability with putting in market volatility. It reinforces traders to set TP or SL and project targets to levels, carrying the market dynamic and representing accuracy probability.
Not only for FX and CFD but also these characteristics make this indicator unmissable to binary options traders who need to know a target and its reaching probability.
Features:
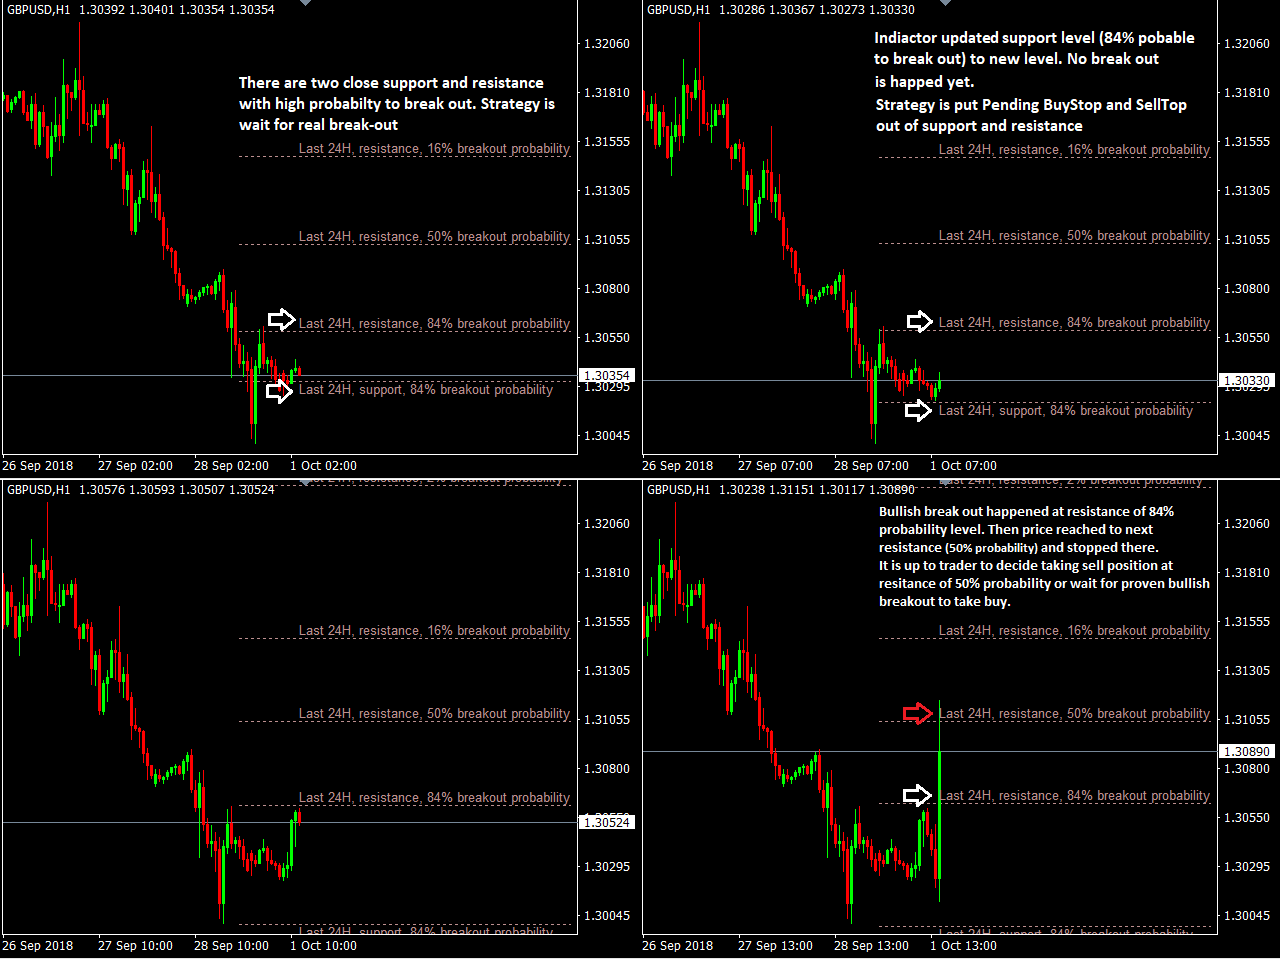
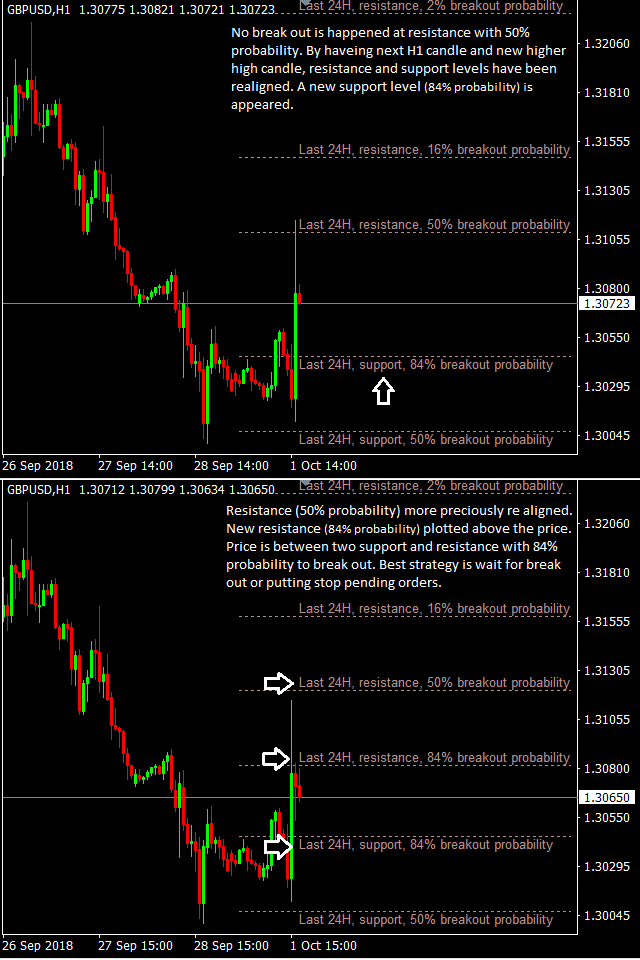
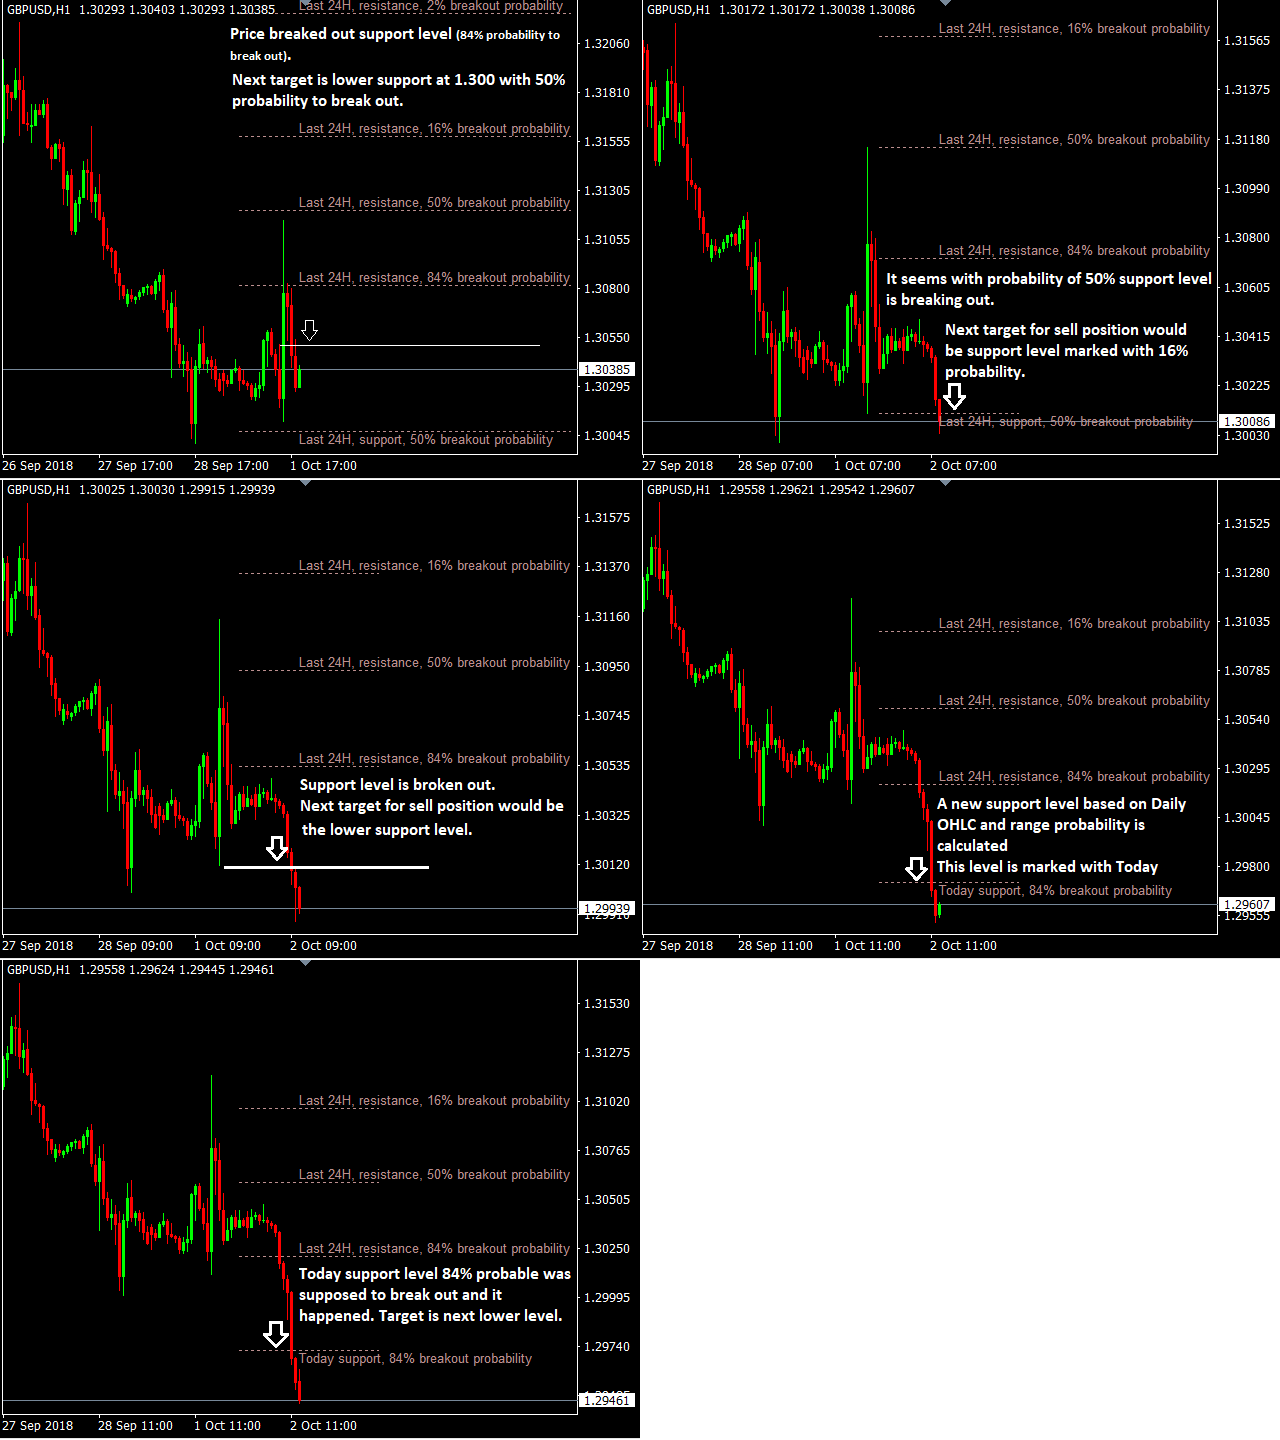
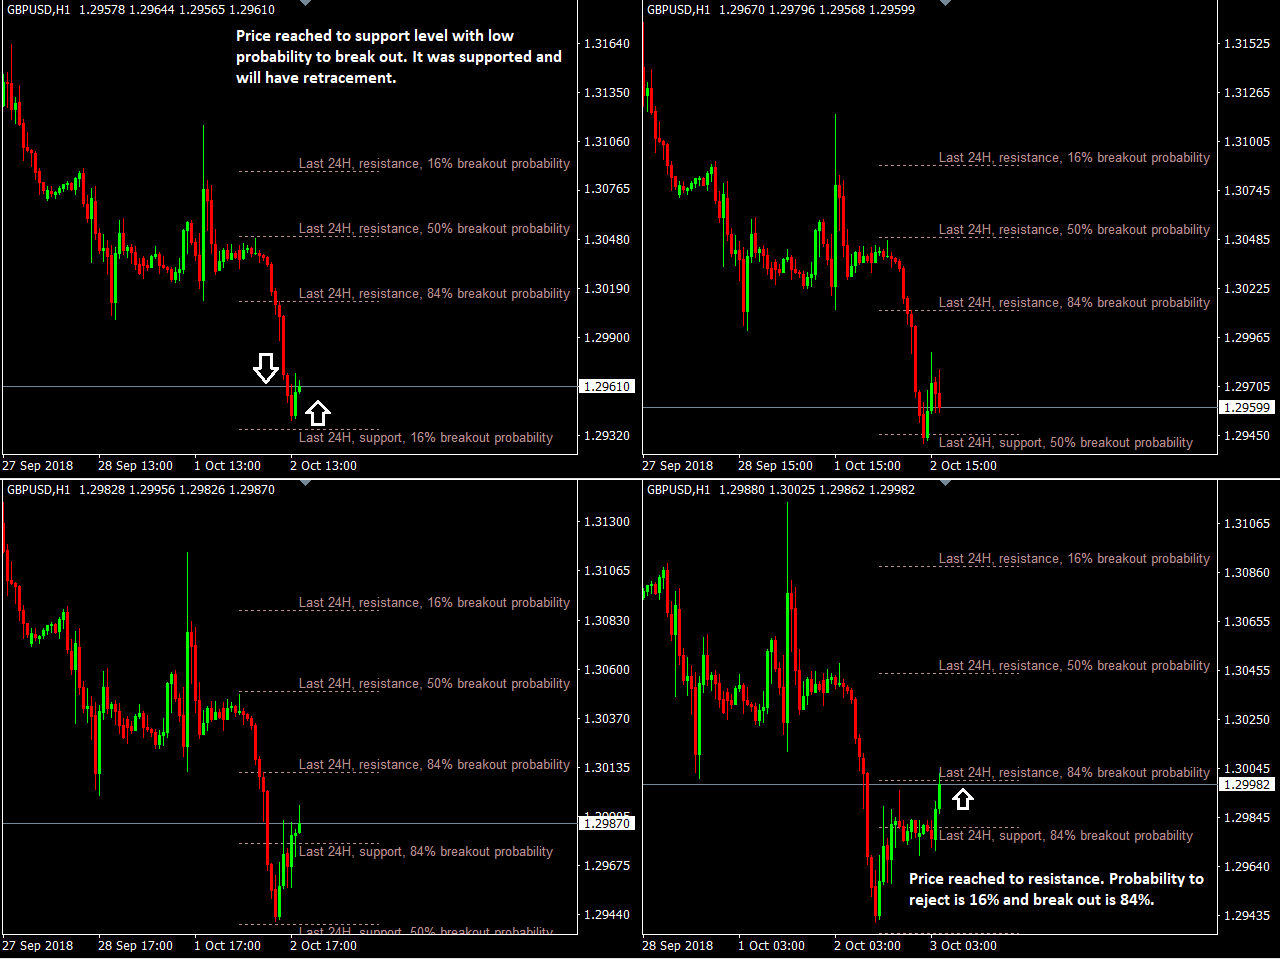
- Show four levels of support and four levels of resistance
- Each level has specific break out probability
- Calculation is based on last 24 hourly candles
- In some cases, calculation is based on only today OHLC Candle
- Prevent trader being trapped by SL hunting
- Determine how much is the probability that price may break out the level
- Show spread of symbol and remained time that the candle get close
- Levels are dynamic so new candles may results new levels
- It shows trend direction as
Inputs:
| Input | Options and Description |
|---|---|
| Levels' type | Support/Resistance | Price only | Description off | Shifted |
| Levels at previous candles | number of candle to shift |
| Time Frame | Show levels for specified time frame |
| Alert at weak levels | levels of 16% and 50% |
| Alert at strong levels | levels of 84% and 98% |
| Send mobile push notification | Enable/Disable |
| Show Levels | All levels | 16% | 50% | 84% | 98% | Show Trend line |
An finally you can read this article as step by step guide to buy and install EA or Indicator.







I have bought many indicators from MQL5 and this is the first product I am giving a five star rating. Well worth the purchase. It can be improved further if you could add a feature of distance to the nearest support and resistance in terms of pips etc which is variable with price movement.