• Genel bakış
  • İncelemeler (19)
  • Yorumlar (6)
  • Yenilikler

Time Scale for MT5

4.88

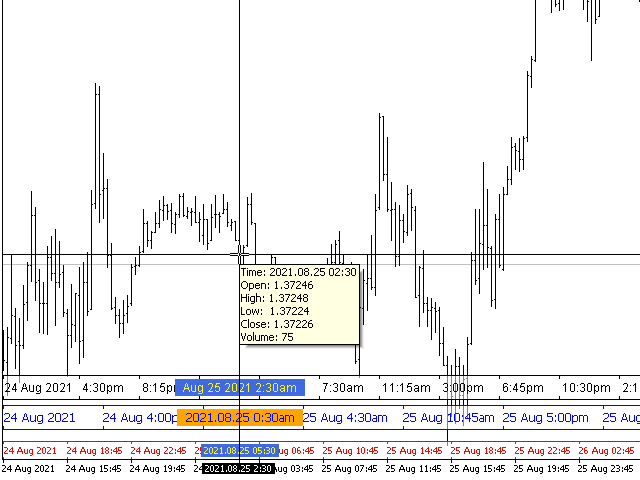
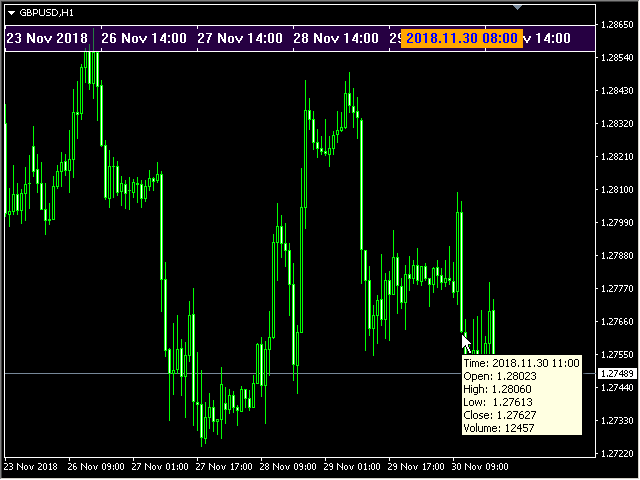
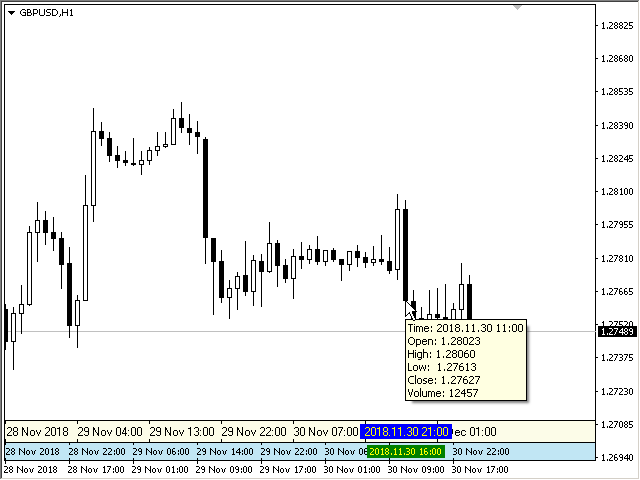
The indicator draws the time scale on the chart. You can specify the time offset, adjust the size and font to display on the chart (it is displaying your local time on your chart instead of MT time). You can also select the desired format for displaying the date and time.

You may be interested in my other product, which contains a more advanced version of the Time Scale.

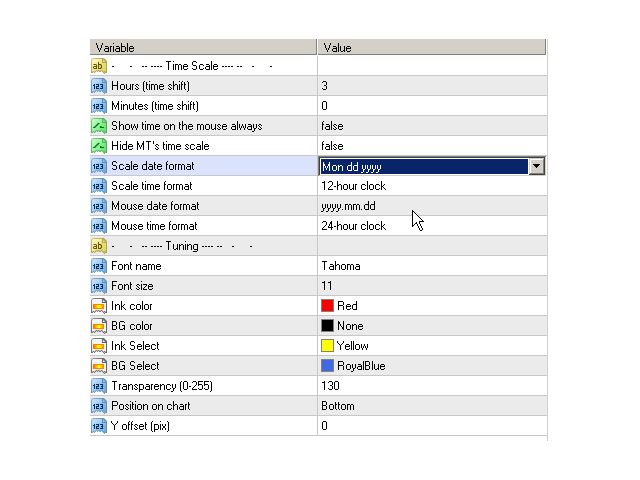
Parameters

  • Hours (time shift) — time shift (hours);
  • Minutes (time shift) — time shift (minutes);
  • Show time on mouse — show time under the pointer;
  • Precise time scale  — calculate the time between bars;
  • Hide MT's time scale — hide the standard scale;
  • Scale date format — format for the date on the scale;
  • Scale time format — format for time on the scale;
  • Mouse date format — format for the date under the mouse pointer;
  • Mouse time format — format for the time under the mouse pointer;
  • Font name — choose a font;
  • Font size — font size;
  • Ink color — color of the ink of scale;
  • BG color — color of the background of scale;
  • Ink Select — font color for the selected date;
  • BG Select — background color for the selected date;
  • Transparency (0-255) — transparency of the background of the scale;
  • Position on chart — position on the chart;
  • Y offset (pix) — scale shift on the chart vertically.


İncelemeler 19
spot007
93
spot007 2024.05.02 06:01 
 

Fantastic product. I really love this. Easy to set up, easy to use. So simple and does exactly what I need. Thank you!

Darvero
97
Darvero 2024.03.26 21:46 
 

Отличный индикатор, спасибо.

nestor jose
28
nestor jose 2024.03.16 17:47 
 

Excelente

Önerilen ürünler
This indicator will mirror the assets in use in another metatrader, being able to choose the timeframe and a template. This is the Metatrader 5 Client, it needs the Metatrader 4 or 5 Server versions: Metatrader 4 Mirror Chart Server:   https://www.mql5.com/en/market/product/88644 Metatrader 5 Mirror Chart Server: https://www.mql5.com/en/market/product/88652 Details of how it works in the video.
FREE
DBS Time
Dmitriy Burlachenko
5 (3)
A small utility displays the time in five time zones. You can customize the display of one to five time zones. For each time it is configured: show or not; name; time offset from GMT; color; In general settings, you can change: date / time format ("hh: mi", "hh: mi: ss", "yyyy.mm.dd hh: mi", "yyyy.mm.dd hh: mi: ss") font name; font size; offset from the left edge of the chart; offset from the top edge of the chart;
FREE
Tick Bars
Henrique Helmuth Kreutz Pfeifer
Indicator that show candlestick bars with an different sampling method than time fixed. Real time data is sourced to the indicator and it may be used as substitute of the default graph. Each bar is formed when a predefined amount of ticks is received, showing in the graph the OHLC of this clusteri of ticks. The input variable is the amount of ticks of each bar. It's a different approach of sampling, the amount of bars is proportional to the amount of negotiations insted of a sample in a fixed am
FREE
Timer Countdown
Makarii Gubaydullin
5 (2)
Countdown timer till the bar closure, + % Progress status:  My   #1 Utility :   includes 65+ functions  |   Contact me  if you have any questions In the settings of the indicator, you can configure: Timeframe for Calulculation; true / false:   Higher TimeFrame option (next from the currently used: M15->M30, H4->D1...) Position: 1 = Bottom Left corner; 2 = Bottom Right corner; 3 = Top Left corner; 4 = Top Right corner; Font Size; Color; Font Style;
FREE
Forex Hesaplayıcı       her tüccar için olmazsa olmaz bir programdır. Bu komut dosyası, pip cinsinden ayarlanmış Zarar Durdur'a bağlı olarak bir mevduatın yüzde riskini yüzde olarak hesaplamanıza olanak tanır. Komut dosyasının avantajları: Her ticarette neyi riske attığınızı her zaman tam olarak bilirsiniz Hesaplayıcı, sözleşme özelliklerini dikkate alır Pip cinsinden veri girişi riski ve Stop Loss boyutu için sadece 2 sütun Önerilen Robot Scalper -       https://www.mql5.com/en/market/product/
FREE
Introducing a powerful MetaTrader 5 Expert Advisor designed to enhance your trading strategy – the Auto Breakeven EA! This feature-rich EA is tailored to bring your stop-loss to breakeven, ensuring a risk-free trade once the market moves in your favor up to a specified price. Explore the full potential of the Auto Breakeven EA. Download it for free now, and find the download link at the bottom of our page. Elevate your trading experience and take control of your risk management strategy. Happy
FREE
This is a free version and is forecasting only 5 bars The FourierExtrapolationMAFree indicator transforms and extrapolates the Moving Average function by the Fast Fourier Transformation method. 1. The transformation period is set by two vertical lines, by default the first blue line and the second pink. 2. By default, the Moving Average (MA) line is drawn in red. 3. By Fourier Transform, the indicator builds a model of N harmonics, which is as close as possible to the MA values. The model
FREE
This indicator displays fractal symbols and bars Use this indicator to show different symbols for bearish and bullish fractals: Choose from 144 symbols (refer to table below) Colors, size and offset of fractals can be modified Fractal price bar or candle color can be changed Hide fractals and show fractal price bar only Frequency in fractal calculation can be changed How to use 1. Select which symbols to use for bearish and bullish fractals; 2. Select which colors to use for bearish and bulli
FREE
Indicador de Volume
Edilson Domingos
4.5 (2)
This indicator is a volume indicator it changes the color of the candles according to a certain number of ticks, and this number of ticks can be informed by the user both the number of ticks and the color of the candles, this indicator works in any graphical time or any asset, provided that the asset has a ticker number to be informed. This indicator seeks to facilitate user viewing when analyzing candles with a certain number of ticks.
FREE
Institucional Color Candle
Jean Jacques Huve Ribeiro
4.88 (8)
Idea extracted from the books by Anna Coulling and Gavin Holmes using Volume and Spread Analysis (VSA) techniques coupled with Al Brooks' expertise with Price Action these candles are magical, identify the exact moment   of the performance of the big players are acting in the market represented by the colors: 1) Red Candles we have an Ultra High activity, 2) Candles Orange we have a Very High Activity 3) Candles Yellow we have one High Activity 4) White Candles represent normal activ
FREE
Show Pips for MT5
Roman Podpora
4.61 (18)
This information indicator will be useful for those who always want to be aware of the current situation on the account. - More useful indicators The indicator displays data such as profit in points, percentage and currency, as well as the spread for the current pair and the time until the bar closes on the current timeframe. There are several options for placing the information line on the chart: - To the right of the price (runs behind the price); - As a comment (in the upper left corner
FREE
This indicator show Gann Swing Chart (One Bar) with multi layer wave. 1. Wave layer   F1: Gann waves are drawn based on candles. SGann wave(Swing of Gann) is drawn based on Gann wave of wave layer   F1. 2. Wave layer F2: Is a Gann wave drawn based on the SGann wave of wave layer F1. SGann waves are drawn based on Gann waves of wave layer   F2. 3. Wave layer F3: Is a Gann wave drawn based on the SGann wave of wave layer F2. SGann waves are drawn based on Gann waves of wave layer   F3. ---------Vi
FREE
The indicator highlights in color the places on the chart where the price moves in one direction continuously from the selected number of candles. You can specify the number of points from the beginning of the movement to select only movements from this amount. It can be useful for looking for reversals or sharp impulses. I also recommend purchasing this utility to determine local weekly / monthly trends and support and resistance lines. https://www.mql5.com/en/market/product/61401
FREE
Volume Candlestick Bars
Henrique Helmuth Kreutz Pfeifer
Indicator that show candlestick bars with an different sampling method than time fixed. Real time data is sourced to the indicator and it may be used as substitute of the default graph. Each bar is formed when a predefined volume of assets was dealt, showing in the graph the OHLC of this clustering. The amount of bars is proportional to the amount of negotiations instead of a sample in a fixed amount of time. If the broker doesn't show the real volume of the trades, this indicator won't work. Th
FREE
Important Lines
Terence Gronowski
4.88 (26)
This indicator displays Pivot-Lines, preday high and low, preday close and the minimum and maximum of the previous hour. You just have to put this single indicator to the chart to have all these important lines, no need to setup many single indicators. Why certain lines are important Preday high and low : These are watched by traders who trade in a daily chart. Very often, if price climbs over or falls under a preday low/high there is an acceleration in buying/selling. It is a breakout out of
FREE
Prop Edge Heartbeat
Nuno Madeira Amaro Pire Costa
5 (1)
EA to prevent inactivity violations on prop firms. This EA will scout for your most recent trade and if it is older than the number of days defined, will enter a micro lot position size 0.01 on the pair defined. It is recommended to use a tight spread pair like EURUSD. This EA will not act as long as you have at least one trade in the last X days (defined on config). This EA will not place other trades or modify existing position.
FREE
Account Info EA It is a tool that presents on the graph all the positions of the account, and specific information concerning the positions, but also the account. It enables the user to have an image of his account at a glance. Use like any expert advisor. You can't attach it in the same chart with other expert advisor. It does not have the ability to open or manage positions. You can attach it on any chart and any timeframe.
FREE
Expansoes M
Marcus Vinicius Da Silva Miranda
The M Extensions are variations of the Golden Ratio (Fibonacci Sequence). It is the World's first technique developed for Candle Projections. Advantages: Easy to plot. Candle anchoring; High and accurate precision as support and resistance; Excellent Risk x Return ratio; Works in any timeframe; Works in any asset / market.   The M Extensions are classified into: M0: Zero point (starting candle) RC: Initial candle control region M1: Extension region 1 M2: Extension region 2 M3: Extension r
FREE
Period separators
Mykola Demko
4.56 (9)
The Period separators indicator separates time periods, specified by user. It supports all timeframes, greater or aliquot to current timeframe. In case of the incorect timeframe, the indicator modifies it to closest correct value. Additional bonus - the separation of non-standard time periods - MOON, MOON/2, MOON/4 (moon phases). The separators are plotted using the indicator's buffers. The indicator uses one graphic object for information about the progress and current bar properties. The grap
FREE
Gm Volumes
Antonio Augusto Barreto De Melo
4.2 (5)
A simple volume indicator according to the color of the candle! - Custom background! - Supports Volume by Ticks or Real Volume. The original Metatrader Volume indicator does not show the colors of the bar according to the color of the Candle, it only changes color when the volume of a candle is greater than the previous one, this sometimes creates confusion for beginners and does not know the real reason for the color change. Free indicator, support may take a while to respond!
FREE
Understanding the levels of the previous day or week is very important information for your trading. This indicateur allow to draw Previous day High/Low Previous week High/Low Congifuration High & Low for: Previous day, week Line Style, color Label position, size, color Any questions or comments, send me a direct message here  https://www.mql5.com/en/users/mvonline
FREE
TradeMirror is a trade copier EA for MT4/MT5 platform. Why TradeMirror We understand the importance of security, stability and privacy for financial software, so we've gone the extra mile to harden these three elements in detail: Provides a user-friendly graphical interface that is easy to operate Focus on privacy and security, suitable for various financial scenarios with privacy requirements for order distribution Precise replication of orders, millisecond distribution Support full platform,
FREE
Know the Candle Close Time
Benbyaanda Silvere Henri Sedric Kabore
This indicator allows to know the remaining time before the closing of the candle. It works on every timeframe. It is very usefull when your trading strategy depend of the close or the open of a specific candle. So use it like you want. Don't forget to leave a comment or a request for a EA or an indicator. Also spread it to your friends and don't hesitate to visit my profile to see others tools.
FREE
The indicator draws a normal chart by coloring it in colors based on prices calculated by the Heiken Ashi indicator algorithm. That is, the shape of the candles does not change. In fact, this is the same Heiken Ashi that does not distort the price chart. Then there will be a drawing of a cat, because there is nothing more to write about the indicator. .                                                       
FREE
主要城市的时间。北京时间、东京时间、悉尼时间、惠灵顿时间、纽约时间、法兰克福时间、伦敦时间、迪拜时间。 城市时间可选择开启或者关闭。 点差变色提醒。设置点差提醒点数,例如,设置100点,点差大于100点,文字会变红色。 Time in major cities. Beijing time, Tokyo time, Sydney time, Wellington time, New York time, Frankfurt time, London time, Dubai time. City time can be turned on or off. Dot difference color change reminder. Set the point difference reminder points. For example, set 100 points. If the point difference is greater than 100 points, the text will turn red.
FREE
Bonus when buying an indicator or an advisor from my list. Write to me in private messages to receive a bonus. Manual Assistant MT5 is a professional manual trading tool that will make your trading fast and comfortable. It is equipped with all the necessary functions that will allow you to open, maintain and close orders and positions with one click. It has a simple and intuitive interface and is suitable for both professionals and beginners. The panel allows you to place buy and sell orders
FREE
Virtual Targets MT5
Hoang Van Dien
4.75 (8)
This indicator is very useful for day traders or short term traders. (MT5 version) No need to calculate the number of pips manually, just look at the chart and you will see the Virtual Take Profit / Virtual Stop Loss target line and evaluate whether the entry point is feasible to reach the intended target or not. Enter the intended   Take Profit / Stop Loss   pips for your trade. The indicator will display   Virtual Take Profit / Virtual Stop Loss   lines for you to easily see if the target i
FREE
HMA Color with Alerts MT5
Pavel Zamoshnikov
4.73 (52)
Hull Moving Average (HMA) is well-deservedly popular among traders because of the effective averaging of market noise and a relatively small delay. The current MetaTrader 5 version changes its color when the movement direction changes. Sound and text signals are available. It also supports sending email and push messages. It is possible to trigger a signal on the current incomplete bar, although such a signal may be canceled before completion if conditions are no longer appropriate. One of the p
FREE
Kesin işlem analizi parmaklarınızın ucunda: Yeni nesil işlem analizi yazılımı Piyasada bulunan ana akım işlem analizi yazılımları genellikle yalnızca saatlik veya haftalık kar ve zarar oranı istatistikleri sunar; bu da daha hassas işlem analizi ihtiyacını karşılamaktan uzaktır. Ancak, gerçek işlem piyasasında her gün benzersiz koşullar ortaya çıkar. Pazartesi günleri sakindir, çarşamba günleri üçlü gecelik faizle aktiftir ve cuma günleri önemli veri yayınlarının olması nedeniyle olağanüstü akti
FREE
Calculating the volume of orders every time you create an order is an extremely important thing in risk management Let this tool simplify your work! ----------------------------------------------------- How to use? Attach the indicator to the chart and set its parameters:  Risk size in %  or money and Risk Reward Ratio. Click on the ON button and locate the horizontal line to your would-be StopLoss level. Options: Click on the Pending/Instant button to locate the horizontal line  to your would-b
FREE
Bu ürünün alıcıları ayrıca şunları da satın alıyor
Öncelikle belirtmek gerekir ki bu Ticaret Göstergesi Yeniden Çizim Yapmaz, Gecikmez ve Gecikme Göstermez, bu da hem manuel hem de robot ticareti için ideal hale getirir. Kullanıcı kılavuzu: ayarlar, girişler ve strateji. Atom Analisti, Piyasada Daha İyi Bir Avantaj Bulmak İçin Fiyatın Gücünü ve Momentumunu Kullanan PA Fiyat Hareketi Göstergesidir. Gürültüleri ve Yanlış Sinyalleri Kaldırmaya ve Ticaret Potansiyelini Artırmaya Yardımcı Olan Gelişmiş Filtrelerle Donatılmıştır. Birden fazla katmanl
Öncelikle, bu Ticaret Sistemi'nin Non-Repainting, Non-Redrawing ve Non-Lagging Göstergesi olduğunu vurgulamak önemlidir, bu da hem manuel hem de robot ticareti için ideal hale getirir. Online kurs, kılavuz ve ön ayarları indir. "Smart Trend Trading System MT5", yeni ve deneyimli tüccarlar için özelleştirilmiş kapsamlı bir ticaret çözümüdür. 10'dan fazla premium göstergeyi birleştiriyor ve 7'den fazla sağlam ticaret stratejisi sunuyor, bu da çeşitli piyasa koşulları için esnek bir seçim yapar. Tr
Quantum Trend Sniper
Bogdan Ion Puscasu
4.91 (43)
Tanıtım       Kuantum Trend Keskin Nişancı Göstergesi   , trend tersine dönmeleri belirleme ve ticaret yapma şeklinizi değiştiren çığır açan MQL5 Göstergesi! 13 yılı aşkın ticaret tecrübesine sahip deneyimli tüccarlardan oluşan bir ekip tarafından geliştirilmiştir.       Kuantum Trend Keskin Nişancı Göstergesi       trend dönüşlerini son derece yüksek doğrulukla belirlemenin yenilikçi yolu ile ticaret yolculuğunuzu yeni zirvelere taşımak için tasarlanmıştır. ***Kuantum Trend Keskin Nişancı Gö
FX Power MT5 NG
Daniel Stein
5 (5)
Sabah Brifingimiz burada mql5 ve on Telegram! FX Power MT5 NG , uzun zamandır çok popüler olan döviz gücü ölçerimiz FX Power'ın yeni neslidir. Peki bu yeni nesil güç ölçer ne sunuyor? Orijinal FX Power hakkında sevdiğiniz her şey PLUS GOLD/XAU güç analizi Daha da hassas hesaplama sonuçları Ayrı ayrı yapılandırılabilir analiz dönemleri Daha da iyi performans için özelleştirilebilir hesaplama limiti Özel çokluDaha fazlasını görmek isteyenler için örnek ayarlar Her grafikte en sevdiğiniz renkler i
Gold Stuff mt5
Vasiliy Strukov
4.89 (178)
Gold Stuff mt5, özellikle altın için tasarlanmış bir trend göstergesidir ve herhangi bir finansal enstrümanda da kullanılabilir. Gösterge yeniden çizilmez ve gecikmez. Önerilen zaman dilimi H1. Ayarları ve kişisel bir bonusu almak için satın alma işleminden hemen sonra benimle iletişime geçin!  Güçlü Destek ve Trend Tarayıcı göstergemizin ücretsiz bir kopyasını pm'den alabilirsiniz. Ben!   AYARLAR Ok Çiz - açık kapalı. grafik üzerinde oklar çizmek. Uyarılar - sesli uyarılar kapalı. E-post
Reversal First Impulse levels (RFI)      INSTRUCTIONS        RUS       -       ENG              R ecommended to use with an indicator   -   TREND PRO -  Version MT4                 A key element in trading is zones or levels from which decisions to buy or sell a trading instrument are made. Despite attempts by major players to conceal their presence in the market, they inevitably leave traces. Our task was to learn how to identify these traces and interpret them correctly. Main functions:: Di
Trend Screener Pro MT5
STE S.S.COMPANY
4.88 (64)
Trend Göstergesi, Trend Alım Satım ve Filtreleme için Çığır Açan Benzersiz Çözüm, Tüm Önemli Trend Özellikleriyle Tek Bir Araç İçinde Yerleştirildi! Forex, emtialar, kripto para birimleri, endeksler ve hisse senetleri gibi tüm sembollerde/araçlarda kullanılabilen %100 yeniden boyamayan çoklu zaman çerçevesi ve Çoklu para birimi göstergesidir. Trend Screener, grafikte noktalarla ok trend sinyalleri sağlayan etkili bir trend trend göstergesidir. Trend analizörü göstergesinde bulunan özellikler: 1.
Öncelikle, bu Ticaret Aracının Non-Repainting, Non-Redrawing ve Non-Lagging Gösterge olduğunu vurgulamakta fayda var, bu da onu profesyonel ticaret için ideal hale getiriyor. Çevrimiçi kurs, kullanıcı kılavuzu ve demo. Akıllı Fiyat Hareketi Kavramları Göstergesi, hem yeni hem de deneyimli tüccarlar için çok güçlü bir araçtır. İleri ticaret fikirlerini, Inner Circle Trader Analizi ve Smart Money Concepts Ticaret Stratejileri gibi 20'den fazla kullanışlı göstergeyi bir araya getirerek bir aray
FX Volume MT5
Daniel Stein
4.94 (17)
Sabah Brifingimiz aracılığıyla ayrıntılar ve ekran görüntüleri ile günlük piyasa güncellemenizi alın burada mql5 ve on Telegram ! FX Volume, bir brokerin bakış açısından piyasa duyarlılığı hakkında GERÇEK bir fikir veren İLK ve TEK hacim göstergesidir. COT raporlarından çok daha hızlı bir şekilde, brokerlar gibi kurumsal piyasa katılımcılarının Forex piyasasında nasıl konumlandıklarına dair harika bilgiler sağlar. Bu bilgileri doğrudan grafiğinizde görmek, ticaretiniz için gerçek oyun değiştir
TPSproTREND PrO MT5
Roman Podpora
4.88 (8)
TPSpro TRENDPRO  - is a trend indicator that automatically analyzes the market and provides information about the trend and each of its changes, as well as giving signals for entering trades without redrawing! The indicator uses each candle, analyzing them separately. referring to different impulses - up or down impulse. Exact entry points into transactions for currencies, crypto, metals, stocks, indices!  -  Version MT4               DETAILED DESCRIPTION               R ecommended to use with
Top indicator for MT5   providing accurate signals to enter a trade without repainting! It can be applied to any financial assets:   forex, cryptocurrencies, metals, stocks, indices .  Watch  the video  (6:22) with an example of processing only one signal that paid off the indicator! MT4 version is here It will provide pretty accurate trading signals and tell you when it's best to open a trade and close it. Most traders improve their trading results during the first trading week with the help of
FxaccurateLS
Shiv Raj Kumawat
WHY IS OUR FXACCCURATE LS MT5 THE PROFITABLE ? PROTECT YOUR CAPITAL WITH RISK MANAGEMENT Gives entry, stop and target levels from time to time. It finds Trading opportunities by analyzing what the price is doing during established trends. POWERFUL INDICATOR FOR A RELIABLE STRATEGIES We have made these indicators with a lot of years of hard work. It is made at a very advanced level. Established trends provide dozens of trading opportunities, but most trend indicators completely ignore them!
AW Trend Predictor MT5
AW Trading Software Limited
4.78 (58)
Tek bir sistemde trend ve kırılma seviyelerinin kombinasyonu. Gelişmiş bir gösterge algoritması piyasa gürültüsünü filtreler, trendi, giriş noktalarını ve olası çıkış seviyelerini belirler. Gösterge sinyalleri, sinyal geçmişinin etkinliğini gösteren en uygun enstrümanların seçilmesine izin veren bir istatistiksel modüle kaydedilir. Gösterge Kâr Al ve Zararı Durdur işaretlerini hesaplar. Kılavuz ve talimatlar ->   BURAYA   / MT4 versiyonu ->   BURAYA Gösterge ile nasıl ticaret yapılır: Trend Pre
ICT, SMC, SMART MONEY CONCEPTS, SMART MONEY, Smart Money Concept, Support and Resistance, Trend Analysis, Price Action, Market Structure, Order Blocks, BOS/CHoCH,   Breaker Blocks ,  Momentum Shift,   Supply&Demand Zone/Order Blocks , Strong Imbalance,   HH/LL/HL/LH,    Fair Value Gap, FVG,  Premium  &   Discount   Zones, Fibonacci Retracement, OTE, Buy Side Liquidity, Sell Side Liquidity, BSL/SSL Taken, Equal Highs & Lows, MTF Dashboard, Multiple Time Frame, BigBar, HTF OB, HTF Market Structure
Bill Williams Advanced
Siarhei Vashchylka
5 (5)
Bill Williams Advanced is designed for automatic chart analysis using Bill Williams' "Profitunity" system. The indicator analyzes four timeframes at once. Manual (Be sure to read before purchasing) Advantages 1. Automatically analyzes the chart using the "Profitunity" system of Bill Williams. The found signals are placed in a table in the corner of the screen. 2. Equipped with a trend filter based on the Alligator indicator. Most of the system signals are recommended to be used only accordi
Fiyat tersine döndükçe ve geri çekildikçe piyasa yapısından elde edilen kâr değişir. Piyasa yapısını tersine çevirme uyarısı göstergesi, bir trendin veya fiyat hareketinin ne zaman tükenmeye yaklaştığını ve tersine dönmeye hazır olduğunu tanımlar. Genellikle bir geri dönüş veya büyük bir geri çekilme meydana gelmek üzereyken meydana gelen piyasa yapısındaki değişiklikler konusunda sizi uyarır. Gösterge, olası bir tükenme noktasının yakınında her yeni yüksek veya düşük oluştuğunda, başlangıçta
The Volume by Price Indicator for MetaTrader 5 features Volume Profile and Market Profile TPO (Time Price Opportunity). Volume and TPO histogram bar and line charts. Volume Footprint charts. TPO letter and block marker collapsed and split structure charts. Session filtering and grouping. Static, dynamic and flexible range segmentation and compositing methods with relative and absolute visualizations. Graphical layering, positioning and styling options to suit the user's analytic and aesthetic n
Easy By Sell is a market indicator for opening and closing positions. It becomes easy to track market entries with alerts. It indicates trend reversal points when a price reaches extreme values ​​and the most favorable time to enter the market. it is as effective as a Fibonacci to find a level but it uses different tools such as an algorithm based on ATR indicators and Stochastic Oscillator. You can modify these two parameters as you wish to adapt the settings to the desired period. My othe
Legacy of Gann for MT5
Pavel Zamoshnikov
5 (6)
The indicator very accurately determines the levels of the possible end of the trend and profit fixing. The method of determining levels is based on the ideas of W.D.Gann, using an algorithm developed by his follower Kirill Borovsky. Extremely high reliability of reaching levels (according to K. Borovsky  - 80-90%) Indispensable for any trading strategy – every trader needs to determine the exit point from the market! Precisely determines targets on any timeframes and any instruments (forex, met
"Piranha" - an autonomous trading system that determines overbought and oversold levels on the chart. Red and blue zones represent overbought and oversold levels respectively. Entry points are marked with arrows: a downward arrow in the red zone for "sell" and an upward arrow in the blue zone for "buy". The Take profit level is indicated by the green moving average. Key features: Adjusting the Take profit level as the green moving average changes position. Averaging ability when a new market e
Quantum Heiken Ashi PRO MT5
Bogdan Ion Puscasu
4.5 (8)
Quantum Heiken Ashi PRO ile   tanışın Pazar eğilimleri hakkında net bilgiler sağlamak üzere tasarlanan Heiken Ashi mumları, gürültüyü filtreleme ve yanlış sinyalleri ortadan kaldırma yetenekleriyle ünlüdür. Kafa karıştırıcı fiyat dalgalanmalarına veda edin ve daha sorunsuz, daha güvenilir bir grafik sunumuna merhaba deyin. Quantum Heiken Ashi PRO'yu gerçekten benzersiz kılan şey, geleneksel şamdan verilerini okunması kolay renkli çubuklara dönüştüren yenilikçi formülüdür. Kırmızı ve yeşil çubukl
Advanced Supply Demand MT5
Bernhard Schweigert
4.53 (15)
Herhangi bir Acemi veya Uzman Tüccar için En İyi Çözüm! Bu gösterge benzersiz, yüksek kaliteli ve uygun fiyatlı bir ticaret aracıdır çünkü bir dizi tescilli özelliği ve yeni bir formülü bir araya getirdik. Bu güncelleme ile çift zaman dilimi dilimlerini gösterebileceksiniz. Yalnızca daha yüksek bir TF gösteremeyeceksiniz, aynı zamanda TF grafiğini ve ARTIK daha yüksek TF'yi de gösterebileceksiniz: YUVARLAK BÖLGELERİ GÖSTERMEK. Tüm Arz Talebi tüccarları buna bayılacak. :) Önemli Bilgiler Açıkland
IX Power MT5
Daniel Stein
5 (3)
IX Power   nihayet FX Power'ın rakipsiz hassasiyetini Forex dışı sembollere getiriyor. En sevdiğiniz endeksler, hisse senetleri, emtialar, ETF'ler ve hatta kripto para birimlerindeki kısa, orta ve uzun vadeli eğilimlerin yoğunluğunu doğru bir şekilde belirler. Terminalinizin sunduğu   her şeyi analiz   edebilirsiniz. Deneyin ve işlem yaparken   zamanlamanızın   nasıl   önemli ölçüde iyileştiğini   deneyimleyin. IX Power Temel Özellikler 100 hassas, yeniden boyanmayan hesaplama sonuçları -
ADR Ters Çevirme Göstergesi, normal ortalama günlük aralığına göre fiyatın şu anda nerede işlem gördüğünü bir bakışta size gösterir. Fiyat, ortalama aralığı ve seçtiğiniz seviyenin üzerindeki seviyeleri aştığında, açılır pencere, e-posta veya push yoluyla anında uyarılar alacaksınız, böylece hızlı bir şekilde geri çekilmelere ve geri dönüşlere atlayabilirsiniz. Gösterge, grafikte ortalama günlük aralık uç noktalarında yatay çizgiler ve ayrıca fiyatları aşan matematiksel olasılıkları olan seviye
Gartley Hunter Multi
Siarhei Vashchylka
5 (7)
Gartley Hunter Multi - An indicator for searching for harmonic patterns simultaneously on dozens of trading instruments and on all possible timeframes. Manual (Be sure to read before purchasing) | Version for MT4 Advantages 1. Patterns: Gartley, Butterfly, Shark, Crab. Bat, Alternate Bat, Deep Crab, Cypher 2. Simultaneous search for patterns on dozens of trading instruments and on all possible timeframes 3. Search for patterns of all possible sizes. From the smallest to the largest 4. A
TPA True Price Action indicator reveals the true price action of the market makers through 100% non-repainting signals strictly at the close of a candle! TPA shows entries and re-entries, every time the bulls are definitely stronger than the bears and vice versa. Not to confuse with red/green candles. The shift of power gets confirmed at the earliest stage and is ONE exit strategy of several. There are available now two free parts of the TPA User Guide for our customers. The first "The Basics"
** All Symbols x All Timeframes scan just by pressing scanner button ** ***Contact me after purchase to send you instructions and add you in "123 scanner group" for sharing or seeing experiences with other users. After 17 years of experience in the markets and programming, Winner indicator is ready. I would like to share with you! Introduction The 123 Pattern Scanner indicator with a special enhanced algorithm is a very repetitive common pattern finder with a high success rate . Interestingly,
Yeni Başlayanlar veya Uzman Tüccarlar için En İyi Çözüm! Bu Gösterge benzersiz, yüksek kaliteli ve uygun fiyatlı bir ticaret aracıdır çünkü bir dizi tescilli özellik ve yeni bir formül ekledik. Sadece BİR grafik ile 28 Forex çifti için Döviz Gücünü okuyabilirsiniz! Yeni bir trendin veya scalping fırsatının tam tetik noktasını belirleyebildiğiniz için ticaretinizin nasıl gelişeceğini hayal edin? Kullanım kılavuzu:   buraya tıklayın Bu ilk olan, orijinal! Değersiz bir özenti klonunu almayın
**   All Symbols   x   All Timeframes   scan just by pressing scanner button ** *** Contact me after the purchase to send you instructions and add you in "Trend Reversal group" for sharing or seeing experiences with other users. Introduction: Trendlines are the most famous technical analysis in trading . Trendlines continually form on the charts of markets across all the different timeframes providing huge opportunities for traders to jump in and profit on the action. In the other hand,  The tre
Bu gösterge paneli, seçilen semboller için mevcut en son   harmonik kalıpları   gösterir, böylece zamandan tasarruf edersiniz ve daha verimli olursunuz /   MT4 sürümü . Ücretsiz Gösterge:   Basic Harmonic Pattern Gösterge sütunları Symbol :   seçilen semboller görünecektir Trend:   yükseliş veya düşüş Pattern :   desen türü (gartley, kelebek, yarasa, yengeç, köpekbalığı, cypher veya ABCD) Entry :   giriş fiyatı SL:   zararı durdur fiyatı TP1:   1. kar alma fiyatı TP2:   2. kar alma fiyatı
Yazarın diğer ürünleri
Göreceli Güç Endeksi (RSI) göstergesinin çoklu para birimi ve çoklu zaman çerçeveli modifikasyonu. Parametrelerde istediğiniz para birimini ve zaman dilimlerini belirtebilirsiniz. Ayrıca panel aşırı alım ve aşırı satım seviyelerini geçerken bildirim gönderebilir. Noktalı bir hücreye tıkladığınızda bu sembol ve nokta açılacaktır. Bu MTF Tarayıcıdır. Kontrol panelini grafikten gizlemenin anahtarı varsayılan olarak "D"dir. Para Birimi Gücü Ölçer'e benzer şekilde, Kontrol Paneli belirli bir par
Çoklu para birimi ve çoklu zaman dilimi göstergesi Inside Bar (IB). Parametrelerde istediğiniz para birimini ve zaman dilimini belirtebilirsiniz. Panel, en son bulunan İç Çubuk (ve Ana Çubuk) formasyonunu, mevcut fiyat pozisyonunu ve Ana ve İç Çubuk seviyelerinin kırılmasını görüntüler. Hücrelerdeki çubukların ve metnin boyutunu ve rengini ayarlayabilirsiniz. Gösterge aynı zamanda seviyeler kırıldığında da bildirim gönderebiliyor. Noktalı bir hücreye tıkladığınızda belirtilen sembol ve nokta aç
Inside Bar Dashboard
Taras Slobodyanik
5 (1)
Çoklu para birimi ve çoklu zaman dilimi göstergesi Inside Bar (IB). Parametrelerde istediğiniz para birimini ve zaman dilimini belirtebilirsiniz. Panel, en son bulunan İç Çubuk (ve Ana Çubuk) formasyonunu, mevcut fiyat pozisyonunu ve Ana ve İç Çubuk seviyelerinin kırılmasını görüntüler. Hücrelerdeki çubukların ve metnin boyutunu ve rengini ayarlayabilirsiniz. Gösterge aynı zamanda seviyeler kırıldığında da bildirim gönderebiliyor. Noktalı bir hücreye tıkladığınızda belirtilen sembol ve nokta aç
Pro Sessions MT4
Taras Slobodyanik
4 (3)
Bu, dört seans boyunca tüm seviyeleri (Açık-Yüksek-Düşük-Kapanış) görüntüleyebilen işlem seanslarının bir göstergesidir. Gösterge aynı zamanda oturum düzeylerini de tahmin edebilir. Oturumlar çizgiler veya dikdörtgenler (boş veya dolu) ile çizilebilir, çizgiler bir sonraki oturuma uzatılabilir. Kısayol tuşlarına (varsayılan olarak '1', '2', '3', '4') basarak her oturumu kolayca gizleyebilir/gösterebilirsiniz. ASR (Ortalama Oturum Aralığı) satırlarını görebilirsiniz (varsayılan kısayol tuşu 'A
ADX Dashboard MT5
Taras Slobodyanik
5 (3)
ADX göstergesi trendi ve gücünü belirlemek için kullanılır. Fiyatın yönü +DI ve -DI değerleriyle, ADX değeri ise trendin gücünü gösterir. +DI -DI'nin üzerindeyse piyasa yükseliş trendindedir, tam tersi ise düşüş trendindedir. ADX 20'nin altında ise kesin bir yön yoktur. Gösterge bu seviyeyi kırdığı anda orta güçte bir trend başlıyor. 40'ın üzerindeki değerler güçlü bir trendi (düşüş trendi veya yükseliş trendi) gösterir. Ortalama Yönlü Hareket Endeksi (ADX) göstergesinin çoklu para birimi ve
ZigZag göstergesinin çoklu para birimi ve çoklu zaman çerçevesi modifikasyonu. Piyasanın mevcut yönünü, son hareketin yüksekliğini, bu hareketteki çubuk sayısını ve ZigZag'ın önceki noktasının (yatay çizgi) kırılmasını görüntüler. Bu MTF Tarayıcıdır. Parametrelerde istediğiniz para birimini ve zaman dilimlerini belirtebilirsiniz. Ayrıca panel, ZigZag yön değiştirdiğinde veya önceki noktada bir ilerleme olduğunda bildirim gönderebilir. Noktalı bir hücreye tıkladığınızda bu sembol ve nokta açıl
ZigZag Lines MTF
Taras Slobodyanik
4.27 (11)
Çoklu zaman dilimi ZigZag göstergesi. Destek/direnç yatay çizgilerini ve bunların kırılmalarını gösterir, ayrıca piyasanın mevcut hedeflerini de çizer. Ayrıca Fraktallar göstergesinin çizgilerini ve diğer dönemlere ait mumları da görüntüleyebilir (Üç Aylığa kadar). Gösterge son (geçerli) noktayı yeniden çizer ve bazı durumlarda son 2-3 noktayı değiştirebilir. Tüm çizgiler nesneler olarak çizilir (gösterge arabellekleri değil, ancak EA için veri alma olasılığı vardır). Uzman Danışmanda kulla
ZigZag Dashboard for MT4
Taras Slobodyanik
4.75 (4)
ZigZag göstergesinin çoklu para birimi ve çoklu zaman çerçevesi modifikasyonu. Piyasanın mevcut yönünü, son hareketin yüksekliğini, bu hareketteki çubuk sayısını ve ZigZag'ın önceki noktasının (yatay çizgi) kırılmasını görüntüler. Bu MTF Tarayıcıdır. Parametrelerde istediğiniz para birimini ve zaman dilimlerini belirtebilirsiniz. Ayrıca panel, ZigZag yön değiştirdiğinde veya önceki noktada bir ilerleme olduğunda bildirim gönderebilir. Noktalı bir hücreye tıkladığınızda bu sembol ve nokta açıl
MACD Dashboard
Taras Slobodyanik
Çoklu para birimi ve çoklu zaman dilimi göstergesi MACD. Kontrol paneli hem Geleneksel (gerçek) MACD'yi hem de MetaTrader'da yerleşik olan MACD'yi görüntüleyebilir. Panelde göstergenin mevcut durumunu, MACD çizgilerinin hareket yönünü, kesişimlerini ve gösterge grafiğini içeren bir açılır pencereyi görebilirsiniz. Parametrelerde istediğiniz herhangi bir çift sembolü ve zaman dilimini belirleyebilirsiniz. Tarayıcı aynı zamanda birbirini kesen çizgiler ve Sıfır seviyesini geçen çizgiler hakkınd
Symbol Manager or Grid Manager, designed to group orders into one position (by symbol and by direction). This utility will be useful to multi-currency traders, who can have multiple orders on several pairs. You will be able to see the total number of lots, the total profit, and set virtual stop loss and virtual take profit. To set a real TP (or SL), you must first set the virtual value, and then enter the command in this cell: "set". If you want to set real TP/SL for all orders at once, then en
Stokastik Osilatörün çoklu para birimi ve çoklu zaman çerçevesi modifikasyonu. Parametrelerde istediğiniz para birimini ve zaman dilimlerini belirtebilirsiniz. Panel, Sinyal ve Ana (stokastik geçiş) çizgilerinin mevcut değerlerini ve kesişimlerini görüntüler. Ayrıca gösterge aşırı alım ve aşırı satım seviyelerini geçerken bildirim gönderebilir. Noktalı bir hücreye tıkladığınızda bu sembol ve nokta açılacaktır. Bu MTF Tarayıcıdır. Para Birimi Gücü Ölçer'e benzer şekilde, Kontrol Paneli belirli b
ADX Dashboard
Taras Slobodyanik
5 (3)
ADX göstergesi trendi ve gücünü belirlemek için kullanılır. Fiyatın yönü +DI ve -DI değerleriyle, ADX değeri ise trendin gücünü gösterir. +DI -DI'nin üzerindeyse piyasa yükseliş trendindedir, tam tersi ise düşüş trendindedir. ADX 20'nin altında ise kesin bir yön yoktur. Gösterge bu seviyeyi kırdığı anda orta güçte bir trend başlıyor. 40'ın üzerindeki değerler güçlü bir trendi (düşüş trendi veya yükseliş trendi) gösterir. Ortalama Yönlü Hareket Endeksi (ADX) göstergesinin çoklu para birimi ve
Göreceli Güç Endeksi (RSI) göstergesinin çoklu para birimi ve çoklu zaman çerçeveli modifikasyonu. Parametrelerde istediğiniz para birimini ve zaman dilimlerini belirtebilirsiniz. Ayrıca panel aşırı alım ve aşırı satım seviyelerini geçerken bildirim gönderebilir. Noktalı bir hücreye tıkladığınızda bu sembol ve nokta açılacaktır. Bu MTF Tarayıcıdır. Kontrol panelini grafikten gizlemenin anahtarı varsayılan olarak "D"dir. Para Birimi Gücü Ölçer'e benzer şekilde, Kontrol Paneli belirli bir par
Lines Profit Loss
Taras Slobodyanik
4.82 (22)
Gösterge mevcut sembol üzerinde kârı (zararı) gösterir. Mevcut kar veya zararı görüntülemek için çizgiyi serbestçe sürükleyip bırakabilirsiniz. Parametreler Calculation in money or in points — kar/zararı puan veya para cinsinden hesaplayın. Add pending orders to calculate — hesaplamalarda bekleyen siparişleri dikkate alın. Magic Number (0 - all orders on symbol) — belirli sıraları değerlendirmek gerekiyorsa sihirli sayı. Offset for first drawing (points from the average price) — ilk başla
FREE
Lines Profit Loss MT5
Taras Slobodyanik
4.59 (17)
Gösterge mevcut sembol üzerinde kârı (zararı) gösterir. Mevcut kar veya zararı görüntülemek için çizgiyi serbestçe sürükleyip bırakabilirsiniz. Parametreler Calculation in money or in points — kar/zararı puan veya para cinsinden hesaplayın. Add pending orders to calculate — hesaplamalarda bekleyen siparişleri dikkate alın. Magic Number (0 - all orders on symbol) — belirli sıraları değerlendirmek gerekiyorsa sihirli sayı. Offset for first drawing (points from the average price) — ilk başla
FREE
Pro Sessions MT5
Taras Slobodyanik
5 (1)
Bu, dört seans boyunca tüm seviyeleri (Açık-Yüksek-Düşük-Kapanış) görüntüleyebilen işlem seanslarının bir göstergesidir. Gösterge aynı zamanda oturum düzeylerini de tahmin edebilir. Oturumlar çizgiler veya dikdörtgenler (boş veya dolu) ile çizilebilir, çizgiler bir sonraki oturuma uzatılabilir. Kısayol tuşlarına (varsayılan olarak '1', '2', '3', '4') basarak her oturumu kolayca gizleyebilir/gösterebilirsiniz. ASR (Ortalama Oturum Aralığı)   satırlarını görebilirsiniz (varsayılan kısayol tuşu
News Dashboard MT4
Taras Slobodyanik
4.33 (6)
Bu kontrol paneli üç kaynaktan güncel haberleri görüntüler: ForexFactory.com web sitesinden (FFC takvimi), Investing.com web sitesinden ve mql5.com Ekonomik Takviminden. Haberleri etki alanına ve ülkeye göre sıralayabilir, tek tıkla grafikte görüntüleyebilirsiniz. 'Ctrl' tuşunu basılı tutarak sıralamak için birkaç farklı 'para birimi' veya 'etki' seçebilirsiniz. Ayrıca bu yardımcı program yalnızca tahmini değil, aynı zamanda sitede göründükten sonraki gerçek değerleri de gösterir. Her haber içi
Standart Sapma Kanalının çoklu para birimi ve çoklu zaman çerçevesi göstergesi. Piyasanın mevcut yönünü görüntüler. Panelde, doğrusal regresyon kanalının seviyelerindeki kırılmaları ve dokunuşları (fiyata göre) görebilirsiniz. Parametrelerde istediğiniz para birimini ve zaman dilimini belirtebilirsiniz. Ayrıca gösterge, seviyelere dokunulduğunda bildirim gönderebilir. Bir hücreye tıkladığınızda bu simge ve nokta açılacaktır. Bu MTF Tarayıcıdır. Kontrol panelini grafikten gizlemenin anahtarı v
Bu kontrol paneli üç kaynaktan güncel haberleri görüntüler: ForexFactory.com web sitesinden (FFC takvimi), Investing.com web sitesinden ve mql5.com Ekonomik Takviminden. Haberleri etki alanına ve ülkeye göre sıralayabilir, tek tıkla grafikte görüntüleyebilirsiniz. 'Ctrl' tuşunu basılı tutarak sıralamak için birkaç farklı 'para birimi' veya 'etki' seçebilirsiniz. Ayrıca bu yardımcı program yalnızca tahmini değil, aynı zamanda sitede göründükten sonraki gerçek değerleri de gösterir. Her haber içi
Gösterge Bollinger Bantlarının çoklu para birimi ve çoklu zaman çerçevesi modifikasyonu. Kontrol panelinde Bollinger Bantlarının kırılmalarını ve dokunuşlarını görebilirsiniz. Parametrelerde istediğiniz para birimini ve zaman dilimlerini belirleyebilirsiniz. Gösterge ayrıca fiyat Bollinger Bantlarına dokunduğunda, mevcut oynaklık değiştiğinde (genişlediğinde veya düştüğünde) ve fiyat tüm bantlara dokunduğunda bildirim gönderebilir. Noktalı bir hücreye tıkladığınızda bu sembol ve nokta açılacakt
Levels of Timeframes
Taras Slobodyanik
5 (1)
Gösterge, diğer (ve standart olmayan) zaman dilimlerindeki Yüksek/Düşük/Açık/Kapanış Seviyelerini gösterir - Yıl, 6 Ay, 4 Ay, 3 Ay, 2 Ay, Ay, Hafta, Gün, H3-H6-H8-H12 Saat . Ayrıca mumları açmak ve sanal mumlar oluşturmak için vardiyayı da ayarlayabilirsiniz. Bu zaman dilimlerinden biri için "Dönem ayırıcılar" dikey çizgiler biçiminde mevcuttur. Uyarılar, mevcut veya önceki seviyelerin kırılmaları (dün/geçen haftanın Yüksek/Düşük çizgisinin kırılması vb.) için yapılandırılabilir. Ayrıca tüm sev
Çoklu zaman dilimi ZigZag göstergesi. Destek/direnç yatay çizgilerini ve bunların kırılmalarını gösterir, ayrıca piyasanın mevcut hedeflerini de çizer. Ayrıca Fraktallar göstergesinin çizgilerini ve diğer dönemlere ait mumları da görüntüleyebilir (Üç Aylığa kadar). Gösterge son (geçerli) noktayı yeniden çizer ve bazı durumlarda son 2-3 noktayı değiştirebilir. Tüm çizgiler nesneler olarak çizilir (gösterge arabellekleri değil, ancak EA için veri alma olasılığı vardır). Uzman Danışmanda kulla
Angle Dashboard
Taras Slobodyanik
5 (1)
This is a multicurrency and multitimeframe indicator that calculates the angle between two points. Points for measuring the angle can be taken from the ZigZag (the last two points), or from the Moving Average (between two given bars), or it can be the closing prices of bars. Angle measurement is possible in degrees or in radians. You can select the scale for the calculation. For a better understanding of the indicator, you can study the free Angle High Low indicator. In the parameters you can
MA Dashboard
Taras Slobodyanik
4.5 (2)
Hareketli Ortalama (MA) göstergesinin çok para birimi ve çok zaman çerçeveli modifikasyonu. Kontrol panelinde göstergenin mevcut durumunu görebilirsiniz - Hızlı MA ve Yavaş MA'nın kırılmaları ve dokunuşları (fiyata göre) ve ayrıca MA çizgilerinin birbirleri arasındaki kesişimi (hareketli ortalama geçiş). Parametrelerde istediğiniz para birimini ve zaman dilimlerini belirleyebilirsiniz. Ayrıca gösterge, fiyatın çizgilere temas etmesi ve geçişleri hakkında bildirimler gönderebilir. Noktalı bir hü
Gösterge Bollinger Bantlarının çoklu para birimi ve çoklu zaman çerçevesi modifikasyonu. Kontrol panelinde Bollinger Bantlarının kırılmalarını ve dokunuşlarını görebilirsiniz. Parametrelerde istediğiniz para birimini ve zaman dilimlerini belirleyebilirsiniz. Gösterge ayrıca fiyat Bollinger Bantlarına dokunduğunda, mevcut oynaklık değiştiğinde (genişlediğinde veya düştüğünde) ve fiyat tüm bantlara dokunduğunda bildirim gönderebilir. Noktalı bir hücreye tıkladığınızda bu sembol ve nokta açılacakt
Time Scale
Taras Slobodyanik
4.8 (10)
The indicator draws the time scale on the chart. You can specify the time offset, adjust the size and font to display on the chart (it is displaying your local time on your chart instead of MT time). You can also select the desired format for displaying the date and time. While holding down the middle mouse button, and moving the cursor, a slider will appear on the scale. You may be interested in my other product , which contains a more advanced version of the Time Scale. Parameters Hours (tim
FREE
Stokastik Osilatörün çoklu para birimi ve çoklu zaman çerçevesi modifikasyonu. Parametrelerde istediğiniz para birimini ve zaman dilimlerini belirtebilirsiniz. Panel, Sinyal ve Ana (stokastik geçiş) çizgilerinin mevcut değerlerini ve kesişimlerini görüntüler. Ayrıca gösterge aşırı alım ve aşırı satım seviyelerini geçerken bildirim gönderebilir. Noktalı bir hücreye tıkladığınızda bu sembol ve nokta açılacaktır. Bu MTF Tarayıcıdır. Para Birimi Gücü Ölçer'e benzer şekilde, Kontrol Paneli belirli b
Gösterge, ZigZag göstergesine, İşlem Seanslarına, Fraktallara veya Mumlara (standart olmayan zaman dilimleri dahil: Yıl, 6 Ay, 4 Ay, 3 Ay, 2 Ay) (Otomatik Fibo Geri Çekme) dayalı olarak Fibonacci seviyelerini otomatik olarak çizer. Fibonachi hesaplaması için daha yüksek bir zaman dilimini seçebilirsiniz. Mevcut çubuk her kapandığında seviyeler yeniden çizilir. Belirtilen seviyeleri geçerken uyarıları etkinleştirmek mümkündür. Ayrıca tarihteki seviyeleri de analiz edebilirsiniz. Bunun için "Ge
Heikin Ashi Dashboard
Taras Slobodyanik
5 (3)
Çoklu para birimi ve çoklu zaman çerçeveli Heikin Ashi göstergesi. Piyasanın mevcut durumunu gösterir. Tarayıcı panelinde mevcut trendin yönünü, gücünü ve çubuk sayısını görebilirsiniz. Konsolidasyon/Tersine Dönme mumları da renk kullanılarak gösterilir. Parametrelerde istediğiniz para birimini ve periyodu belirtebilirsiniz. Ayrıca gösterge, trend değiştiğinde veya tersine dönüş ve konsolidasyon mumları (dojiler) göründüğünde bildirim gönderebilir. Bir hücreye tıkladığınızda bu simge ve nokta a
Filtrele:
spot007
93
spot007 2024.05.02 06:01 
 

Fantastic product. I really love this. Easy to set up, easy to use. So simple and does exactly what I need. Thank you!

Darvero
97
Darvero 2024.03.26 21:46 
 

Отличный индикатор, спасибо.

nestor jose
28
nestor jose 2024.03.16 17:47 
 

Excelente

0xJes
56
0xJes 2024.02.26 06:57 
 

The fact that MT5 uses broker time and not your local time sucks, this extension fixes it and adds useful functionality!!!

mi rou
18
mi rou 2023.12.09 15:31 
 

Thank you so much brother.

Dixit Khosla
38
Dixit Khosla 2023.09.21 01:11 
 

Excellent product. Seamless.

lolissimo
75
lolissimo 2023.08.19 20:12 
 

It has everything necessary to be an excellent and simple application, but there is something that does not work well and starts to slow down the graphics, minutes after installing it

Taras Slobodyanik
64625
Geliştiriciden yanıt Taras Slobodyanik 2023.08.20 09:53
Hello. I need more information on how I can repeat this situation for myself.
IK°L
815
IK°L 2023.07.11 23:00 
 

This solves the entanglements due to time lags, between the terminal, your local time, the broker, summer time, etc. It works like a charm!!

Anton Hluscu
50
Anton Hluscu 2023.04.22 23:01 
 

I like this time scale very much

GrnElf
65
GrnElf 2022.12.09 16:55 
 

It works!

are1971
738
are1971 2022.08.20 16:30 
 

Excellent indicator it makes trading easier

Mary Gomes
277
Mary Gomes 2022.06.23 07:48 
 

Beautiful Indicator

DuahCapital
34
DuahCapital 2021.08.18 21:03 
 

Is there any option to change the time from 24 hour format to 12 hour format?

Taras Slobodyanik
64625
Geliştiriciden yanıt Taras Slobodyanik 2021.08.31 09:46
yes, added
kinjal parekh
1892
kinjal parekh 2021.05.19 08:13 
 

Excellento......

Andre Gomes
2771
Andre Gomes 2021.03.02 13:39 
 

Really great!

Scott Cranmer
46
Scott Cranmer 2020.10.31 10:53 
 

Excellent. Does exactly as advertised. Many thanks.

Andrii Diachenko
4592
Andrii Diachenko 2019.12.27 14:44 
 

Отличный инструмент! Тарас - огромное спасибо за то, что внесли изменения по моим пожеланиям.

[Silindi] 2019.11.02 18:41 
 

Kullanıcı incelemeye herhangi bir yorum bırakmadı

OLEKSІI POPOV
183
OLEKSІI POPOV 2019.01.23 17:35 
 

Kullanıcı incelemeye herhangi bir yorum bırakmadı

İncelemeye yanıt
Sürüm 1.80 2023.08.22
1) Fixed divide-by-zero bug.
2) Code optimization for MT5.
Sürüm 1.70 2021.08.28
1) Fixed a bug with the delay in updating the number of bars on the chart using the CHART_FIRST_VISIBLE_BAR function.
Sürüm 1.60 2021.08.27
1) Optimization of the code, acceleration of the indicator.
Sürüm 1.50 2021.08.26
1) Added parameters to control the date and time format (on the scale and on the mouse).
2) Fixed a bug when loading an indicator from a template.
Sürüm 1.40 2020.06.10
1) Recompilation for the new build.
Sürüm 1.30 2020.01.13
1) Added verification of the middle mouse button.