Sürüm 4.2
2020.05.08
- Fixed Indicator sometimes not working during weekends...
Sürüm 4.1
2020.04.08
- Minor improvements in some calculations
- Draw Divergence arrows in sub window
Sürüm 4.0
2020.04.01
- Minor Improvements
Sürüm 3.9
2020.03.28
- Change colours for pending orders (Risk Reward Ratio).
Sürüm 3.8
2020.02.29
New update!
-> Fixed the indicator sometimes not displaying currency strength lines during the weekends.
Sürüm 3.7
2020.02.27
-> Small improvements regarding currency lines labels...
Sürüm 3.6
2020.01.03
- Minor improvements in risk management calculations
Sürüm 3.5
2019.12.09
- Small improvements
Sürüm 3.4
2019.11.28
- Minor improvements
Sürüm 3.3
2019.11.28
- Minor improvements in some calculations...
Sürüm 3.2
2019.09.24
New Update!
- The indicator can now draw smooth lines using the average price.
(The default value/period is 5. But, you can change the smoothness however you like...).
Scroll down from the top in settings and you'll find the parameter...
- Fixed indicator sending alerts in-between time intervals.
- Minor improvements in risk management calculations for accounts that use currencies other than USD.)
Sürüm 3.1
2019.08.21
- Minor Improvements for EXOTIC pairs.
Sürüm 3.0
2019.08.21
- Just a quick fix [H4 timeframe crashing after I updated to version 2.9]
(It was a minor problem, it's fixed now!) [version 3.0]
Sürüm 2.9
2019.08.21
New Update!
- Minor Improvements in some calculations...
Sürüm 2.8
2019.08.20
New Update!
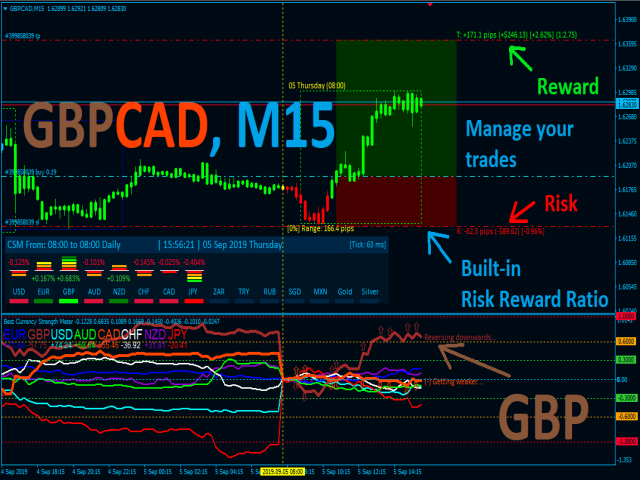
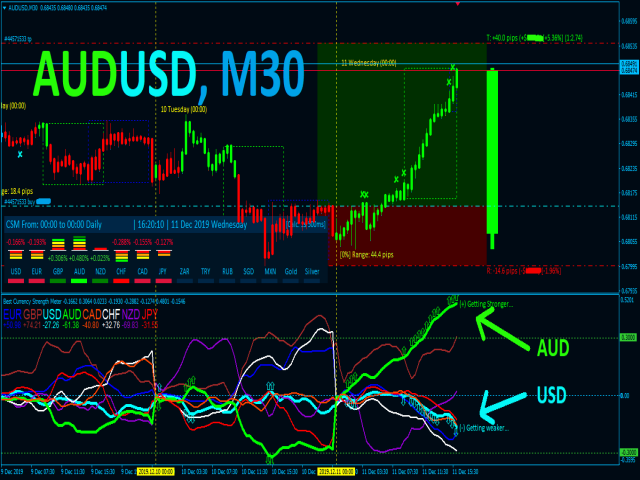
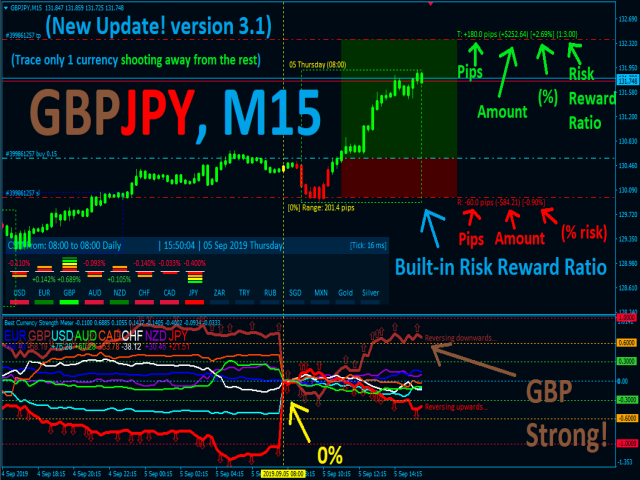
- Added risk-reward ratio in the chart for open and pending orders.
You can also draw it your self. Specify open price, sl, tp and lot size etc...
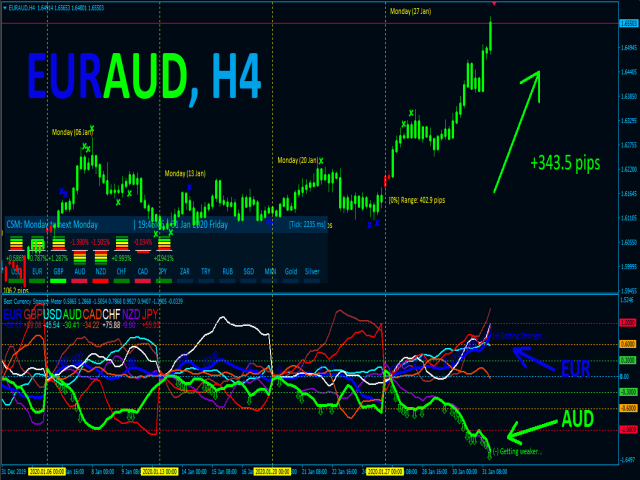
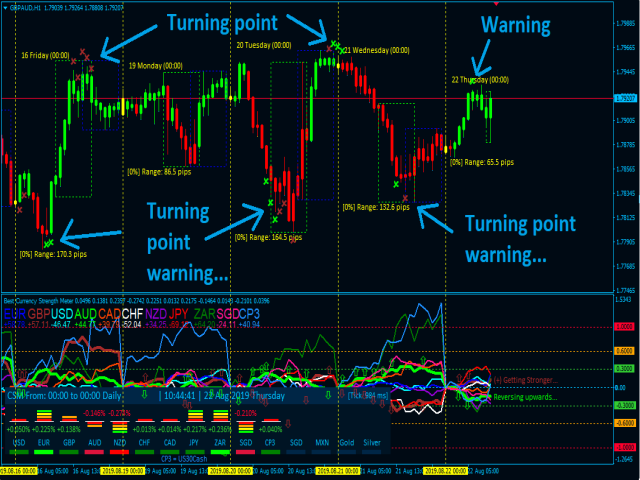
- Added "X" for potential turning points in the chart. If the base/quote currecy is over bought/sold. The indicator will draw 'X', indicating that the market might start turning around [Its a warning for potential turning point]. The colour of 'X' will indicate which currency is over bought/sold.
Sürüm 2.7
2019.08.19
New Update!
- Fixed Indicator sometimes crashing when opening in W1 or MN timeframes.
- Fixed Indicator sometimes crashing when opening in Gold M1 & M5 timeframes.
I'm working on more of the requests you guys sent me. I'll update in few days...
-> If you haven't contacted me for more information regarding the indicator and how to use it, then, contact me via email.
-> And if you need any assistance in setting up the indicator or Red text/message on your screen, you may contact me as well...
---[ More updates coming up ]---
Sürüm 2.6
2019.08.06
New update!
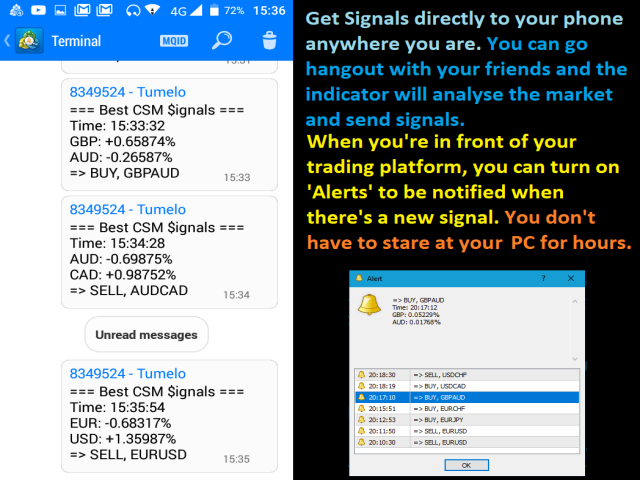
- Added notifications for divergence signals as another option.
- Signals will only be sent after the candle closed (Reduced number of signals)
- Added the ability to filter signals:
(You can choose to receive signals only for a certain currency or currency pairs list you want to focus on)
(Enable 'Filter_Signals' -> 'Yes') and choose how would you like to receive signals for which pairs...
+ Minor improvements...
Sürüm 2.5
2019.04.21
New update!
The indicator has two (2) types of strategies programmed.
- Strategy 1: Day Trading / Short term trading. [Option 1 in settings]
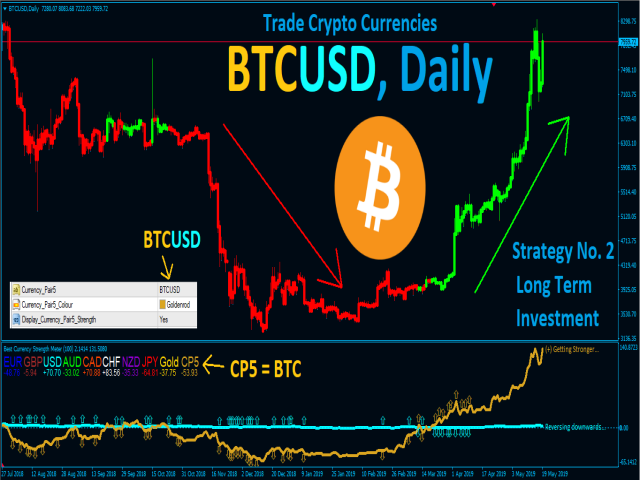
- Strategy 2: Long Term trading (Higher timeframes. [Option 2 & 3 in settings]
Strategy 1 - is all about trading diverging currencies for a short/limited period of time.
Strategy 2 - is about trading long term trend. This strategy uses a period for calculations. You can change the period to any number in settings. The default period is set to 20.
The indicator is suitable for short term and long term traders.
For more insight, scroll through the comments and check comment no. 40 (#40).
Sürüm 2.4
2019.04.16
New update!
- The indicator now colours candles to identify the trend based on currency strength calculations.
- When the market is going up, the candles will be coloured in green.
- When the market is going down, the candles will be coloured in red.
You can change to any colour you like...
Imoprtant:
- Right click the chart and go to properties -> common.
- Uncheck the box "Chart on foreground"
--->>> Make sure to uncheck the box "Chart on foreground" in properties/common to be able to see coloured candles.
Sürüm 2.3
2019.04.15
New update!
- The indicator now displays all types of signals in 1 window.
Tip:
- You don't have to wait for signals.
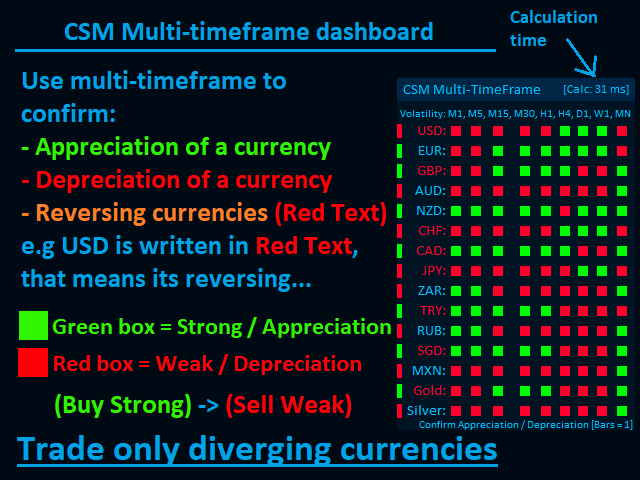
-> You can enter the market anytime using "CSM Multi-timeframe" dashboard.
This dashboard was designed to tell you which currencies you should be trading at that moment.
It calculates across all timeframes and will tell if the currency is appreciating/depreciating.
Example:
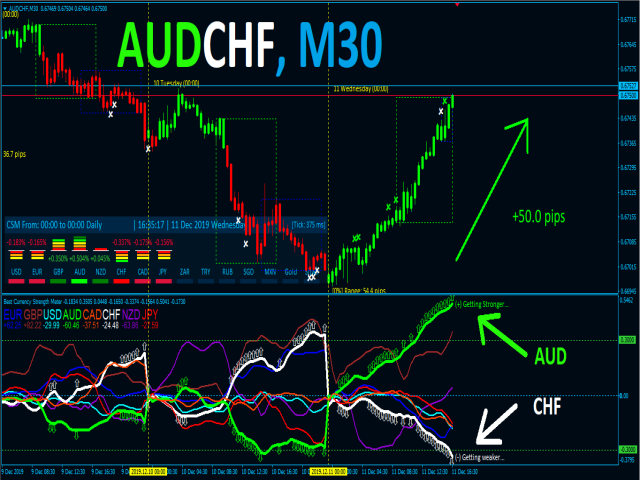
- if GBP is strong (+0.235%) and USD is weak (-0.133%). (Choose any currency which is strong against weak currency).
Since GBP is strong, check "CSM Multi-timeframe" dashboard if GBP is further appreciating/getting stronger on multiple timeframes.
And also check if USD is further depreciating/getting weaker.
In that case, its a good time to enter the market, as long as they are diverging from each other.
The indicator will tell you which ones are appreciating or depreciating.
Remember - If you're buying "EURUSD" currency pair, That means you're:
- Buying EUR currency (Base currency)
- Simultaneously selling USD currency. (Quote currency)
Understand the relationship between Base currency and Quote currency.
Sürüm 2.2
2019.04.15
New update!
- Removed the small breakout alert bug!
Sürüm 2.1
2019.03.26
Disabled Alerts for level breakout, the alert bug will be fixed on the next update.
Sürüm 2.0
2019.03.24
New Update!
- The indicator now displays numbers below currency labels indicating whether a currency is overbought or oversold.
(Above +80 = Over bought | Below -20 = Over sold)
When the value increases, it will be a positive number (e.g +66.25), and when the value is decreasing, it will be a negative number (e.g -33.21)
Tip: When a currency is overbought, it is more likely to start depreciating or lose strength.
When a currency is oversold, it is more likely to start appreciating or gain strength.
This is very important because it will also help to time your trades...
-> For a strong currency, trade when the value is increasing/positive.
-> For a weak currency, trade when the value is decreasing/negative.
Trade diverging currencies...
Sürüm 1.9
2019.03.18
New update!
- Add up to 3 levels targeting currencies that are breaking out of each level.
- The indicator will alert you or send a notification to your phone when strong/weak currencies break out of each level specified by you.
> This will make it easier to target which currencies are moving or strongly trending.
Sürüm 1.7
2019.02.24
New update!
- The multi-timeframe dashboard now has a Multi-Timeframe currency trend analysis. (This will make it easier to spot trending currencies and reversing currencies...)
- Plus other improvements as well...
Enjoy! :)
Sürüm 1.6
2019.02.05
New update!
- The indicator now displays divergence arrows in a window.
- Added currency status comment.
- Added more trading sessions options.
Sürüm 1.5
2019.01.30
New update!
- Modified a few things in Risk Management calculations...
Sürüm 1.4
2019.01.28
New update with new features!
New Features:
- CSM Multi-timeframe now has confirmation boxes to confirm appreciation or depreciation of a currency.
If a currency is reversing, the text in multi-timeframe will be written in red colour.
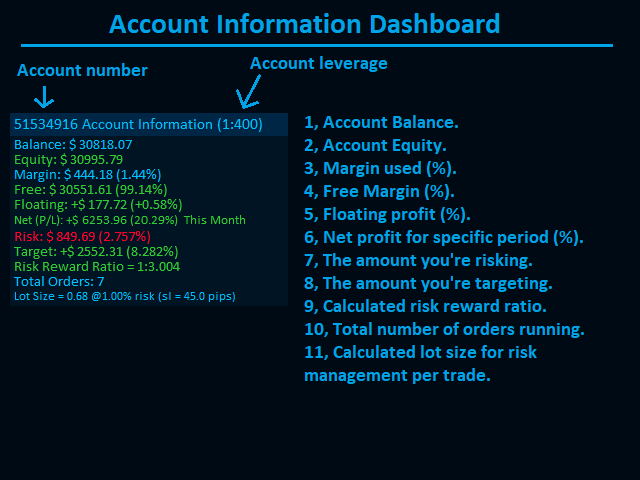
- Account Information dashboard. This dashboard will display your account leverage, balance, equity, margin (%), free margin (%), floating profit (%), net profit for a specified period, the amount you're risking and targeting, risk-reward ratio calculation, the total number of orders running.
It will calculate the lot size you should use to only risk a certain percentage of your account depending on where you want to place your stop loss.
- Trading Sessions > it will indicate (draw boxes) each trading session in a chart.
- It will calculate the range (in pips) of each period.
Sürüm 1.3
2018.12.26
New Update!
The code is restructured to prevent any type of crashing during testing and live chart. It was tested before publishing.
New features:
- Send a text message to your phone just for testing. You can type any message and see if you'll be able to receive it on your phone. You need to test so that you know for sure you'll be able to receive $ignals directly to your phone. Watch the video to learn how you can activate it.
Please note! this does not work during testing... only in a live chart.
If there's any problem, go to my main page to see my contact details and don't hesitate to contact me...
Enjoy!!! :)
Sürüm 1.2
2018.12.26
The reason the chart is empty or does not display data is that this indicator is a multi-timeframe indicator and needs all data to make calculations.
Follow instructions:
1. The indicator needs data (M1,M5,M15,M30,H1,H4,D1,W1,MN) for all 28 FOREX pairs + Gold + Silver.
- All timeframes MUST have data. Remember, when you open a new empty chart, after few seconds, it shows candlesticks. That means MT4 has downloaded data for that chart & timeframe. You need to cycle through all timeframes for all pairs. And then when you're done, RESTART MT4 (Close it to save info and open it again).
2. Check Symbol names for GOLD/XAUUSD and SILVER/XAGUSD in settings.
- Change those symbol names to the one your broker supports. Also, check Prefix and Suffix.
Without data, there's nothing to calculate. MT4 is an older version. MT5 is more advanced.
If all instructions are followed and all data is downloaded and saved. The indicator WILL WORK.
My other clients are using it without any problem...
ENJOY!!! :)
Sürüm 1.1
2018.12.25
New Update!
- The indicator will explain and tell you what to do when the window is empty or doesn't display anything... :)











Please send manual to me for my study. Thanks.